


Impulsivity is a concept defined as short-sightedness or lack of forethought with respect to decision making and has been operationalized as difficulty in delaying gratification or tendency to place a disproportionately higher value on immediate rewards v. rewards received in the future, referred to as delay discounting( Reference Ainslie 1 ). Previous research has demonstrated associations between greater delay discounting and less nutritious diets( Reference Appelhans, Waring and Schneider 2 – Reference Huston and Finke 5 ). However, little research has been conducted on food purchasing and food availability in the home, factors that would presumably influence diet quality, with respect to delay discounting. Factors considered when making food purchasing decisions, such as intentional use of food labels to assess nutritional information and ingredients and importance placed on certain characteristics of food products, could be influenced by an individual’s tendency to overvalue immediate gratification relative to benefits received in the future, such as long-term health. Likewise, a home food environment that is lacking in nutritious options might result from the influence of delay discounting on food purchasing behaviours.
There is a wealth of research regarding factors that influence the use of information on food labels to guide purchasing decisions. Research has shown that utilization of food labels for grocery shopping may improve consumption of a healthful diet( Reference Campos, Doxey and Hammond 6 – Reference Neuhouser, Kristal and Patterson 9 ). However, labels are not always utilized by consumers, neither does use of labels always influence food choices( Reference Signal, Lanumata and Robinson 10 – Reference Graham, Lucas-Thompson and Mueller 12 ). Indeed, several studies have reported low usage of labels with rates of use ranging from 23 to 53 %( Reference Ni Mhurchu, Eyles and Jiang 13 – Reference McArthur, Chamberlain and Howard 16 ). Common reasons for not using food labels include competing demands, insufficient time, illiteracy, lack of trust of label contents, diagnosis of a disease, nutrition knowledge, taste, and perceptions of price as being of low importance.
While intentional use of food labels to assess nutritional information and ingredients might inform food purchasing, other factors may influence consumers’ buying decisions. Previous studies found that consumers’ perceptions of more healthful foods as being more expensive, less palatable and more time-intensive in terms of preparation compared with less healthful foods influenced their buying decisions( Reference Jilcott, Laraia and Evenson 17 ). Another influential perception reported for consumers is that shopping for nutritious foods requires a lot of effort. Cost, taste, health, knowledge, mood, socio-economic position, convenience of purchasing and convenience of preparation have also been found to influence food purchasing behaviours( Reference Jilcott, Laraia and Evenson 17 – Reference Honkanen, Olsen and Verplanken 23 ).
In considering the influence of home food environment on people’s dietary behaviours, previous studies have reported several associations. A qualitative study examining the influence of food choice in the home food environment found a significant correlation between the availability of unhealthful foods (such as junk food, soda, confections and chips) and their consumption( Reference Campbell, Crawford and Salmon 24 ). Other studies found correlations between the availability and accessibility of fruits and vegetables in the home and their consumption( Reference Ding, Sallis and Norman 25 , Reference Kegler, Alcantara and Haardorfer 26 ). In terms of determinants of foods in the home, Ding and colleagues found household income rather than community food environment to be associated with foods in the home( Reference Ding, Sallis and Norman 25 ). Additionally, in a study examining the home food environments of overweight and normal-weight adults, overweight adults had fewer low-fat snacks, fruits and vegetables, more high-fat snacks and spreads than did normal weight-adults( Reference Gorin, Phelan and Raynor 27 ).
Recently there has been a growing effort to apply concepts related to delay discounting to interventions to improve dietary quality. Some of these have included monitoring with feedback (which serves as an immediate reward)( Reference Kerr, Harray and Pollard 28 ), commitment devices( Reference Kullgren, Troxel and Loewenstein 29 , Reference Rogers, Milkman and Volpp 30 ), and financial and social incentives for dietary behaviour change( Reference Leahey and Rosen 31 ). However, to develop the most effective interventions, a more complete understanding of the influence of delay discounting on food selection at the point of purchase is needed. Given the paucity of research assessing these associations, the present study aimed to determine the relationships between delay discounting, considerations when making food purchasing decisions and foods in the home among employed adults. The study hypotheses are that participants who demonstrate a greater degree of delay discounting will (i) report having less access to nutritious foods in the home, (ii) report less frequent use of labels, specifically the nutrition facts panel and ingredients list, and (iii) emphasize different considerations when making food purchasing decisions compared with participants with lower rates of discounting. Further understanding the influence of delay discounting on healthfulness of the diet by examining factors that may serve as indicators of consumption of healthful foods could inform interventions to improve food purchasing behaviours and positively impact dietary quality.
Methods
Sampling design and data collection
A cross-sectional online survey of 477 full- and part-time employees of a large university located in the Southeastern USA was conducted. This was part of a larger study, the methods of which are published elsewhere( Reference Garza, Ding and Owensby 3 ). The survey consisted of an online questionnaire that participants completed in October 2012 at a location of their choice. Only those participants who proceeded through the entire questionnaire were included in the data analysis. The university’s institutional review board approved the study protocol and all participants provided informed consent electronically.
Measures
Items from the Flexible Consumer Behavior Survey (FCBS), a component of the National Health and Nutrition Examination Survey (NHANES), were included to characterize food purchasing behaviours and foods in the home( 32 ).
Consideration of food characteristics
Participants were asked to rate the importance they placed on five food characteristics (price, nutrition, taste, ease of preparation, shelf-life) while grocery shopping, using a 4-point Likert-type scale, from 4=‘very important’ to 1=‘not at all important’. The results of principal component analysis indicated that the five food characteristics were divided into two constructs: grocery characteristics (price, ease and shelf-life; α=0·32) and food quality (nutrition and taste; α=0·30). High values of these constructs indicate that the participant places high importance on price, ease, shelf-life, nutrition and taste when shopping. After completing preliminary analyses using principal component analysis, grocery characteristics and food quality became the observed indicators of a latent construct, Shopping Considerations.
Labels
Use of food labels, specifically the nutrition facts panel and the ingredients list, was assessed by asking the participant to rate how often they used each to make food choices when shopping, using a 5-point Likert-type scale from ‘always’ to ‘never’ (α=0·76). High values indicate that participants used the nutrition facts panel and ingredients list as a guide while shopping.
Availability of foods in the home
This was characterized using items such as ‘How often do you have fruits available at home?’, with response options including ‘always’, ‘most of the time’, ‘sometimes’, ‘rarely’ and ‘never’. Similar items were used to assess how often vegetables, salty snacks, milk and sugar-sweetened beverages were available. These were on a 5-point scale: 1=‘never’ and 5=‘always’. Healthful foods are an average of fruits and vegetables available in the home (α=0·62). Unhealthful foods are an average of the snacks and soft drinks available in the home (α=0·55).
Delay discounting
To determine participants’ degree of discounting future rewards, a frequently used binary-choice delay discounting task was employed( Reference Chapman and Elstein 33 ). This task presents participants with a series of binary choices consisting of hypothetical money of varying values and delays. In the present study, participants were asked, ‘Would you prefer $500 now, or $1000 (X days/weeks/months/years) from now?’ Seven delays consisting of 1 day, 1 week, 1 month, 6 months, 1 year, 5 years and 25 years were applied. The value of the immediate monetary reward was adjusted such that values varied according to the participants’ choice in the preceding questions, with each adjustment being half the preceding adjustment( Reference Du, Green and Myerson 34 ). The value of the larger later reward remained constant. Therefore, if a participant chose $1000 a day from now over $500 now, the next question would be, ‘Would you prefer $750 now or $1000 a day from now?’ A choice of $500 now over $1000 a day from now would be succeeded with the question, ‘Would you prefer $250 now or $1000 a day from now?’ With this adjustment algorithm, six questions were required for each of the seven delays, resulting in a total of forty-two questions per participant. The participant theoretically reaches a point of indifference between the smaller immediate choice and a larger delayed one, which is the ultimate goal of the task. This indifference point is calculated as the amount of the smaller reward that would have been offered in the seventh question. This binary choice algorithm was programmed using display logic in Qualtrics survey software. Indifference points for each delay were then used to calculate normalized area under the delay discounting curve (AUC) using the trapezoidal method( Reference Myerson, Green and Warusawitharana 35 ). Normalized values range from 0 to 1. AUC was preferred over discount rate because it is independent of a particular theory (e.g. hyperbolic shape of the discounting function) and tends to be more normally distributed than traditional parameter estimates for discounting functions. Normalized AUC values are indirectly related to degree of delay discounting, with lower AUC values representing greater discounting.
Control variables
Age was a continuous variable reflecting participants’ age in years. Household income was assessed using a 4-point scale indicating the total household income per year (1=<$US 20 000, 2=$US 20 000–69 999, 3=$US 70 000–139 999, 4=≥$US 140 000). Education level was assessed by asking participants to indicate their highest level of education attained at the time of the study.
Grouping variable
Participants’ sex was dummy-coded with 1 indicating a female participant and 0 indicating a male participant.
Statistical analysis
First, we conducted univariate and bivariate analyses of all variables of interest. Second, our goal was to model the relationships across several variables simultaneously and to determine whether those relationships vary across specific groups. Structural equation modelling is particularly suited for that and was used to test the hypothesized model in Fig. 1. Next, we added sex as a grouping variable with two levels (male and female) to the model, which allowed for male and female comparisons across the simultaneous equations. Lastly, to ensure that any differences we noted in the multigroup analysis were statistically significant, we conducted χ 2 tests. During these tests, we systematically constrained or set to zero each path and compared the new χ 2 value with the previous (unconstrained) model’s χ 2 value. If the change in χ 2 exceeded a critical value (determined by the df), the constrained path was determined to be significantly different across groups and the constraint was lifted.
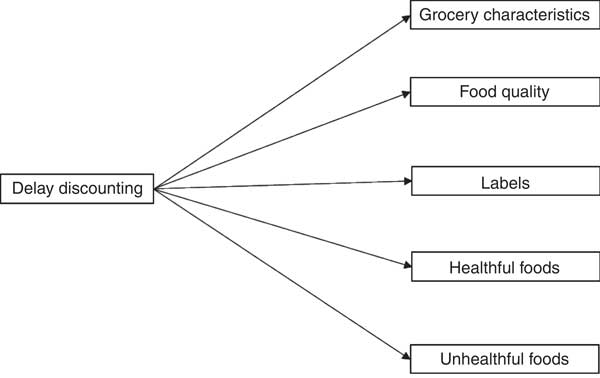
Fig. 1 Hypothesized model of foods in the home from a 2012 online survey of adults (n 477) in south-east Alabama, USA
Structural equation modelling was conducted using Mplus version 7 (Muthén & Muthén, 1998–2010)( Reference Muthén and Muthén 36 ). Missing data were handled using full information maximum likelihood estimation with robust se. Full information maximum likelihood estimation is one of the best methods for dealing with missing data( Reference Acock 37 ). Model fit was assessed by χ 2/df<5, comparative fit index (CFI)>0·90 and root-mean-square standard error of approximation (RMSEA)<0·10( Reference Wheaton, Muthén and Alwin 38 ). Age, income level and education were controlled for in both structural equation modelling and multigroup analyses.
Results
Sample
Four hundred and seventy-seven participants completed the survey, who were 42 years old on average. Most were female (n 329; 69 %) and married (n 332; 70 %), and approximately 85 % of the sample had received an associate’s degree or higher at the time of the study. (Table 1) Furthermore, about 55 % of the participants reported a household income of $US 70 000 or more annually.
Table 1 Demographics of the sample (n 477) in a 2012 online survey of adults in south-east Alabama, USA

† Totals may not sum to 477 owing to missing data.
Preliminary analyses
The correlations between the study’s main variables are depicted in Table 2. Of note, grocery characteristics (price, ease and shelf-life) were not significantly correlated with any of the other variables and food quality (nutrition and taste) was significantly correlated with all of them. Interestingly, the use of food labels as a guide was positively correlated with unhealthful foods in the home (r=0·26, P<0·001) as well as healthful foods in the home (r=0·29, P<0·001); those who reported using food labels as a guide while shopping reported frequently having snacks and soft drinks in their home. Another interesting finding is that AUC was correlated (and in a positive direction) only with labels and food quality; on average, those who had high AUC (or discounted the future to a lesser degree) used food labels as a guide while shopping and placed high importance on their food’s nutrition and taste. The opposite was true for those with low AUC (high rate of delay discounting). On average, healthful food options were readily available in the participants’ homes (mean=3·98, sd=0·70).
Table 2 Mean, sd and Pearson correlation between main variables in a 2012 online survey of adults (n 477) in south-east Alabama, USA

H_foods, healthful foods; U_foods, unhealthful foods; AUC, area under the delay discounting curve; SQ means the variable was squared.
**P<0·01, ***P<0·001.
† An average of frequency of healthful foods (fruits and vegetables) available in the home.
‡ An average of frequency of unhealthful foods (snacks and soft drinks) available in the home.
§ Frequency of food label use (nutrition facts panel and ingredients list) when shopping.
║ Importance of grocery characteristics (price, ease and shelf life) when shopping.
¶ Importance of food quality when shopping.
†† Delay discounting is inversely related to AUC.
Final model
The final model (Fig. 2) indicates that AUC was significantly positively related with considerations while shopping (β=0·43, P<0·01) and healthful foods in the home (β=0·12, P<0·01). On average, those who demonstrated low levels of delay discounting (high AUC) reported that they placed high importance on price, ease, shelf-life, nutrition and taste while shopping (controlling for all else in the model). Those who demonstrated low levels of delay discounting also reported frequently having fruits and vegetables in their homes, controlling for all else in the model. Delay discounting was not related to using food labels while shopping or the frequency of having snacks and sodas in the home.
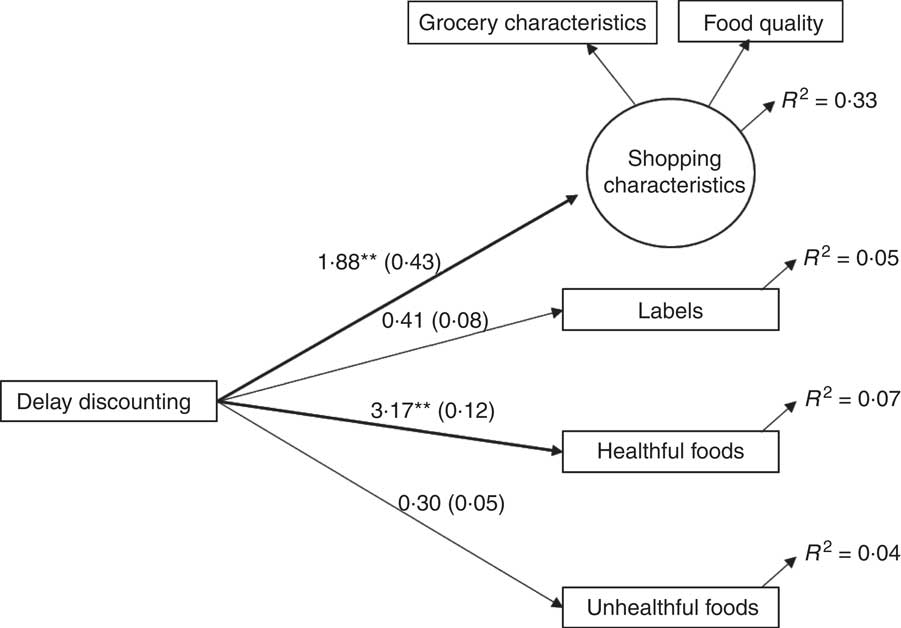
Fig. 2 Final model of foods in the home with control variables from a 2012 online survey of adults (n 477) in south-east Alabama, USA (note: delay discounting is inversely related to area under the curve). Results are presented as unstandardized coefficients with standardized coefficients in parentheses; **P<0·01. Model fit: χ 2/df=3·8, comparative fit index=0·91, root-mean-square standard error of approximation=0·08
Given all else in the model, AUC explained 33 % of the variance in considerations while shopping, 5 % of the variance in using labels, 7 % of the variance in availability of healthful foods and 4 % of the variance in availability of unhealthful foods. The model fit was acceptable (χ 2/df=3·8, CFI=0·91, RMSEA=0·08).
Multigroup analysis
Additional tests were conducted to determine whether the model was different across males and females. All paths were significantly different across each group (see Table 3 for results from χ 2 tests for difference). In other words, there was a significant difference in the relationship between delay discounting, food purchasing behaviours (label use and considerations while shopping) and availability of foods in the home for males and females. Figures 3 to 6 depict these differences. Specifically, AUC in males was significantly positively associated with considerations while shopping (β=0·41, P<0·01), but not significantly associated with healthful foods in the home or food label usage. In contrast, for females, AUC was significantly positively associated with healthful foods in the home (β=0·12, P<0·05) and food label usage (β=0·12, P<0·05), but not significantly associated with considerations while shopping.
Table 3 Differences between males and females (χ 2 test) in a 2012 online survey of adults (n 477) in south-east Alabama, USA

AUC, area under the delay discounting curve (note: delay discounting is inversely related to AUC).
Critical χ 2 value for 7 df=14·07; if Δχ 2>14·07 then there is a difference.
* The paths are significantly different across groups.
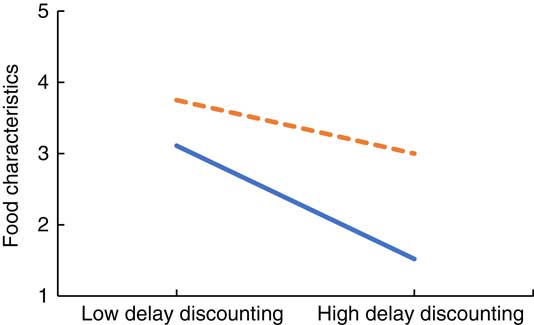
Fig. 3 (colour online) Importance of food characteristics by sex (
![]() , males;
, males;
![]() , females) in a 2012 online survey of adults (n 477) in south-east Alabama, USA (note: delay discounting is inversely related to area under the curve)
, females) in a 2012 online survey of adults (n 477) in south-east Alabama, USA (note: delay discounting is inversely related to area under the curve)
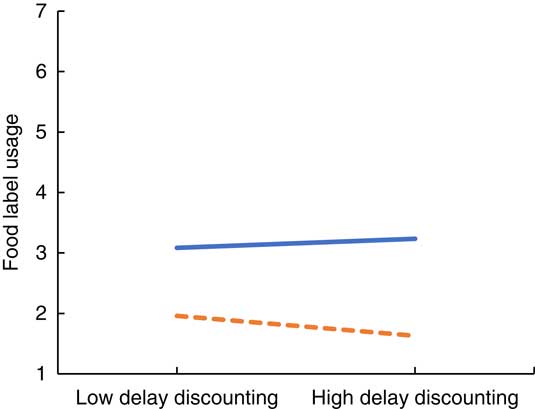
Fig. 4 Use of food labels while shopping by sex (
![]() , males;
, males;
![]() , females) in a 2012 online survey of adults (n 477) in south-east Alabama, USA (note: delay discounting is inversely related to area under the curve)
, females) in a 2012 online survey of adults (n 477) in south-east Alabama, USA (note: delay discounting is inversely related to area under the curve)
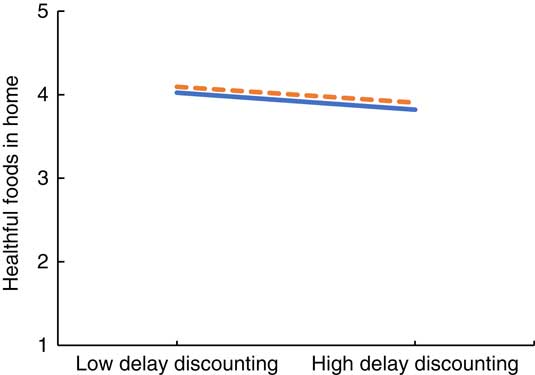
Fig. 5 Availability of healthful foods in the home by sex (
![]() , males;
, males;
![]() , females) in a 2012 online survey of adults (n 477) in south-east Alabama, USA (note: delay discounting is inversely related to area under the curve)
, females) in a 2012 online survey of adults (n 477) in south-east Alabama, USA (note: delay discounting is inversely related to area under the curve)
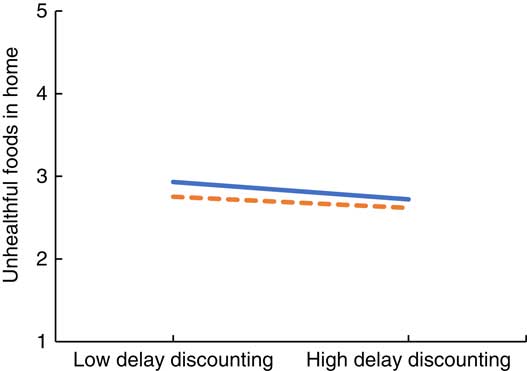
Fig. 6 Availability of unhealthful foods in the home by sex (
![]() , males;
, males;
![]() , females) in the 2012 online survey of adults (n 477) in south-east Alabama, USA (note: delay discounting is inversely related to area under the curve)
, females) in the 2012 online survey of adults (n 477) in south-east Alabama, USA (note: delay discounting is inversely related to area under the curve)
Discussion
In the final model, delay discounting was shown to be negatively associated with healthful foods in the home and emphasis on food quality and grocery characteristics when purchasing foods. In particular, participants with low delay discounting appeared to be more thoughtful in making food purchasing decisions and had healthful foods available in the home more frequently than participants with higher levels of delay discounting. However, use of food labels was not associated with level of delay discounting. Interestingly, use of food labels was correlated with having both healthful and unhealthful foods in the home. Lastly, these associations differed among male and female participants.
An interesting finding of the study was that low delay discounting was associated with healthful foods in the home and consideration of many factors while grocery shopping (more thoughtful food purchasing), but not label usage while making purchasing decisions. The fact that individuals who are less impulsive are more likely to consider factors such as price, ease of preparation, shelf-life, nutrition and taste makes sense and indicates more thoughtful consideration of future consumption. This is logical as individuals with low delay discounting are expected to give more thought before making decisions( Reference Ainslie 1 ). Consideration of grocery characteristics and food quality might result in more healthful foods in the home, a factor also associated with greater consideration of future consequences (in this case, future health). But one might think that a greater value placed on future v. immediate rewards might confer more frequent use of food labels when making purchasing decisions, which did not turn out to be the case among the study population. Further research using a longitudinal design is needed to investigate the causal links between delay discounting, food purchasing behaviours and foods in the home.
Previous research has shown conflicting results regarding the link between label use and more healthful diet( Reference Campos, Doxey and Hammond 6 – Reference Graham, Lucas-Thompson and Mueller 12 ). In our study, food label use was correlated with the availability of both healthful and unhealthful foods in the home. If participants were using the labels to inform every shopping decision on healthful dietary options, then the home food environment should consist of mostly healthful foods. This failure in completely influencing foods in the home by label use may not necessarily refute existing literature. Individuals who use labels may increase purchase of healthful foods while still buying unhealthful ones. Although variables such as insufficient time, taste and nutritional knowledge have been used to explain label use, some factors remain unaccounted for by extant literature( Reference Rasberry, Chaney and Housman 39 , Reference Lin, Lee and Yen 40 ). For instance, the degree of delay discounting may play a role in the consistency of food label use as well as influence the amount of healthful or unhealthful foods purchased by individuals. Future research should further investigate associations between degree of delay discounting, food label use and the extent of healthful food availability in the home. However, no such association was found in the current study between delay discounting and food label use.
In addition to these findings, differences in associations were demonstrated according to sex of the participants. Overall, females placed more importance on price, ease, shelf-life, nutrition and taste while shopping than did males. For both groups, high delay discounting was related to placing low importance on these food characteristics. Impulsive shoppers might just pick ‘what looks good’ or hurry through their shopping.
Overall, males used nutrition labels and ingredients lists more than did females. High delay discounting males used those guides more, while high delay discounting females used them less than their less impulsive counterparts. Literature suggests that users of nutrition labels have higher knowledge about nutrition and label use, while infrequent users have a nonchalant attitude, are constrained by time or possess a desire to purchase certain foods regardless of nutritional content( Reference Rasberry, Chaney and Housman 39 ). Perhaps the men in our study were more knowledgeable about nutrition and labels compared with women. Perhaps the women had a greater desire to purchase certain foods regardless of the nutritional content( Reference Rasberry, Chaney and Housman 39 ).
Overall, females reported having healthful foods in their home more frequently than did males (the difference is small, but significant). On the other hand, males reported more frequently having unhealthful foods in their home than did females. However, both groups at both levels of delay discounting reported having healthful foods in the home more frequently than unhealthful foods. Women may be more health-conscious (or more inclined to overestimate how healthy their food environment is). This seems tenable as health-conscious individuals are concerned with nutrition and tend to take responsibility towards healthful consumption( Reference Kraft and Goodell 41 ). For both groups, high delay discounting was related to having less healthful foods in the home. If impulsive people are buying what looks good, they may not be making the best decisions about food. This underscores the need to develop interventions targeting impulsive individuals that help them to overcome their tendency to focus on immediate gratification when making food choices. For both groups, high degree of delay discounting was related to having unhealthful foods in the home less frequently (more so for males). This is surprising, given the association between impulsivity and poor diet in previous studies( Reference Appelhans, Waring and Schneider 2 – Reference Huston and Finke 5 ). However, impulsive individuals may choose to eat out more frequently and therefore have less food in the home, whether it is healthful or unhealthful.
Limitations
The current study has several limitations. It utilizes a cross-sectional design, which helps in understanding the association between delay discounting, food purchasing behaviours and food availability in the home at a specific time point but not over time. Causal inferences should therefore be made with caution. In addition, although previous studies have demonstrated the influence of food label use and consideration of price, taste and ease of preparation on food purchasing decisions, it must be acknowledged that other factors, such as store layout, product placement and price promotions, are strong influencers of food purchasing and these factors were not assessed in the current study. Future studies should control for these factors by utilizing a specific supermarket setting and employing ecological momentary assessment to capture real-time decision making. Next, our study depends on self-report of participants. As a result, findings may have been influenced by recall or social desirability bias. Furthermore, our population consisted primarily of young, married women who held at least an associate’s degree and had a household income that is above average. Therefore, although we controlled for age, household income and education in our models, our findings may not generalize to a population with a contrasting demography. Future studies should utilize a more varied population or a census-based quota system to increase generalizability. In addition, only fruits and vegetables represented healthful foods in the present study. Future studies should include other healthful food items such as milk, whole grains and eggs in assessing healthful diets for a more representative result.
Conclusion
Individuals with low delay discounting (less focused on immediate gratification) appeared to be more thoughtful in making food purchasing decisions and, perhaps as a result, had healthful foods available in the home more frequently compared with individuals with higher delay discounting. Sex-based differences in these associations were also demonstrated, with females reporting greater consideration of food characteristics while shopping and greater frequency of healthful foods in the home while males reported more frequent use of food labels and greater frequency of unhealthful foods in the home. These findings can inform interventions designed to positively impact food purchasing decisions.
Acknowledgements
Financial support: This work was supported by an Internal Grants Program (IGP) award from Auburn University. The funder had no role in the design, analysis or writing of this article. Conflicts of interest: None. Authorship: K.B.G. was responsible for conceptual study design, survey instrument creation, recruitment, data collection and manuscript preparation. C.D.-B. and P.G. were responsible for data cleaning and analysis, as well as manuscript preparation. R.J. was responsible for manuscript preparation. Ethics of human subject participation: This study was conducted according to the guidelines laid down in the Declaration of Helsinki and all procedures involving human subjects were approved by the Auburn University Institutional Review Board. Written informed consent was obtained from all subjects.


