


Diabetes mellitus (DM) is a group of metabolic disorders characterised by high levels of glucose in the blood (hyperglycaemia), arising from deficient secretion and/or inefficient action of the hormone insulin, which leads to changes in the metabolism of carbohydrates, lipids and proteins. Apart from hyperglycaemia, these changes typically result in: loss of weight, despite the increased hunger inducing a higher rate of eating, increased water intake and urinary volume, glycosuria, proteinuria and a raised level of urinary urea(Reference Sacks, Burtis, Ashwood and Bruns1).
A recent study on the prevalence of DM among adults (aged 20–79 years) in ninety-one countries showed that it would affect 285 million adults (6·4 %) in 2010 and this would increase to 439 million (7·7 %) by 2030. This study also showed that, between 2010 and 2030, the numbers of adults in developing countries with DM will rise by 69 %, while in developed countries the increase will be 20 %(Reference Shaw, Sicree and Zimment2).
Current developments in pharmaceutical technology are directed not only at the discovery of new drugs, but also at new ways of administering them. Around the world, there is a trend towards the use of functional foods, namely items of food that afford physiological or metabolic health benefits, besides their ordinary nutritional value(Reference Siró, Kálpona and Kálpona3). Yoghurt is a popular, tasty and healthy milk product, produced and consumed in ever-growing amounts on account of its organoleptic qualities and high nutritional value when used as a food supplement(Reference He, Yang and Han4). Moreover, yoghurt supplemented with natural pigments has been used experimentally in vitro in the study of diabetes and hypertension management(Reference Apostolidis, Knon and Shetty5).
Curcumin, a natural yellow pigment isolated from the edible rhizome of the tropical South Asian herbaceous plant turmeric (Curcuma longa L.), of the ginger family, is known to possess antioxidant, anti-inflammatory, anticancer and antibacterial properties. Thus, it has been employed in the treatment of some disorders, such as Alzheimer's disease, gastric ulcer, psoriasis and diabetes(Reference Epstein, Sanderson and MacDonald6).
Published experiments in which an ethanolic solution or aqueous suspension of curcumin was administered to diabetic animals have demonstrated a lowering of the glycaemia(Reference Nisshiyama, Mae and Kishida7, Reference Hussein and Abu-Zinadah8). Reduction of the serum activity of aspartate aminotransferase (AST) and alanine aminotransferase (ALT) and of serum levels of cholesterol and TAG(Reference Hussein and Abu-Zinadah8–Reference Asai and Miyazawa10) and a gain in body weight (BW)(Reference Seo, Choi and Jung11) have also been observed after treatment of diabetic rats and mice with curcumin. Furthermore, it was found that treatment with curcumin or turmeric powder delays cataract in diabetic rats by preventing hyperglycaemia-induced lenticular oxidative stress, aggregation and insolubilisation of lens proteins(Reference Suryanarayana, Saraswat and Mrudula12). Chronic treatment with a suspension of curcumin in carboxymethylcellulose significantly attenuated renal dysfunction in diabetic rats, indicated by the levels of polyuria, proteinuria, serum creatinine, blood urea nitrogen and creatinine and urea clearance(Reference Sharma, Kulkarni and Chopra13). Corroborating these data, it has been shown that renal lesions can be reduced in streptozotocin (STZ)-diabetic rats by means of a diet supplemented with curcumin. The improvement was demonstrated by the amount of protein excreted in the urine and the extent of leaching of tubular enzyme, the measured activities of several key enzymes in the renal tissue and histological examination of kidney sections(Reference Babu and Srinivasan14).
This pigment is used in many food products and dishes, especially those spiced with turmeric, such as curry and yellow rice(Reference Dutta, Padhye and Priyadarsini15, Reference Goel, Kunnumakkara and Aggarwal16). No study has yet reported any toxic effects associated with ingestion of curcumin, in animals(Reference Shankar, Shantha and Ramesh17) or in humans, even at very high doses(Reference Lao, Ruffin and Normolle18). In spite of the considerable benefits offered by curcumin, the development of efficacious clinical forms of this pigment remains a great challenge, owing to its very low bioavailability when taken orally(Reference Anand, Kunnumakkara and Newman19).
A number of vehicles are being investigated, including nanoparticles(Reference Shaik, Ankola and Beniwal20), liposomes(Reference Chen, Johnston and Jeon21) and complexes with phospholipids(Reference Maiti, Mukherjee and Gantait22), as well as the addition of adjuvants such as piperine(Reference Shoba, Joy and Joseph23), but it is well worth trying other formulations in which curcumin may show improvements in bioavailability. Few studies have been published on the supplementation of yoghurt with natural pigments, and to the best of our knowledge none has been carried out in which in vivo assays were used to treat diabetes with curcumin. We therefore prepared mixtures of natural milk yoghurt with various concentrations of curcumin and assessed their effects on the classical symptoms of experimental diabetes.
Materials and methods
Animals
A total of forty-eight male Wistar rats of BW 120 (sem 5) g (diabetic groups) and twenty-four rats of BW 180 (sem 5) g (non-diabetic (ND) groups), were obtained from the central animal facility of the Unesp campus at Botucatu, SP, Brazil. Each animal was housed in a separate metabolic cage, under a 12 h light–12 h dark cycle, at a constant temperature of 23 ± 1°C and relative humidity of 55 ± 5 %, and had free access to water and commercial rat feed (Purina® – Evialis do Brasil Nutrição Animal Ltda., Paulínia, SP, Brazil), throughout the 31-d experiment. The study was conducted in compliance with all relevant recommendations of Colégio Brasileiro de Experimentação Animal on the care and use of animals, and all experimental procedures involving animals received prior approval by the School Research Ethics Committee (Faculdade de Ciências Farmacêuticas/Unesp at Araraquara: resolution 11/2008).
Induction of diabetes
After a period of adaptation, the rats were fasted for 14–16 h. Following this, the forty-eight animals referred to earlier were given an injection (intravenous) of 40 mg per kg BW of STZ (catalogue no. S0130; Sigma Aldrich, St Louis, MO, USA) dissolved in 10 mm-citrate buffer (pH 4·5) to induce diabetes, while the remaining twenty-four animals received a similar injection of the buffer. And 4 d later, the blood glucose level of STZ-treated rats had risen to 27–28 mmol/l, while that of the twenty-four ND rats remained around 7·8 mmol/l.
Prolonged treatment with curcumin
Curcumin (catalogue no. 28260; Sigma Aldrich-Fluka, St Louis, MO, USA) was mixed with plain yoghurt (Nestlé, Araras, SP, Brazil), in appropriate proportions, with a homogeniser (Metabo, Marconi, Piracicaba, SP, Brazil) operating at 27 000 rpm for 90 s, at a controlled ambient temperature of 25°C. The treatment started 4 d after the STZ injection, the rats having been placed in nine treatment groups of eight animals/group that were balanced in glycaemia and BW. The groups were treated as follows: diabetic rats were given water (group DW), plain yoghurt (DY), curcumin in yoghurt at 30 mg (DC30), 60 mg (DC60) or 90 mg/kg BW per d (DC90) or insulin (DI); ND rats were: treated with water (NDW), given yoghurt (NDY) or curcumin in yoghurt at 90 mg/kg BW per d (NDC90).
All rats were treated twice a day by gavage (except group DI), at 08.00 and 18.00 hours, for 31 d. Rats in the experimental control groups (DW, NDW, DY and NDY) were given 1·0 ml/d of water or yoghurt, while group DI received subcutaneous injections of 13·89 μmol/rat of insulin (Biohulin NU-100; 100 units/ml; Biobrás, Monte Claro, MG, Brazil) in 0·3 ml physiological saline, totalling 27·78 μmol/rat per d in 0·6 ml. The curcumin-treated groups received 15 (DC30), 30 (DC60) or 45 (DC90 and NDC90) mg/kg BW of the pigment in 0·5 ml yoghurt, totalling 1·0 ml/rat/d of curcumin-supplemented yoghurt.
At the end of the treatment, the rats were killed by decapitation, blood was collected for analysis and the extensor digitorum longus and soleus muscles and the retroperitoneal and epididymal fat pads were immediately removed from each animal and weighed, as was a piece of the liver, to assay its glycogen content in g/100 g liver tissue (g %).
Chemical analysis
Blood glucose was determined by using glucose oxidase and peroxide-mediated oxidative coupling of p-aminophenazone to phenol, catalysed by peroxidase(Reference Trinder24). Serum levels of ALT and AST activities were assayed with continuous-monitoring methods(25) by coupling transaminase reactions to specific dehydrogenase reactions, in which the oxo-acids formed in the transaminase reactions, are measured in an enzymatic reduction to the corresponding hydroxy acids, with the oxidation of NADH. The serum level of the alkaline phosphatase (ALP) activity was determined with the ‘self-indicating’ substrate, p-nitrophenylphosphate, and a phosphate-accepting buffer, in a continuous-monitoring method(Reference Tietz, Rinker and Shaw26). Serum concentration of total cholesterol was determined by coupling the enzymatic reactions of cholesteryl ester hydrolase and cholesterol oxidase, where H2O2 is one of the products of the oxidase reaction and is measured in a peroxidase-catalysed reaction that forms a quinoneimine dye(Reference Rifai, Warnick, Burtis, Ashwood and Bruns27). The homogeneous assay used for HDL-cholesterol was based on the accelerator selective detergent method, where a synthetic polymer is used together with a polyanion to block the non-HDL; a detergent is then added that exposes only the cholesterol in HDL to the enzymes: cholesteryl ester hydrolase, cholesterol oxidase and peroxidase(Reference Rifai, Warnick, Burtis, Ashwood and Bruns27, Reference Sugiuchi and Okabe28). TAG was determined by sequential enzymatic reactions of a lipase, glycerokinase and glycerolphosphate oxidase; in the oxidase reaction, the H2O2 generated is measured by a coupled oxidative reaction of 4-aminoantipyrine and 4-chlorophenol, catalysed by peroxidase, yielding a quinoneimine dye(Reference Rifai, Warnick, Burtis, Ashwood and Bruns27). All the aforementioned assays were spectrophotometric and carried out in a LabMax-240 autoanalyser (Labtest-Chuo-Ku, Tokyo, Japan). Urinary protein was determined by the Bradford method(Reference Bradford29), which is based on the binding of the Coomassie dye to proteins, with the formation of a coloured complex monitored at 570–600 nm. The urea was assayed by the urease method, in which urinary urea is hydrolysed by urease to NH3, which in turn is assayed by measuring NADH at 340 nm, consumed in the presence of glutamate dehydrogenase(Reference Bergmeyer, Bergmeyer, Bergmeyer and Grassl30). The o-toluidine method(Reference Dubowski31) was used for glycosuria; this aromatic amine condenses with the aldehyde group of glucose to produce a green chromophore, monitored at 630 nm. The anthrone method(Reference Vies32) was used for hepatic glycogen, in which the hepatic glycogen is extracted with 30 % KOH and then precipitated with alcohol and the quantity of pellet recovered is determined (in triplicate) by the reaction with anthrone (9,10-dihydro-9-oxoanthracene), where a coloured product is formed with reducing sugars and can be monitored at 620 nm.
Except when indicated, the absorbance was read in a Femto Plus 600 spectrophotometer (Femto Indústria e Comércio de Instrumentos Ltda., São Paulo, SP, Brazil) and all kits were obtained from Labtest Diagnóstica S.A. (Lagoa Santa, MG, Brazil). Other reagents were purchased from Merck (Darmsradt, Germany) or Sigma and were of at least analytical grade.
Statistical analysis
The results are expressed as means with their standard errors. Differences were assessed by ANOVA – one-way for the analyses: cholesterol, HDL-cholesterol, TAG, hepatic glycogen, food intake, water intake, urine volume, extensor digitorum longus muscle, soleus muscle, retroperitoneal fat and epididymal fat; or two-way for repeated measures, with groups and time as the factors, for the analyses: BW, glucose, glycosuria, proteinuria, urinary urea, AST, ALT and ALP; followed by the Student–Newman–Keuls test, using the program Sigma Stat 3.5 (Systat Software, Inc., San Jose, CA, USA). Significance was accepted when P < 0·05.
Results
In the present study, we investigated the effect of feeding curcumin, suspended in plain yoghurt at various concentrations, to diabetic and ND rats. Over a period of 31 d, the supplemented yoghurt was given to the rats by gavage each morning and evening, while the main physiological and biochemical variables that often change in diabetic animals were analysed. To maximise the reliability of the experiment, the animals were matched, 4 d after induction of DM with STZ, with respect to BW and glycaemia, so that the three groups of ND rats started with the same mean values of glycaemia and weight, and the six groups of diabetic rats with the same mean weight and severity of diabetes (Table 1).
Table 1 Biochemical and physiological variables of the diabetic and non-diabetic rats during treatment with curcumin
(Mean values with their standard errors (n 8))
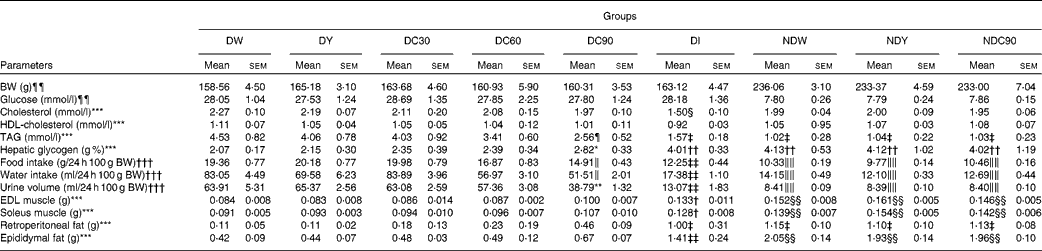
DW, diabetic rats treated with water; DY, diabetic rats treated with yoghurt; DC30, diabetic rats treated with curcumin (30 mg/kg body weight (BW)); DC60, diabetic rats treated with curcumin (60 mg/kg BW); DC90, diabetic rats treated with curcumin (90 mg/kg BW); DI, diabetic rats treated with insulin (27·78 μmol); NDW, non-diabetic rats treated with water; NDY, non-diabetic rats treated with yoghurt; NDC90, non-diabetic rats treated with curcumin (90 mg/kg BW); EDL, extensor digitorum longus.
Intergroup comparisons (P < 0·05): * DC90 v. DW, DY; † DI v. DW, DY, DC30, DC60; ‡ DI, NDW, NDY, NDC90 v. DW, DY, DC30, DC60; § DI v. DW, DY, DC30, DC60, DC90, NDW, NDY, NDC90; ∥ DC90 v. DW, DY, DC30; ¶ DC90 v. DW, DY; ** DC90 v. DW, DY, DC30, DC60; †† DI, NDW, NDY, NDC90 v. DW, DY, DC30, DC60, DC90; ‡‡ DI v. DW, DY, DC30, DC60, DC90; §§ NDW, NDY, NDC90 v. DW, DY, DC30, DC60, DC90; ∥∥ NDW, NDY, NDC90 v. DW, DY, DC30, DC60, DC90, DI (one-way ANOVA and Student–Newman–Keuls test were used for comparisons).
¶¶ Measured 4 d after streptozotocin to show six diabetic and three non-diabetic groups were balanced in glycaemia and BW.
*** Measured on day 31 of treatment (killing)
††† Results pooled from day 7 to day 31 of treatment.
It can be seen in Fig. 1 that group DI consistently gained more weight than any other diabetic group, followed by DC90. There were significant differences between DI and DW, DY and DC30, from day 21 (P < 0·05), as well as between DC90 and DW, DY and DC30 (P < 0·05). Overall, DI showed a weight gain of 137·25 g and DC90 a gain of 108·37 g, whereas groups DW and DY grew little, gaining only 42·66 g and 38·75 g, respectively. Comparison of mean weights of the same groups at different times shows that groups DI, DC30, DC60 and DC90 increased significantly from their initial values from day 7 of the treatment, while groups DW and DY changed significantly from their initial values only from day 14 of the treatment.
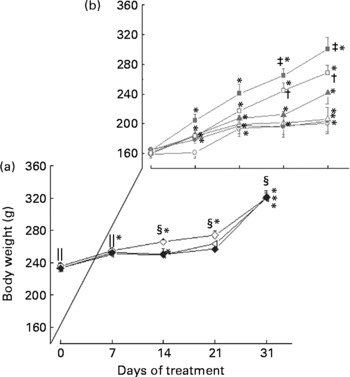
Fig. 1 Effect of prolonged treatment of diabetic rats with curcumin on body weight (BW, g). Values are group means with their standard errors (n 8). (a) Non-diabetic rats treated with water (NDW, ![]() ); non-diabetic rats treated with yoghurt (NDY,
); non-diabetic rats treated with yoghurt (NDY, ![]() ); non-diabetic rats treated with curcumin (90 mg/kg BW) (NDC90,
); non-diabetic rats treated with curcumin (90 mg/kg BW) (NDC90, ![]() ). (b) Diabetic rats treated with water (DW,
). (b) Diabetic rats treated with water (DW, ![]() ); diabetic rats treated with yoghurt (DY,
); diabetic rats treated with yoghurt (DY, ![]() ); diabetic rats treated with curcumin (30 mg/kg BW) (DC30,
); diabetic rats treated with curcumin (30 mg/kg BW) (DC30, ![]() ); diabetic rats treated with curcumin (60 mg/kg BW) (DC60,
); diabetic rats treated with curcumin (60 mg/kg BW) (DC60, ![]() ); diabetic rats treated with curcumin (90 mg/kg BW) (DC90,
); diabetic rats treated with curcumin (90 mg/kg BW) (DC90, ![]() ); diabetic rats treated with insulin (27·78 μmol) (DI,
); diabetic rats treated with insulin (27·78 μmol) (DI, ![]() ). Repeated-measures ANOVA and Student–Newman–Keuls test were used for comparisons. Intergroup comparisons (P < 0·05): † DC90 v. DW, DY, DC30; ‡ DI v. DW, DY, DC30; § NDW, NDY, NDC90 v. DW, DY, DC30, DC60; ∥ NDW, NDY, NDC90 v. DW, DY, DC30, DC60, DC90, DI. Intragroup comparisons: * P < 0·05; with day 0.
). Repeated-measures ANOVA and Student–Newman–Keuls test were used for comparisons. Intergroup comparisons (P < 0·05): † DC90 v. DW, DY, DC30; ‡ DI v. DW, DY, DC30; § NDW, NDY, NDC90 v. DW, DY, DC30, DC60; ∥ NDW, NDY, NDC90 v. DW, DY, DC30, DC60, DC90, DI. Intragroup comparisons: * P < 0·05; with day 0.
The blood glucose levels (Fig. 2) in group DI fell to around 10·0 mmol/l, where they remained steady until the end of the experiment. The levels of glucose were also reduced in DC90, to 18·43 (sem 1·40) mmol/l, and in DC60, to 23·01 (sem 2·22) mmol/l. The control groups, DW and DY, showed rising glucose levels throughout the experiment, reaching 34·46 and 31·46 mmol/l, respectively. None of the three groups of ND animals (NDW, NDY and NDC90) suffered any significant change in glucose levels relative to each other or to their initial levels.

Fig. 2 Effect of prolonged treatment of diabetic rats with curcumin on glycaemia (mmol/l). Values are group means with their standard errors (n 8). (a) Non-diabetic rats treated with water (NDW, ![]() ); non-diabetic rats treated with yoghurt (NDY,
); non-diabetic rats treated with yoghurt (NDY, ![]() ); non-diabetic rats treated with curcumin (90 mg/kg body weight (BW)) (NDC90,
); non-diabetic rats treated with curcumin (90 mg/kg body weight (BW)) (NDC90, ![]() ). (b) Diabetic rats treated with water (DW,
). (b) Diabetic rats treated with water (DW, ![]() ); diabetic rats treated with yoghurt (DY,
); diabetic rats treated with yoghurt (DY, ![]() ); diabetic rats treated with curcumin (30 mg/kg BW) (DC30,
); diabetic rats treated with curcumin (30 mg/kg BW) (DC30, ![]() ); diabetic rats treated with curcumin (60 mg/kg BW) (DC60,
); diabetic rats treated with curcumin (60 mg/kg BW) (DC60, ![]() ); diabetic rats treated with curcumin (90 mg/kg BW) (DC90,
); diabetic rats treated with curcumin (90 mg/kg BW) (DC90, ![]() ); diabetic rats treated with insulin (27·78 μmol) (DI,
); diabetic rats treated with insulin (27·78 μmol) (DI, ![]() ). Repeated-measures ANOVA and Student–Newman–Keuls test were used for comparisons. Intergroup comparisons (P < 0·05): † DC60 v. DW, DY; ‡ DC90 v. DW, DY; § DC90 v. DC30; ∥ DI v. DW, DY, DC30, DC60, DC90; ¶ NDW, NDY, NDC90 v. DW, DY, DC30, DC60, DC90, DI. Intragroup comparisons: * P < 0·05; with day 0.
). Repeated-measures ANOVA and Student–Newman–Keuls test were used for comparisons. Intergroup comparisons (P < 0·05): † DC60 v. DW, DY; ‡ DC90 v. DW, DY; § DC90 v. DC30; ∥ DI v. DW, DY, DC30, DC60, DC90; ¶ NDW, NDY, NDC90 v. DW, DY, DC30, DC60, DC90, DI. Intragroup comparisons: * P < 0·05; with day 0.
The concentration of urinary glucose (Fig. 3) shows a significant fall in group DI on day 7, in contrast to all other diabetic groups, and remains at this level until the end. In group DC90, the level rose more slowly than in DW and DY, and became significantly lower than these controls from day 14 of the treatment. Comparing the levels at different times for the same group (intragroup comparison), we find that groups DW, DY and DC30 showed a significant rise from day 7 of the treatment. However, DC90 and DI did not show any significant change from day 0.

Fig. 3 Effect of prolonged treatment of diabetic rats with curcumin on glucosuria (mmol/l per 24 h 100 g body weight (BW)). Values are group means with their standard errors (n 8). Diabetic rats treated with water (DW, ![]() ); diabetic rats treated with yoghurt (DY,
); diabetic rats treated with yoghurt (DY, ![]() ); diabetic rats treated with curcumin (30 mg/kg BW) (DC30,
); diabetic rats treated with curcumin (30 mg/kg BW) (DC30, ![]() ); diabetic rats treated with curcumin (60 mg/kg BW) (DC60,
); diabetic rats treated with curcumin (60 mg/kg BW) (DC60, ![]() ); diabetic rats treated with curcumin (90 mg/kg BW) (DC90,
); diabetic rats treated with curcumin (90 mg/kg BW) (DC90, ![]() ); diabetic rats treated with insulin (27·78 μmol) (DI,
); diabetic rats treated with insulin (27·78 μmol) (DI, ![]() ). Repeated-measures ANOVA and Student–Newman–Keuls test were used for comparisons. Intergroup comparisons (P < 0·05): † DC90 v. DW, DY; ‡ DI v. DW, DY, DC30, DC60, DC90. Intragroup comparisons: * P < 0·05; with day 0.
). Repeated-measures ANOVA and Student–Newman–Keuls test were used for comparisons. Intergroup comparisons (P < 0·05): † DC90 v. DW, DY; ‡ DI v. DW, DY, DC30, DC60, DC90. Intragroup comparisons: * P < 0·05; with day 0.
The results obtained for proteinuria (Fig. 4) show that, on day 0, the apparent differences among the diabetic groups are not significant, nor are they among the ND groups. On day 7, however, the level of group DI was significantly lower than those of DW, DY, DC30, DC60 and DC90, and remained so until the end of the experiment. On day 14, group DI attained a value of proteinuria similar to that of the ND groups, where it remained until day 31. In relation to group DC90 on day 7, its proteinuria was significantly lower than that of DW and DY and remained so until the end of the experiment. On the last day, group DI showed a proteinuria about 82·4 % lower than the diabetic control groups, DW and DY, while group DC90 showed a fall of about 48·0 % relative to the controls. Moreover, DW and DI were the only groups that exhibited any levels significantly different from those on day 0. The profiles of the three groups of ND animals were similar to each other and their proteinuria was lower than those of all the diabetic groups except DI.

Fig. 4 Effect of prolonged treatment of diabetic rats with curcumin on proteinuria (g/24 h 100 g body weight (BW)). Values are group means with their standard errors (n 8). (a) Non-diabetic rats treated with water (NDW, ![]() ); non-diabetic rats treated with yoghurt (NDY,
); non-diabetic rats treated with yoghurt (NDY, ![]() ); non-diabetic rats treated with curcumin (90 mg/kg body weight (BW)) (NDC90,
); non-diabetic rats treated with curcumin (90 mg/kg body weight (BW)) (NDC90, ![]() ). (b) Diabetic rats treated with water (DW,
). (b) Diabetic rats treated with water (DW, ![]() ); diabetic rats treated with yoghurt (DY,
); diabetic rats treated with yoghurt (DY, ![]() ); diabetic rats treated with curcumin (30 mg/kg BW) (DC30,
); diabetic rats treated with curcumin (30 mg/kg BW) (DC30, ![]() ); diabetic rats treated with curcumin (60 mg/kg BW) (DC60,
); diabetic rats treated with curcumin (60 mg/kg BW) (DC60, ![]() ); diabetic rats treated with curcumin (90 mg/kg BW) (DC90,
); diabetic rats treated with curcumin (90 mg/kg BW) (DC90, ![]() ); diabetic rats treated with insulin (27·78 μmol) (DI,
); diabetic rats treated with insulin (27·78 μmol) (DI, ![]() ). Repeated-measures ANOVA and Student–Newman–Keuls test were used for comparisons. Intergroup comparisons (P < 0·05): † DC90 v. DW, DY; ‡ DI v. DW, DY, DC30, DC60, DC90; § NDW, NDY, NDC90 v. DW, DY, DC30, DC60, DC90; ∥ NDW, NDY, NDC90, DI v. DW, DY, DC30, DC60, DC90; ¶ NDW, NDY, NDC90 v. DW, DY, DC30, DC60, DC90, DI. Intragroup comparisons: * P < 0·05; with day 0.
). Repeated-measures ANOVA and Student–Newman–Keuls test were used for comparisons. Intergroup comparisons (P < 0·05): † DC90 v. DW, DY; ‡ DI v. DW, DY, DC30, DC60, DC90; § NDW, NDY, NDC90 v. DW, DY, DC30, DC60, DC90; ∥ NDW, NDY, NDC90, DI v. DW, DY, DC30, DC60, DC90; ¶ NDW, NDY, NDC90 v. DW, DY, DC30, DC60, DC90, DI. Intragroup comparisons: * P < 0·05; with day 0.
For urinary urea (Fig. 5), the insulin-treated rats showed a significant fall on day 7, in contrast to all other groups, and remained at this level until the end. Moreover, significant differences were observed between group DI and groups DW, DY, DC30, DC60 and DC90 from day 7, and also between DC90 and group DW, which were maintained until the last day. DC90 fell significantly relative to DY from day 14 to the end of treatment. In the intragroup comparison, it was found that DW, DY, DC30 and DC60 showed significantly changed levels from day 7, which remained so until the end. The urinary urea levels in all the ND groups, on day 0 and day 7, were significantly lower than in all the diabetic groups. This was also true during the rest of the treatment, except in the case of group DI, which had a level similar to the ND groups.

Fig. 5 Effect of prolonged treatment of diabetic rats with curcumin on urinary urea (mmol/l per 24 h 100 g body weight (BW)). Values are group means with their standard errors (n 8). (a) Non-diabetic rats treated with water (NDW, ![]() ); non-diabetic rats treated with yoghurt (NDY,
); non-diabetic rats treated with yoghurt (NDY, ![]() ); non-diabetic rats treated with curcumin (90 mg/kg body weight (BW)) (NDC90,
); non-diabetic rats treated with curcumin (90 mg/kg body weight (BW)) (NDC90, ![]() ). (b) Diabetic rats treated with water (DW,
). (b) Diabetic rats treated with water (DW, ![]() ); diabetic rats treated with yoghurt (DY,
); diabetic rats treated with yoghurt (DY, ![]() ); diabetic rats treated with curcumin (30 mg/kg BW) (DC30,
); diabetic rats treated with curcumin (30 mg/kg BW) (DC30, ![]() ); diabetic rats treated with curcumin (60 mg/kg BW) (DC60,
); diabetic rats treated with curcumin (60 mg/kg BW) (DC60, ![]() ); diabetic rats treated with curcumin (90 mg/kg BW) (DC90,
); diabetic rats treated with curcumin (90 mg/kg BW) (DC90, ![]() ); diabetic rats treated with insulin (27·78 μmol) (DI,
); diabetic rats treated with insulin (27·78 μmol) (DI, ![]() ). Repeated-measures ANOVA and Student–Newman–Keuls test were used for comparisons. Intergroup comparisons (P < 0·05): † DC90 v. DY; ‡ DC90 v. DW; § NDW, NDY, NDC90 v. DW, DY, DC30, DC60, DC90, DI; ∥ DI v. DW, DY, DC30, DC60, DC90; ¶ NDW, NDY, NDC90, DI v. DW, DY, DC30, DC60, DC90. Intragroup comparisons: * P < 0·05; with day 0.
). Repeated-measures ANOVA and Student–Newman–Keuls test were used for comparisons. Intergroup comparisons (P < 0·05): † DC90 v. DY; ‡ DC90 v. DW; § NDW, NDY, NDC90 v. DW, DY, DC30, DC60, DC90, DI; ∥ DI v. DW, DY, DC30, DC60, DC90; ¶ NDW, NDY, NDC90, DI v. DW, DY, DC30, DC60, DC90. Intragroup comparisons: * P < 0·05; with day 0.
With respect to daily food intake, water intake and urine volume and the weights of the extensor digitorum longus and soleus muscles and retroperitoneal and epididymal fat pads, for all the diabetic groups, during treatment and/or on day 31 (Table 1), we can see that group DI was significantly different from groups DW, DY and DC30 in all seven of these variables. DC90 showed a significant difference from the groups DW and DY, for all the variables except the weights of muscles and fat pads. Groups DC60 and DC30 suffered no significant change in any variable. It should also be noted that the curcumin-treated groups showed dose-dependent increases in the masses of both fat pads, relative to those of DW and DY, though significance was not proved.
It is seen that the mean TAG level of group DC60 was reduced by 1·12 mmol/l and that of DC90 by 1·97 mmol/l, relative to group DW (Table 1). DI showed a greater reduction in TAG (2·96 mmol/l), but remained at a level about 0·54 mmol/l higher than those of the ND rats. In terms of total cholesterol, group DI was significantly different from DW, DY, DC30, DC60 and DC90, while the HDL-cholesterol level was not significantly different between any of the groups (Table 1). The hepatic glycogen content was very similar in all the ND rats and group DI, and these levels were significantly higher than those in all the non-DI (P < 0·05).
However, one of the non-DI, DC90, had significantly more hepatic glycogen (P < 0·05) than DW and DY.
In relation to enzymes, we observe that all the diabetic groups showed a great rise in AST activity during the 31 d, although this rise is significantly less in groups DI and DC90 than in DW and DY (Table 2). For ALT, there was a significant rise in activity (P < 0·05) in all groups during the experiment, except in the case of DI, where the rise was much smaller. Both AST and ALT activities are reduced in a dose-dependent manner in the curcumin-treated groups, relative to DW and DY, and this reduction is significant in DC60 and DC90, for ALT. In the intragroup analysis for the transaminases, we find a significant increase in ALT in all the diabetic groups except DI.
Table 2 Enzyme activities in serum of all experimental groups before and after 31 d of treatment
(Mean values with their standard errors (n 8))

ALT, alanine aminotransferase; AST, aspartate aminotransferase; ALP, alkaline phosphatase; DW, diabetic rats treated with water; DY, diabetic rats treated with yoghurt; DC30, diabetic rats treated with curcumin (30 mg/kg body weight (BW)); DC60, diabetic rats treated with curcumin (60 mg/kg BW); DC90, diabetic rats treated with curcumin (90 mg/kg BW); DI, diabetic rats treated with insulin (27·78 μmol); NDW, non-diabetic rats treated with water; NDY, non-diabetic rats treated with yoghurt; NDC90, non-diabetic rats treated with curcumin (90 mg/kg BW).
Intergroup comparisons (P < 0·05): † DC90 v. DW, DY; ‡ DI v. DW, DY, DC30, DC60; § DI v. DW, DY, DC30, DC60, DC90; ∥ NDW, NDY, NDC90 v. DW, DY, DC30, DC60, DC90, DI; ¶ NDW, NDY, NDC90, DI v. DW, DY, DC30, DC60, DC90; ** DC60 vs. DW, DY. Intragroup comparisons: *P < 0·05; with day 0 (repeated-measures ANOVA and Student–Newman–Keuls test were used for comparisons).
In the case of serum ALP, no significant difference was revealed between the levels before and after treatment, in any group. However, in group DC90, the activity was significantly lower than in groups DW and DY, at the end of treatment, while DI showed a significantly lower activity than all other diabetic groups at that time.
It is to be also noted that comparisons between the ND controls and group NDC90 failed to reveal any statistical difference, in any of the results for the serum enzyme activities. While the activities of AST and ALT in the ND groups were significantly lower than in the diabetic groups on day 31, the same pattern was observed for ALP activity, except in group DI.
Discussion
The results reported in the previous section suggest that the STZ injected was strongly cytotoxic to the pancreatic β-cells, since it provoked all the classical alterations in physiological and biochemical markers expected in experimental diabetes, namely, hyperglycaemia, polydipsia, weight loss, polyphagia, polyuria, glycosuria, proteinuria and raised urinary urea levels(Reference Al-Awwadi, Azay and Poucheret33). Such results have already been described by our laboratory, including the histological changes in various tissues(Reference Mori, Baviera and Ramalho34).
Weight loss or poor growth in diabetic animals arises from the breakdown of structural proteins and body fat(Reference Sarkhail, Rahmaipour and Fadyevatan35) due to the lack of insulin. Insulin inhibits the hormone-sensitive lipase, preventing the occurrence of excessive lipolysis, and also promotes glucose uptake by adipose tissue, favouring lipogenesis(Reference Sekiya, Yahagi and Tamura36). These factors result in a gain in BW when the animal is treated with an efficient hypoglycaemic agent, which occurred in the groups DI and DC90 (Fig. 1). It is also worth noting that the treated diabetic groups DI, DC60 and DC90 started to gain weight a week earlier than the control groups DW and DY.
In diabetic rats treated with curcumin (30, 60, 90 mg/kg BW per d), we observed a fall in blood glucose (Fig. 2), as also food and water consumption, and a rise in BW (Table 1). This fall in glycaemia may in part be explained by the stimulation of insulin secretion by curcumin, since an increase of this hormone in the plasma has been reported in animals treated with 0·2 g/kg BW of curcumin(Reference Seo, Choi and Jung11). Thus, it can be suggested that the β-cells are partially destroyed by STZ and that the surviving endocrine cells would continue to secrete small amounts of insulin(Reference Seo, Choi and Jung11). This hypothesis could also be applied to the present results. Nevertheless, a study by Suryanarayana et al. (Reference Suryanarayana, Saraswat and Mrudula12), who demonstrated a delay in STZ-induced cataract in rats, also reported that curcumin or powdered turmeric rhizomes mixed into the feed (0·5 %) did not alter glycaemia, insulinaemia or weight loss in diabetic animals. In fact, it would be interesting to compare the doses in the present study with those used by Suryanarayana et al. (Reference Suryanarayana, Saraswat and Mrudula12), but this is not possible, owing to the absence of data on food intake in the cited article. In addition, the difference between the vehicles used in the two studies should be taken into account, as it can influence the bioavailability of the curcumin.
Another hypothesis to explain the reduction in plasma glucose by curcumin is related to an increase in glucokinase activity(Reference Seo, Choi and Jung11). This enzyme is activated when intracellular glucose levels are raised; it converts glucose to glucose-6-phosphate, which is then stored in the liver in the form of glycogen(Reference Zelent, Najafi and Odili37). We observed that the animals treated with curcumin (at 90 mg/kg BW per d) showed a rise in hepatic glycogenesis (Table 1). This hypothesis is strengthened by results obtained by Pari & Murugan(Reference Pari and Murugan38) who observed the normalisation of activities of several key enzymes of carbohydrates metabolism; in this experiment, the metabolite tetrahydrocurcumin was more effective than curcumin.
A third possible mechanism by which curcumin could reduce hyperglycaemia relates to its antioxidant activity. Thus, Narayanasamy et al. (Reference Narayanasamy, Namasivayam and Radha39), using alloxan to induce experimental diabetes in rats, treated them with an aqueous suspension of curcumin (0·8 g/kg BW per d) or of powdered turmeric rhizomes (1·0 g/kg BW per d) and suggested that the antioxidant activity would diminish the oxidative damage to the pancreas in the treated rats, resulting in a relative increase in insulin secretion and hence a decrease in plasma glucose levels. Further published data also show that curcumin promotes a fall in the level of oxidative stress, indicated by low levels of thiobarbituric acid-reactive substances, which could be due to the reduction of glucose levels through the polyol pathway, leading to a higher NADPH:NADP ratio and consequently a higher level of glutathione peroxidase, a potent antioxidant enzyme(Reference Arun and Nalini40).
Despite the hypothetical mechanisms referred to previously, we found that curcumin does not promote a fall in blood glucose in ND rats (Table 1 and Fig. 2). This suggests that, at least in part, the mechanism for the action of curcumin involves a pathway independent of insulin. This notion is supported by data showing that, in the presence of 10 nm-insulin, the addition of 25 μm-curcumin to isolated mouse hepatocytes enhanced the inhibitory effect of insulin on hepatic gluconeogenesis, which demonstrated that curcumin inhibits hepatic gluconeogenesis by a pathway independent of insulin(Reference Fujiwara, Hosokawa and Zhou41). This mechanism of reducing the level of blood glucose, independent of insulin, is also seen in the action of metformin (biguanide) the well-known hypoglycaemic drug(Reference Mithieux, Guignotl and Bordet42). A recent report indicates that curcumin and insulin together produce a synergistic anti-hyperglycaemic effect on muscle cell glucose metabolism in the mouse myoblast cell line(Reference Kang and Kim43).
The DM syndrome is accompanied by changes in lipid metabolism(Reference Martin, Sven-Olof and Marja44). In this study, there were significant decreases in both total cholesterol and TAG in group DI, relative to the other diabetic groups, while in group DC90 we observed a significant fall only in the TAG level, relative to group DW. Since curcumin activates hepatic acyl-CoA oxidase, which is responsible for the first step in the oxidation of fatty acids(Reference Asai and Miyazawa10), it has been proposed that curcumin stimulates fatty acid oxidation rather than adipogenesis in its anti-diabetic effect, thus contributing to the lowering of lipid levels in patients(Reference Soni and Kuttan45) and animals(Reference Asai and Miyazawa10, Reference Na, Zhang and Li46). However, there are data that contradict these claims; thus Baum et al. (Reference Baum, Cheung and Mok47) observed no such effects on TAG levels.
Our investigation of the serum levels of cholesterol and HDL-cholesterol showed that curcumin had no effect. Baum et al. (Reference Baum, Cheung and Mok47) also observed no effect on the levels of these lipids in men and women, who took curcumin in capsules or as a food supplement for 6 months. On the other hand, there are published reports in which curcumin influenced the progression of diabetes by diminishing lipid peroxidation by a mechanism initially attributed to the hypocholesterolaemic influence of curcumin(Reference Babu and Srinivasan48).
Diabetes is known to provoke raised levels of hepatic enzymes such as AST, ALT and ALP in the blood(Reference Hussein and Abu-Zinadah8, Reference Mori, Baviera and Ramalho34). We found that animals treated with curcumin at a dose of 90 mg/kg BW per d exhibited lower levels of these activities than the rats in DW and DY for all three enzymes and at 60 mg/kg BW per d for ALT alone. These results confer on curcumin a hepatoprotective role, as also reported by Hussein et al. (Reference Hussein and Abu-Zinadah8). It is well worth noting that the fall in AST activity was clearly dose-dependent, albeit significantly different from DW and DY for DC90 alone.
Our results demonstrate that, in diabetic rats, curcumin (group DC90) was capable of improving glycaemic levels, as well as the other markers for diabetes under study. Among the various hypothetical mechanisms by which curcumin could improve the metabolic state in diabetes, the present results are suggestive of a rise in glycogenesis.
On the basis of these results, we can state that curcumin-supplemented yoghurt possesses anti-diabetic activity, as it led to an improvement in all the classical markers for experimental diabetes, suggesting the potential use of yoghurt as a vehicle for the treatment of diabetes with curcumin. Further research is under way, to investigate the pharmacokinetics of curcumin-supplemented yoghurt following its introduction by gavage, as well as its possible cooperation with insulin.
Acknowledgements
The authors wish to thank the Brazil National Research and Development Council (CNPq), Foundation for the Development of the São Paulo State University (FUNDUNESP), the Scientific Research Aid Program of the Araraquara School of Pharmaceutical Sciences, UNESP (PADC-FCF-Araraquara-UNESP) and the São Paulo State Research Aid Foundation (FAPESP) for the financial support. The authors are also grateful to Marcos Dangona for his technical assistance. V. O. G., C. M. P., R. P. A., R. C. V., M. T. P. and I. L. B. disclose no conflicts of interest. M. T. P. and I. L. B. designed the study, analysed and interpreted the data and corrected the manuscript; V. O. G., C. M. P. and M. T. P. carried out the experiments and the physiological determinations; V. O. G., C. M. P., R. P. A. and R. C. V. performed the biochemical determinations; all authors read and approved the final version of the manuscript.


