


Economic changes in low- and middle-income countries (LMIC), rooted in rapid urbanisation and globalisation, are generating dramatic shifts in the food supply level, through a process-denominated nutrition transition(Reference Popkin and Gordon-Larsen1,Reference Popkin2) . Overall, these changes tend to lead to a ‘westernisation of the diet’ characterised by a decline in the consumption of non-processed or minimally processed food, nutritionally more dense (e.g. fruits, vegetables, legumes and whole grains) and a concomitant increase in the consumption of processed food, more likely to be energy dense, rich in fat, sugar and salt(Reference Popkin2). This transition is ongoing in Central Asia and, specifically, in Tajikistan(3) where increased consumption of processed food and soft drinks has been reported(Reference Kelly, Jackson, Spiess and Sultana4).
Other changes in lifestyle, including the adoption of sedentary behaviours, such as a decrease in the time dedicated to cooking and an increase in the time spent away from home, have been described(Reference Popkin2,Reference Winarno and Allain5) . In this context, street food is becoming a popular food source, which are cheap, easily accessible(Reference Winarno and Allain5,Reference Liu, Zhang and Zhang6) and widespread across the Asian region(Reference Bhowmik7). Currently, street food has, indeed, a sizeable contribution to the diet of many people in developing countries, frequently acting as a replacement for home meals. Although some studies have estimated that street food largely contributes to the total intake of fat, trans-fatty acids (TFA), salt and sugar(Reference Steyn, McHiza and Hill8), it is known that the nutritional composition of street food varies widely, depending on the ingredients used (many of which are country specific), preparation and food processing methods(Reference Steyn, McHiza and Hill8–Reference Draper10).
Globally, the tendency towards the higher prevalence of these unhealthy dietary habits in LMIC might have contributed to the increasing burden of non-communicable diseases (NCD), such as obesity, over the last decades(Reference Popkin and Gordon-Larsen1,Reference Popkin11,Reference de Souza, Mente and Maroleanu12) . In Tajikistan, NCD are the leading cause of death; that is, CVD, cancer, respiratory diseases and diabetes, respectively, account for 42, 10, 4 and 2 % of all deaths(13). There has been a steady increase in overweight and obesity in recent years, especially in urban areas, despite the coexistence of childhood undernutrition(3,14) .
Research on street food has focused mostly on issues linked to hygiene and food safety, and little is known about the nutritional characteristics of street food(Reference Steyn, McHiza and Hill8,Reference Abrahale, Sousa and Albuquerque15) . Also, there is currently a gap in knowledge of diet and nutrition surveys in countries in Central Asia, such as Tajikistan(Reference Rippin, Hutchinson and Evans16), and consequently a lack of knowledge about food availability and dietary habits of this population. Therefore, the objective of the present study was to characterise the street food environment in Dushanbe, Tajikistan, focusing on the vending places and their food available and to describe the nutritional composition of the most commonly available food.
Methods
The definition of street food adopted in the present study was proposed by the FAO and the WHO, as ‘ready-to-eat food and beverages prepared and/or sold by vendors or hawkers especially in the streets and other similar places’(17,18) .
Study design and setting
The present study was conducted within the scope of the FEEDCities project supported by the WHO–Europe, which used a stepwise standardised methodology to characterise the street food environment in countries in Central Asia and Eastern Europe(19). This cross-sectional evaluation was specifically designed to assess the availability and nutritional composition of the street food in Dushanbe, the capital city of the Republic of Tajikistan.
The city of Dushanbe is the largest in the country, with an estimated population of 873 000 inhabitants, approximately 10 % of the total population(20). It is formally divided in four districts: Shomansur, Firdavsi, Sino and Somoni. In a site visit conducted for groundwork, prior to data collection, members of the research team observed that, in this setting, most street food vendors were operating within or in the proximity of public markets. Thus, from the list of thirty-six public markets identified by local authorities, a fixed proportion (approximately 25 %) of the markets from each district was randomly chosen, totalling ten markets. These were selected through stratified random sampling, by district, ensuring the representation of all districts.
To define the study area, a 500-m diameter buffer was built around each selected market (with the centroid in its geographic midpoint), covering the market and its surroundings. One of the markets – Korvon – was larger than the 500-m buffer and, in this case, the study area included the whole market and was limited by the streets defining its perimeter (only the vending sites on the side of the streets closest to the market were evaluated).
Eligible vending sites were defined as the business establishments selling ready-to-eat food, including beverages and/or snacks, from any venue other than permanent storefront businesses or establishments with four permanent walls not selling directly to the street, but operating in a predefined perimeter. This includes mobile vendors as well as sellers with semi-static or stationary vending units. The exclusion criteria were the following: (1) food establishments with four permanent walls, (2) permanent storefront business, (3) street vendors selling exclusively non-food products or raw food not ready to eat and (4) food stalls and carts that were part of permanent stores or licensed establishments.
The vendors from all the eligible vending sites in the study areas were invited to participate. From a total of 866 eligible vending sites identified, 800 (92·4 %) vendors accepted to participate. No statistically significant differences were found between participant and non-participant vendors regarding the location (district and market) and the physical setup of the stationary vending sites they were operating. Participation rate was higher among vendors from mobile vending sites (98·5 v. 91·3 %, P = 0·005) (Supplementary Table S1, online Supplementary material S1).
Data collection: vending sites, vendors and food availability
The markets were assessed on consecutive days, ensuring the representation of both weekdays and weekends. Field researchers, operating in pairs, canvassed each study area in search of street food vending sites, starting from the assessment of the whole market and then moving to the surroundings. After registering the Global Positioning System (GPS) coordinates of each vending site, they approached the vendor, explaining the study objectives and asking for a general expressed consent to participate in the study. When the vendor agreed, the interviewers proceeded with an electronic structured questionnaire (approximately 10 min) enquiring about vendors’ (ownership) and vending sites’ characteristics (access to drinking water; toilet facility and electricity), food vending activity (operating periods – during the week, during the year and under which weather conditions), and the food available (type of products and servings), mostly answered by the vendor. Additional questions were answered by the interviewers through direct observation (sex of the vendor, mobility of the vending site and the type of physical setup). Stationary vending sites were further classified into formal (i.e. table with chairs for customers, stand, dukoni (pavement side windows from permanent storefront businesses or establishments with four permanent walls, traditional in Central Asia) or truck) or informal (i.e. items displayed on the ground, bench with table board, push cart and other improvised sites as freezers, refrigerators or coolers).
Food available were grouped according to their nature, into fruits (product in natura, either fleshy or dry), beverages (any alcoholic and non-alcoholic drink) or food other than fruits. Food other than fruits and beverages were further classified as homemade (food of domestic manufacture, cooked and/or prepared at home or on the street, even if using industrial ingredients) or industrial (food products produced by food industry and sold as is without further preparation and/or cooking, encompassing both processed and ultra processed food(Reference Monteiro, Cannon and Moubarac21). Homemade food was also grouped into ‘cooked’, ‘prepared but uncooked’ and ‘uncooked and unprepared’. Beverages were further classified into soft drinks, water, fruit juice-based drinks, fresh fruit juice, milk, alcoholic beverages, energy drinks, coffee, tea, fruit cocktails and traditional beverages.
To easily identify the vendors already approached, the questionnaire started with a control question asking whether the vendor had already been interviewed and, once each interview was completed, a sticker with the logo of the research project was attached to the vending site, if the vendor agreed. To minimise the proportion of missing data and to increase data quality, extensive training of the interviewers and detailed standard operating procedures for data collection were implemented.
Food sample collection and nutritional composition assessment
Samples of the most commonly available food (identified previously through the data on food availability) were collected for proximate analysis. Twenty-five homemade (online Supplementary material S2) and ten industrial food most commonly available were identified. Four samples of each of these food were collected from different vending sites. Exceptionally, for some food, it was only possible to collect three samples. A total of 134 samples (ninety-nine homemade and thirty-five industrial) were collected.
Briefly, the selection of the eligible previously assessed vending sites where the food samples were collected was carried out randomly from the list of the GPS coordinates. The thirty-five most commonly available food were collected for 10 consecutive days, following the same order used for the initial assessment of the ten markets. In each market, ten GPS coordinates – location of ten vending sites – were randomly selected for purchasing the corresponding sets for the day. Only one sample of homemade and one sample of industrial food could be obtained from the same vending site. If it was not possible to buy the target food at the selected coordinates, a systematic selection procedure (north, clockwise) starting from that point was followed, until reaching vending sites where these food were available.
A sample of each food product, corresponding to one serving, was bought whenever possible at these vending sites. In each day, approximately fourteen samples of different food were collected. Later, these were properly homogenised, weighted, identified and stored in a freezer (–18°C) until the proximate analysis was conducted(19). Before analysis, samples were defrosted, homogenised and immediately analysed.
The assessment of the nutritional composition included the analysis of (a) moisture, by oven drying at 103°C until constant weight, (b) protein by Kjeldahl’s method, (c) fat by Soxhlet’s method and (d) fatty acids by GC for the fatty acid methyl esters, according to a validated method(Reference Costa, Cruz and Graça22). Total carbohydrates plus fibre were estimated by difference(Reference Horwitz23). The energy value of samples was estimated after proximate analysis of food components (moisture, protein, total fat and ash), performed in accordance with standard methods, as recommended by the Association of Analytical Communities(Reference Horwitz23). All the analytical results were the average of at least two determinations per food sample and were expressed by serving size (g).
Statistical analysis
Assuming a design effect up to 1·5, a sample size of approximately 300 vending places would yield 95 % CI of up to 15 % wide for observed proportions ranging between approximately 30 and 70 %, and 95 % CI for means with a width of approximately 30 % of the observed standard deviation.
The vending sites and their food availability were characterised through absolute and relative frequencies (categorical variables). Pearson’s χ 2 test was used to identify statistically significant differences between stationary and mobile vending sites and between formal and informal stationary vending sites. These estimates were adjusted for the clustered sampling design. Results were considered statistically significant when the critical level of significance (P) was less than 0·05.
Regarding the nutritional composition assessment, mean serving sizes per food, in grams, were calculated as the mean weight of the individual samples collected at the different vending sites. The average content of each nutrient in selected food was obtained from the mean content in the individual samples. Per-serving levels of each nutrient were expressed in g/serving and in g/100 g (Supplementary Tables S2 and S3, online Supplementary material S3). Results were presented for each food, as means and ranges of carbohydrates, protein, water, total fat, including SFA, MUFA, PUFA, n-3 and n-6 and TFA and energy (kcal) per serving. To convert energy in kcal to kJ, the values should be multiplied by 4·184. The non-parametric Mann–Whitney U test was used for comparing the energy content of homemade and industrial food.
Statistical analysis was performed using the software STATA® version 11.0 for Windows®.
Ethical considerations
The present study was conducted according to the guidelines laid down in the Declaration of Helsinki, and all procedures involving human subjects were approved by the ethics committee of the Institute of Public Health of the University of Porto (CE16058). Verbal informed consent was obtained from all subjects.
Results
Fig. 1 depicts the markets selected for the present study, scattered throughout the city of Dushanbe and the vending sites evaluated. Within each market, the distribution of the vending sites ranged from predominantly concentrated specific market sections, as in the Kariyai-Bolo, Mirzokhuja, Varzob and Zarafshon markets, to scattered across wider areas, as in the forty-sixth Microregion, Kabir, Korvon, Sakhovat, Shohmansour, Sultoni and Yakkachinor markets.
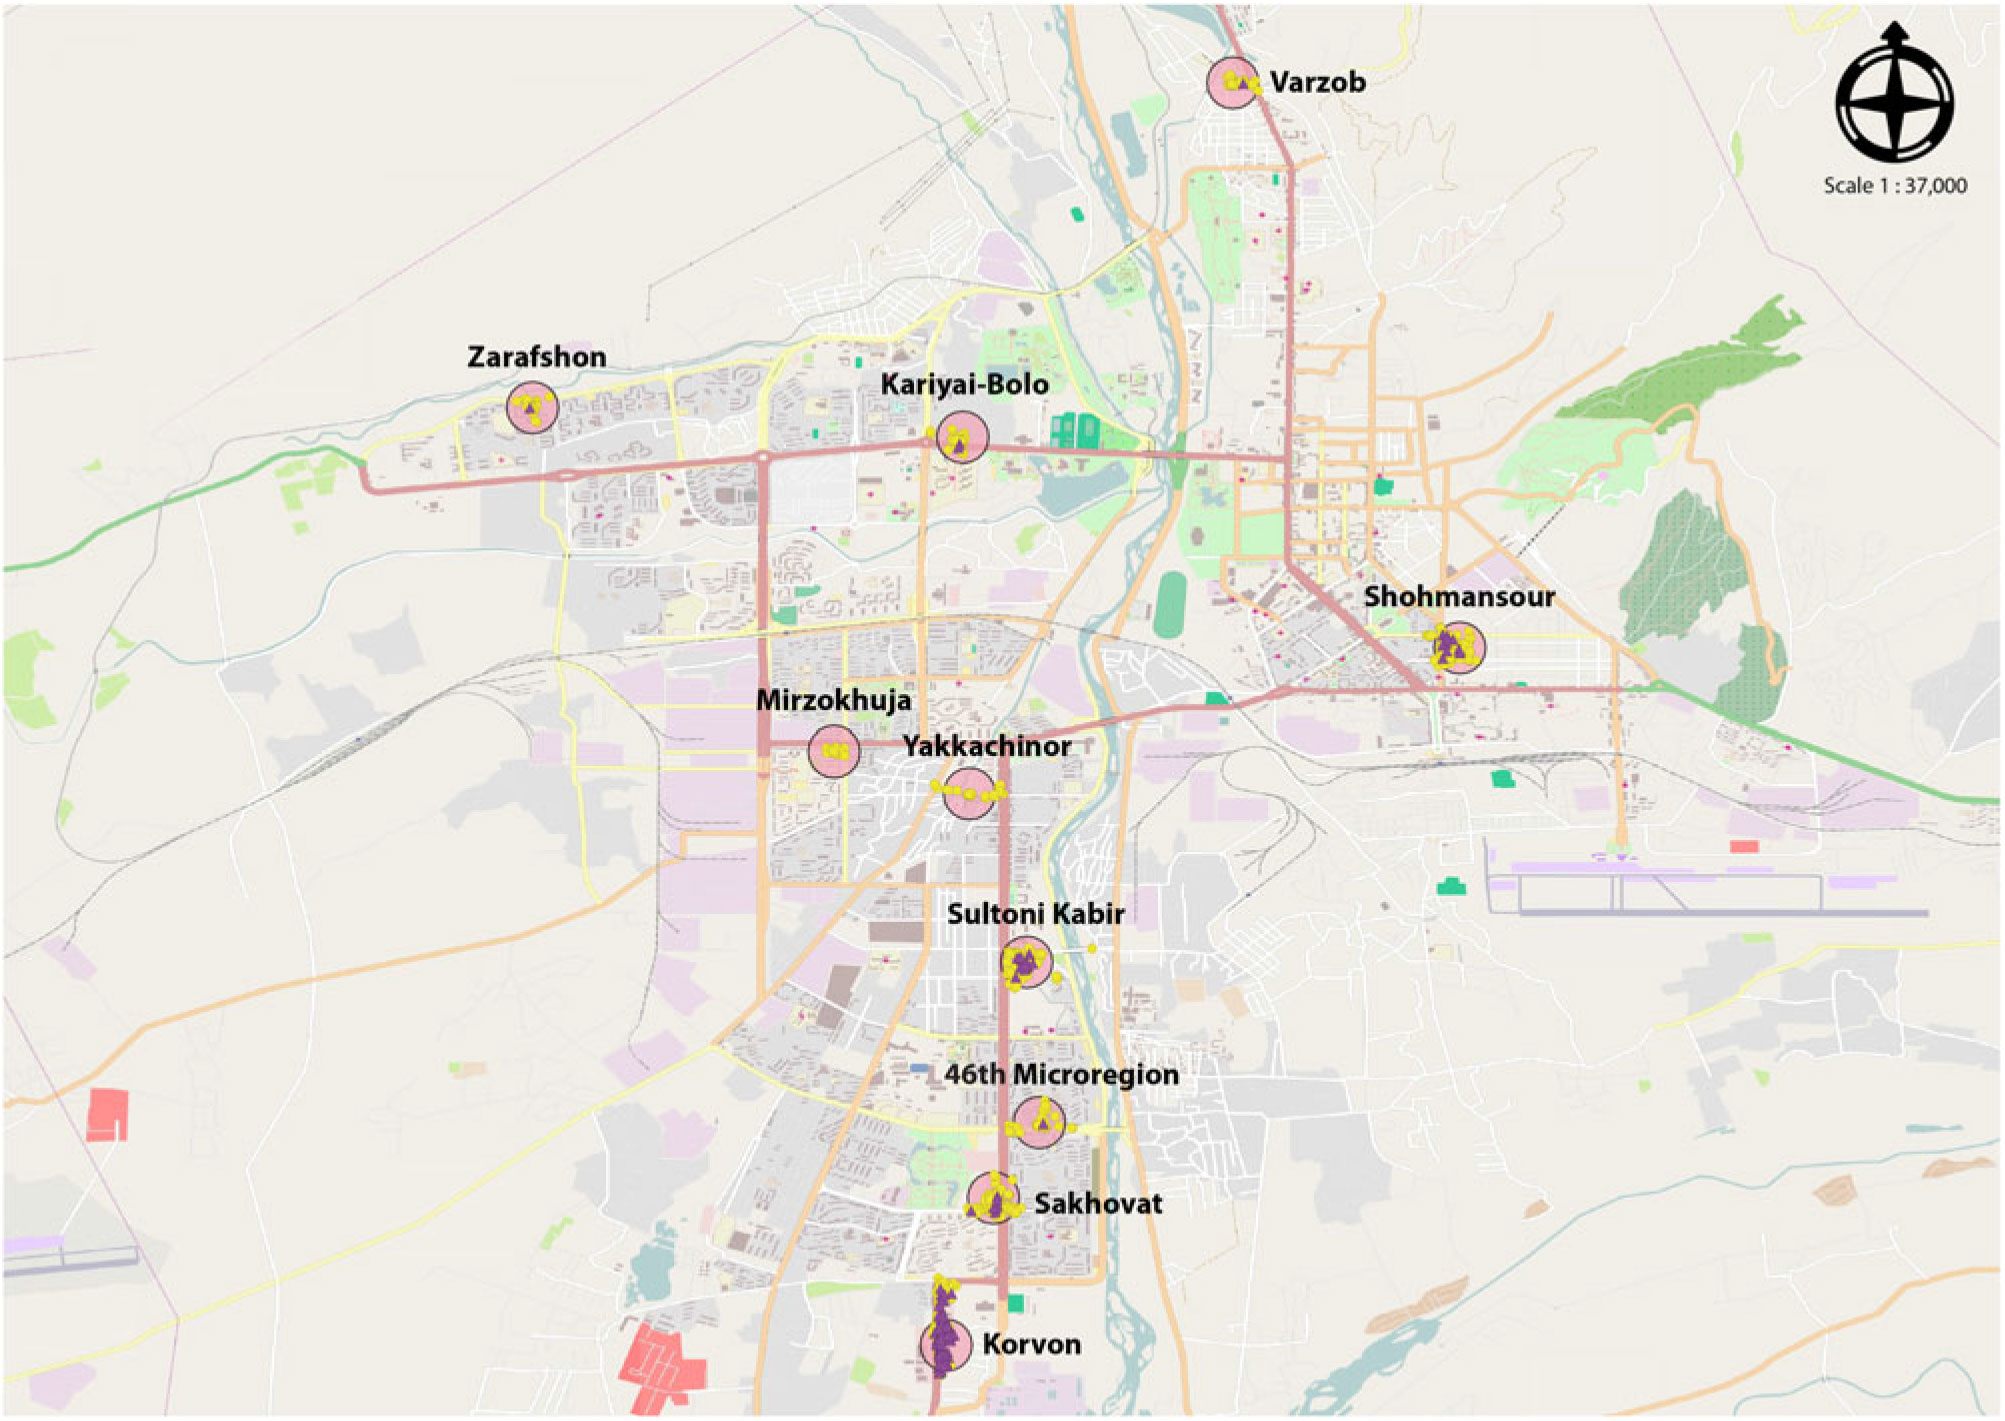
Fig. 1. Geographical distribution of the markets and street food vending sites in Dushanbe, Tajikistan. ![]() , Fixed vendor;
, Fixed vendor; ![]() , mobile vendor;
, mobile vendor; ![]() , study area. Source: Openstreetmap, FEEDCities.
, study area. Source: Openstreetmap, FEEDCities.
Food vendors and vending sites
Of every five street vendors, over three were women (61·6 %) or owners of the business (67·4 %), regardless of the type of vending site. Most vending sites were stationary (84·1 %) (Supplementary Table S4, online Supplementary material S4). Of these, most had access to drinking water (98·7 %) and toilet facilities (97·9 %), were operating 7 d a week (91·4 %), all year-long (70·9 %) and under all types of weather conditions (70·3 %). The informal vending sites were less likely to work under every type of weather (63·4 v. 76·0 %, P < 0·001). Access to electricity was less frequent among the informal vending sites (40·9 v. 82·4 %, P < 0·001) (Supplementary Table S5, online Supplementary material S4).
Food availability
Fruits and beverages were sold, respectively, in 4·5 and 40·5 % of the vending sites. Food other than fruits was sold in 87·4 % of the vending sites, of which 63·6 % sold only homemade food, 19·4 % only industrial and 17·1 % both homemade and industrial food. The mobile vending sites were more likely to sell food other than fruits (91·3 v. 86·6 %, P = 0·018), namely, only homemade food, while the stationary vending sites sold industrial food more frequently. Most homemade food available were cooked (81·9 %), especially in mobile vending sites (86·1 v. 80·9 %, P = 0·031) (Table 1). Stationary vending sites were the only ones selling fruits and where beverages were more frequently available compared with mobile vending sites (45·8 v. 12·6 %, P < 0·001) (Table 1), selling mostly soft drinks (68·5 %), water (41·2 %) and traditional beverages (33·3 %) (Table 1).
Table 1. Ready-to-eat food products available in stationary street food vending sites in Dushanbe, Tajikistan (n 673)
(Numbers and percentages)

* Informal physical setups: bench with table board (n 175); displaying food on the floor (n 58), push cart (n 19) and other sites (n 51) as freezer (n 22), soda water machine (n 16), soft ice cream machine (n 8), popcorn machine (n 1), car trunk (n 1) and unspecified (n 3). Formal physical setups: dukoni (n 171), stand, stall or booth (n 90), tables with chairs for customers (n 69) and truck (n 40).
† Traditional beverages: compote (n 75), yogurt (n 13), kephyr (n 13), dugob (n 10), ayran (n 3) and churgot (n 2).
‡ Fresh fruit juice: fresh juice (n 5) and fresh fruit lemonade (n 1).
§ Alcoholic beverages: kvas (n 1), beer (n 1), cognac (n 1) and vodka (n 1); one vending site sold several types of alcoholic beverages; for three vending sites, the type of alcoholic beverages sold was not available.
Table 2. Nutritional composition (energy and macronutrients) of the street food samples evaluated by proximate analysis, per serving
(Mean values and ranges (min–max))

* To convert energy in kcal to kJ, the values should be multiplied by 4·184.
Table 3. Nutritional composition (fatty acid profile) of the street food samples evaluated by proximate analysis, per serving
(Mean values and ranges (min–max))

TFA, trans-fatty acids.
Nutritional composition
Industrial food were more energy dense than homemade food (median kcal/100 g: 328 v. 190, P < 0·001), but the homemade food presented higher energy content per serving (median kcal/ serving: 452 v. 276, P < 0·001). The mean energy values per serving were highest in homemade traditional dishes and snacks such as shawarma (612 kcal/serving) and plov (855 kcal/serving). The food with the highest carbohydrate content were some types of homemade bread (kulcha (mean: 80·6 g/serving)) and traditional dishes, such as plov (mean: 123·6 g/serving). Homemade traditional food and snacks showed the highest mean protein (shawarma (30·5 g/serving), soup (44·3 g/serving)) and total fat (plov (28·8 g/serving) and shawarma (32·6 g/serving) content per serving (Table 2).
The highest mean lipid profile content in SFA was found in homemade soup (10·9 g/serving) and in industrial wafers (12·9 g/serving), the latter also presented a high content of TFA (2·5 g/serving), along with homemade cakes (1·8 g/serving). The highest MUFA content was found in industrial wafers (9·7 g/serving) and in homemade shawarma (10·8 g/serving). The highest PUFA content, and particularly n-6 fatty acids, was found in homemade fried potatoes (11·3 and 11·1 g/serving, respectively) and in shawarma (13·9 and 13·6 g/serving, respectively). Fried fish (0·3 g/serving) and plov (1·8 g/serving) presented the highest mean content of n-3 fatty acids (Table 3, Supplementary Table S2, online Supplementary material S3).
Discussion
The street food most commonly available in Dushanbe include a wide range of traditional and westernised food, such as bread, main dishes, snacks, savoury and sweet pastries, sandwiches, cakes and cookies. A considerable proportion presented high energy, that is, SFA and TFA contents.
Energy-dense food and beverages were highly available in street food vending sites in Dushanbe, as documented in other settings(Reference Steyn, McHiza and Hill8,Reference Gupta, Downs and Ghosh-Jerath24) . Compared with homemade food, industrial food were more energy dense, which could be due to their high fat and sugar content, as previously reported(Reference Moodie, Stuckler and Monteiro25). In contrast, homemade food presented a higher energy content per serving. Actually, this group of food includes main dishes, garnishes and sandwiches, usually consumed as main courses, and in larger servings compared with other street food that are expected to be consumed as snacks. The high-energy content per serving seems to be explained, in part, by their content in fat and carbohydrates, possibly sugar, as observed in other urban contexts(Reference Steyn, McHiza and Hill8). The most energy-dense industrial (e.g. sunflower seeds and wafers) and homemade food (e.g. plov and shawarma) were, indeed, those with the highest fat content. In addition, sweet pastries and cookies were the highest industrial sources of carbohydrates, possibly due to a high sugar content, as found in a similar setting(Reference Koodagi, Kendra and Farm26). In the present study, it was not possible to discriminate the amount of free sugars in the analysed food. Nevertheless, the availability of sugary food in Dushanbe is presumably high, as the availability of soft drinks, confectionery, cookies, cakes, sweet pastries and snacks, mostly industrial, was widely reported. The homemade food with higher content of carbohydrates per serving include bread, main dishes and garnishes, such as plov, shawarma, fried potatoes, hamburger and hot dog, which are expected to be low in free sugars.
Street food were more frequently homemade and cooked. The homemade main dishes, whether traditional such as plov, soup or shawarma or more westernised such as hamburger, demonstrated the highest protein content per serving, as found in a similar study(Reference Sousa, Gelormini and Damasceno27). A systematic review on the nutritional composition of street food in developing countries has, actually, reported a significant contribution of street food to the daily protein intake(Reference Steyn, McHiza and Hill8). The predominance of homemade preparations in generous serving sizes and rich in protein may reflect the role of street food in the main meals throughout the day and reinforce that street food may have an important contribution to the daily intake of the urban population of Dushanbe.
Our results show that food that are normally be considered healthy, as for example soup or plov, traditional homemade dishes prepared with vegetables, may be important sources of fat, particularly SFA or TFA, depending on the ingredients used. This may be due to the rising influence of the food industry in LMIC and the appealing increased availability of more processed ready-to-eat food and ingredients, such as oils and fats(Reference Steyn, McHiza and Hill8). In fact, in this setting, SFA and TFA were present in high proportions in industrial food, as expected, but also in homemade cakes and traditional meals. Considering an average adult daily intake of 2000 kcal, one serving of some food encompassed over half the daily WHO recommendation for TFA (<1 % total energy value/d)(Reference Uauy, Aro and Clarke28). In addition, for several of these food, the fat content varied considerably, indicating possible differences in cooking methods or the ingredients used(Reference Steyn, McHiza and Hill8–Reference Draper10), particularly the oils and fats(Reference Gupta, Downs and Ghosh-Jerath24), as a large proportion of the analysed food were fried. Ultimately, these ingredients seem to be used in inadequate amounts, which, coupled with the large servings of some homemade food (namely, those usually consumed as main courses, such as soup), results in the exceeding of the recommended measures for such fatty acids.
The results of the present study, together with data from previous published data reporting high sodium content in some of the analysed street food, particularly main dishes and sandwiches(Reference Lanca de Morais, Lunet and Albuquerque29), could be framed into previous findings on the nutrition transition in LMIC countries of Central Asia, as Tajikistan. After economic constraints and limited food availability for decades, resulting in a high burden of nutritional deficiencies(3), the country has been evolving towards a double burden of malnutrition and NCD(3,14) . A rapid increase in the dietary energy supply adequacy and specific patterns of food consumption has been reported, that is, decreasing cereal, roots and tuber consumption and increasing consumption of animal products. The availability of sugar, sweeteners and vegetable oils has also been increasing(3). In spite of not assessing the essential characteristics of each of the nutrition transition stages, the evidence suggests that the country, and particularly the urban Dushanbe, is moving to stage 4, degenerative disease(Reference Nnyepi, Gwisai and Lekgoa30). This stage is characterised by an increased consumption of processed beverages and food rich in sugar and fat, associated with the evolution of food-transforming technologies, and a decreased consumption of nutrient-dense food such as fruits and vegetables(Reference Popkin and Gordon-Larsen1,Reference Kelly, Jackson, Spiess and Sultana4) .
Even though the data of the present study reflect availability, and not consumption, the accessibility to sugars and fat should be the object of monitoring in urban Dushanbe, as an unbalanced consumption of these nutrients has been associated with weight gain over time and with the development of obesity and other diet-related NCD(Reference Gulati and Misra31–33). The high availability of soft drinks is a cause of concern, as these have been identified as the main source of added sugar in some contexts(Reference Mozaffarian, Hao and Rimm34,Reference Malik, Willett and Hu35) . It is known that the consumption of soft drinks is on the rise in upper-middle-income countries and LMIC, with countries in Central Asia showing moderate consumption levels(Reference Singh, Micha and Khatibzadeh36). Concerning fats, local interventions on the street food environment, including, for example, the promotion of healthy cooking practices, while maintaining tradition, have been successfully implemented in other countries(Reference Hawkes, Jewell and Allen37). Governmental interventions, in collaboration with the food industry, whether acting on nutrition labelling or on the replacement of such fats by healthier options at competitive prices, have also shown successful results worldwide(Reference Downs, Thow and Leeder38). These are possible solutions to promote the healthiness of the street food in this setting. Monitoring is also relevant, as a legal limit of 2 g TFA/100 g fat in food is already implemented in the country, as part of membership to the Eurasian Economic Commission(39).
Vending sites were mostly located inside and in the vicinity of public markets and were mostly stationary, resembling characteristics of other urban food environments in Asia, where street food vending sites are becoming aggregated in food centres and markets, under the supervision of the local governments(Reference Bhowmik7). Street food vendors mostly consisted of women and were owners of the business, results which also underline the increasing socio-economic relevance of this sector as a source of employment and generator of household income(Reference Fellows and Hilmi40), where the participation of women is gaining visibility(Reference Winarno and Allain5,Reference Namugumya and Muyanja9,Reference Roever and Skinner41) .
This is a pioneer study, with the purpose of providing an exploratory description of the street food environment in Dushanbe. The study design and analysis aimed to ensure the representativeness of the street food environment in the entire city. The presentation of the nutritional composition based on food servings aimed to provide a better representation of the real intake, by occasion of consumption, highlighting the difference in energy and nutrient intake. It enables the comparison between food frequently consumed throughout the day and those not so often eaten, for example, a frequent consumption of energy-dense food of small portions and consuming one higher serving size of a lower energy-dense food. Ultimately, the goal was to communicate the public health message of the need to take into account the serving sizes when discussing the nutritional quality of food. Although the results may not be generalised to other communities, given some culture-specific characteristics of the local food environment, the methodology has a wide potential to be adapted in different settings(19), allowing for comparison of results. The stepwise systematic approach for data collection is another study strength, given that it provides an overview of the street food environment, regarding location and characterisation of vending sites and vendors, and of the street food availability, with insight into its nutritional composition, overcoming several gaps identified in previous literature(Reference Steyn, McHiza and Hill8,Reference Abrahale, Sousa and Albuquerque15) . Future research with focus on street food customers might provide insight into the patterns of street food consumption in this city, including types of food, but mostly the frequency and occasion of purchase and consumption.
Conclusions
The street food environment in Dushanbe is characterised by the availability of traditional dishes and snacks as well as of westernised food and food practices. The high availability of energy-dense processed food rich in carbohydrates, SFA and TFA might be due to greater access to industrial food and ingredients, which deserves attention. These findings establish a good basis to support the need to define health promotion strategies in the urban context of Tajikistan. All stakeholders, including the government in collaboration with the food industry, street food vendors and consumers, must be involved in the effort to ensure food security for the urban community.
Acknowledgements
The authors would like to thank the support and collaboration of the Ministry of Health and Social Protection of Population in Tajikistan and the engagement of the local coordination team representing the Republican Centre for Nutrition Issues and the State Sanitary Epidemiology Surveillance Service. The authors also express their sincere gratitude to the local team of field researchers and to the professionals responsible for the proximate analysis; their commitment was essential to the accomplishment of the present study.
The FEEDCities project was funded by the World Health Organization Europe (WHO registration 2015/591370 and 2017/698514) and by FEDER through the Operational Programme Competitiveness and Internationalization and national funding from the Foundation for Science and Technology—FCT (Portuguese Ministry of Science, Technology and Higher Education), under the Unidade de Investigação em Epidemiologia—Instituto de Saúde Pública da Universidade do Porto (EPIUnit) (POCI-01-0145-FEDER-006862; Ref. UID/DTP/04750/2019). An individual PhD grant attributed to GA (SFRH/BD/118630/2016) was funded by FCT and the ‘Programa Operacional Capital Humano’ (POCH/FSE). The funders had no role in the design, analysis or writing of this article.
M. G., A. D., P. M., J. J., J. B., N. L. and P. P. designed the study. I. M. and M. G. supervised the study implementation and data collection. O. P. and S. C. were responsible for the proximate analysis of the food samples collected. G. A., N. L. and P. P. performed the analysis and interpretation of the results. G. A. drafted the manuscript. All authors critically revised the manuscript and gave their final approval of the manuscript submitted for publication.
The authors declare that they have no conflicts of interest. J. B. and J. J. are staff members of the WHO Regional Office for Europe. The authors are responsible for the views expressed in this publication and they do not necessarily represent the decisions or stated policy of the WHO.
Supplementary material
For supplementary material/s referred to in this article, please visit https://doi.org/10.1017/S0007114519001892


 Open access