


I. INTRODUCTION
Halofuginone hydrobromide (sold under the brand names Stenorol and Tempostatin) is a semisynthetic quinazolinone alkaloid anticoccidial derived from the plant Dichroa febrifuga, with antifibrotic and potential antineoplastic activities. It has been registered as an anticoccidial feed additive for broiler hens and turkeys (EMEA, 2000). Halofuginone specifically inhibits collagen type I gene expression and matrix metalloproteinase 2 (MMP-2) gene expression, which may result in the suppression of angiogenesis, tumor stromal cell development, and tumor cell growth. These effects appear to be due to halofuginone-mediated inhibition of the collagen type I and MMP-2 promoters. Collagen type I and MMP-2 play important roles in fibro-proliferative diseases (National Cancer Institute, https://ncithesaurus.nci.nih.gov/ncitbrowser/ConceptReport.jsp?dictionary = NCI_Thesaurus&version = 21.08e&code = C2656&ns = ncit). Halofuginone hydrobromide was used for the treatment of Duchenne muscular dystrophy, but has been withdrawn. Halofuginone is a low molecular weight quinazolinone alkaloid, and a potent inhibitor of collagen alpha1(I) and matrix metalloproteinase 2 (MMP-2) gene expression. Halofuginone also effectively suppresses tumor progression and metastasis in mice. Collgard Biopharmaceuticals is developing halofuginone for the treatment of scleroderma and received orphan drug designation from the U.S. Food and Drug Administration in March 2000 (Drugbank, https://go.drugbank.com/salts/DBSALT000462). The systematic name (CAS Registry Number 64924-67-0) is 7-bromo-6-chloro-3-[3-[(2S,3R)-3-hydroxypiperidin-2-yl]-2-oxopropyl]quinazolin-4-one hydrobromide. A two-dimensional molecular diagram is shown in Figure 1. We are unaware of any published X-ray powder diffraction data on this compound.

Figure 1. The 2D molecular structure of the halofuginone cation.
This work was carried out as part of a project (Kaduk et al., Reference Kaduk, Crowder, Zhong, Fawcett and Suchomel2014) to determine the crystal structures of large-volume commercial pharmaceuticals, and include high-quality powder diffraction data for them in the Powder Diffraction File (Gates-Rector and Blanton, Reference Gates-Rector and Blanton2019).
II. EXPERIMENTAL
Halofuginone hydrobromide is a commercial reagent, purchased from TargetMol (Lot #117287), and was used as-received. The white powder was packed into a 1.5 mm diameter Kapton capillary and rotated during the measurement at ~50 Hz. The powder pattern was measured at 295 K at beamline 11-BM (Antao et al., Reference Antao, Hassan, Wang, Lee and Toby2008; Lee et al., Reference Lee, Shu, Ramanathan, Preissner, Wang, Beno, Von Dreele, Ribaud, Kurtz, Antao, Jiao and Toby2008; Wang et al., Reference Wang, Toby, Lee, Ribaud, Antao, Kurtz, Ramanathan, Von Dreele and Beno2008) of the Advanced Photon Source at Argonne National Laboratory using a wavelength of 0.458963(2) Å from 0.5 to 50° 2θ with a step size of 0.0009984375 and a counting time of 0.1 s step−1. The high-resolution powder diffraction data were collected using twelve silicon crystal analyzers that allow for high angular resolution, high precision, and accurate peak positions. A mixture of silicon (NIST SRM 640c) and alumina (NIST SRM 676a) standards (ratio Al2O3:Si = 2:1 by weight) was used to calibrate the instrument and refine the monochromatic wavelength used in the experiment.
The pattern was difficult to index. The cell used here (primitive monoclinic with a = 8.9459, b = 14.2647, c = 15.0265 Å, β = 91.193°, V = 1917.3 Å3) was obtained by DICVOL14 (Louër and Boultif, Reference Louër and Boultif2014) using 23 peaks with I rel > 1, and permitting up to 5 unindexed lines. The unit cell volume (assuming 18 Å3/heavy atom, because of the large Br atoms) corresponds to Z = 4. The space group suggested by EXPO2014 (Altomare et al., Reference Altomare, Cuocci, Giacovazzo, Moliterni, Rizzi, Corriero and Falcicchio2013) was P2 1, which was confirmed by successful solution and refinement of the structure. This is, thus, a larger-than-expected structure (more variables), as there are two independent cations and two bromide anions in the asymmetric unit. A reduced cell search in the Cambridge Structural Database (Groom et al., Reference Groom, Bruno, Lightfoot and Ward2016) with the chemistry H, C, Br, Cl, N, and O only yielded no hits.
This unit cell does not index all of the observed peaks. Attempts to index the remaining peaks on a single unit cell failed, suggesting that at least two impurity phases are present. The European Agency for the Evaluation of Medicinal Products report (2000) indicates that trans-halofuginone is the active ingredient, and that the cis-isomer is present as an impurity. It may, thus, not be unexpected that the pattern was difficult to index.
A halofuginone molecule was downloaded from PubChem (Kim et al., Reference Kim, Chen, Cheng, Gindulyte, He, He, Li, Shoemaker, Thiessen, Yu, Zaslavsky, Zhang and Bolton2019) as Conformer3D_CID_400772.sdf. It was converted to a*.mol2 file using Mercury (Macrae et al., Reference Macrae, Sovago, Cottrell, Galek, McCabe, Pidcock, Platings, Shields, Stevens, Towler and Wood2020). The structure was solved by Monte Carlo simulated annealing as implemented in EXPO2014 (Altomare et al., Reference Altomare, Cuocci, Giacovazzo, Moliterni, Rizzi, Corriero and Falcicchio2013). It was easy to conclude that N6 and N47 in the saturated rings were protonated, so H85 and H86 were added to these nitrogen atoms using Materials Studio (Dassault, 2021).
Rietveld refinement was carried out using GSAS-II (Toby and Von Dreele, Reference Toby and Von Dreele2013). Only the 1.5–25.0° portion of the pattern was included in the refinement (d min = 1.060 Å). The presence of multiple Br atoms means that, even using synchrotron radiation, the sample is absorbing. A value μR = 0.54 (calculated using a tool on the 11-BM Web site, https://11bm.xray.aps.anl.gov/absorb/absorb.php) was included in the refinement. The y-coordinate of Br1 was fixed to define the origin. All non-H bond distances and angles (plus the planes of the fused ring systems) were subjected to restraints, based on a Mercury/Mogul Geometry Check (Bruno et al., Reference Bruno, Cole, Kessler, Luo, Motherwell, Purkis, Smith, Taylor, Cooper, Harris and Orpen2004; Sykes et al., Reference Sykes, McCabe, Allen, Battle, Bruno and Wood2011). The Mogul average and standard deviation for each quantity were used as the restraint parameters. The restraints contributed 3.0% to the final χ 2. The hydrogen atoms were included in calculated positions, which were recalculated during the refinement using Materials Studio (Dassault, 2021). The U iso of the heavy atoms were grouped by chemical similarity. The U iso for the H atoms were fixed at 1.2× the U iso of the heavy atoms to which they are attached. The peak profiles were described using a uniaxial microstrain model, with [001] as the unique axis, chosen on the basis of the BFDH morphology discussed below. A fourth-order spherical harmonic preferred orientation model was included in the refinement. The texture index was 1.020(1). The background was modeled using a 6-term shifted Chebyshev polynomial, and a peak at 7.03° 2θ to model the scattering from the Kapton capillary and any amorphous component.
The final refinement (which was begun from the VASP-optimized structure) of 181 variables using 23 538 observations and 128 restraints yielded the residuals R wp = 0.1134 and GOF = 2.65. The largest peak (1.18 Å from C53) and hole (1.20 Å from H75) in the difference Fourier map were 0.64(14) and −0.51(14) eÅ−3, respectively. The largest intensity differences in the difference plot occur at the impurity peaks, as observable in Figure 2.

Figure 2. The Rietveld plot for the refinement of halofuginone hydrobromide. The blue crosses represent the observed data points, and the green line is the calculated pattern. The cyan curve is the normalized error plot. The vertical scale of the observed and calculated plots has been multiplied by a factor of 5× for 2θ > 12.0°. The row of blue tick marks indicates the calculated reflection positions.
The crystal structure was optimized using VASP (Kresse and Furthmüller, Reference Kresse and Furthmüller1996) (fixed experimental unit cell) through the MedeA graphical interface (Materials Design, 2016). The calculation was carried out on 16 2.4 GHz processors (each with 4 GB RAM) of a 64-processor HP Proliant DL580 Generation 7 Linux cluster at North Central College. The calculation used the GGA-PBE functional, a plane wave cutoff energy of 400.0 eV, and a k-point spacing of 0.5 Å−1 leading to a 2 × 1 × 1 mesh, and took ~30 h. A single-point density functional calculation (fixed experimental cell) and population analysis were carried out using CRYSTAL17 (Dovesi et al., Reference Dovesi, Erba, Orlando, Zicovich-Wilson, Civalleri, Maschio, Rerat, Casassa, Baima, Salustro and Kirtman2018). The basis sets for the H, C, N, and O atoms in the calculation were those of Gatti et al. (Reference Gatti, Saunders and Roetti1994), and those for Br and Cl were those of Peintinger et al. (Reference Peintinger, Vilela Oliveira and Bredow2013). The calculations were run on a 3.5 GHz PC using 8 k-points and the B3LYP functional, and took ~5.7 h.
III. RESULTS AND DISCUSSION
This form of halofuginone hydrobromide crystallizes in space group P21 with Z = 4. Neither the ‘Find Symmetry’ module of Materials Studio nor the ADDSYM function of PLATON (Spek, Reference Spek2009) revealed any additional symmetry in the refined or optimized structures. The root-mean-square (rms) Cartesian displacements between the Rietveld-refined and DFT-optimized structures of halofuginone hydrobromide are 0.338 Å for cation 1 (the lower atom numbers) and 0.500 Å for cation 2 (higher atom numbers) (Figures 3 and 4). The largest differences in each cation are at the hydroxyl groups O3 and O44 on the piperidine rings. The agreement for cation 1 is at the high end for correct powder structures (van de Streek and Neumann, Reference van de Streek and Neumann2014), while that for cation 2 is outside the normal range. The asymmetric unit (with atom numbering) is illustrated in Figure 5. The displacement coefficients of the atoms in the piperidine ring of cation 2 are larger than those of the other atoms, suggesting that there is something unusual about this ring. The chirality of both atoms in both cations in both the refined and optimized structures, is the same and correct (S for C9 and C50 and R for C10 and C51), showing that no inversion occurred during refinement or optimization.

Figure 3. Comparison of the Rietveld-refined (red) and VASP-optimized (blue) structures of cation 1 in halofuginone hydrobromide. The rms Cartesian displacement is 0.338 Å. Image generated using Mercury (Macrae et al., Reference Macrae, Sovago, Cottrell, Galek, McCabe, Pidcock, Platings, Shields, Stevens, Towler and Wood2020).

Figure 4. Comparison of the Rietveld-refined (red) and VASP-optimized (blue) structures of cation 2 in halofuginone hydrobromide. The rms Cartesian displacement is 0.500 Å. Image generated using Mercury (Macrae et al., Reference Macrae, Sovago, Cottrell, Galek, McCabe, Pidcock, Platings, Shields, Stevens, Towler and Wood2020).

Figure 5. The asymmetric unit of halofuginone hydrobromide, with the atom numbering. The atoms are represented by 50% probability spheroids. Cation 1 has the smaller atom numbers, and cation 2 has the larger atom numbers. Image generated using Mercury (Macrae et al., Reference Macrae, Sovago, Cottrell, Galek, McCabe, Pidcock, Platings, Shields, Stevens, Towler and Wood2020).
The two independent cations in the refined structure have different conformations (Figure 6). The rms Cartesian displacement is 1.773 Å. When the ‘inversion’ option in Mercury Calculate Molecule Overlay is invoked, the displacement decreases to 1.343 Å (Figure 7), and (as expected) the greatest differences are in the chiral piperidine rings. For the DFT-optimized cations, the displacement is 1.430 Å (Figure 8), and decreases only slightly to 1.370 Å under the inversion option (Figure 9). The conformational differences are, thus, in the direction expected from a change in chirality, even though the chirality of the two molecules is the same.

Figure 6. Comparison of cation 1 (purple) and cation 2 (green) in the refined structure of halofuginone hydrobromide, with the atoms of the quinazoline ring system superimposed (Mercury structure overlay). The rms Cartesian displacement of the ring atoms is 0.074 Å, while that of the whole molecules is 1.773 Å. Image generated using Mercury (Macrae et al., Reference Macrae, Sovago, Cottrell, Galek, McCabe, Pidcock, Platings, Shields, Stevens, Towler and Wood2020).

Figure 7. Comparison of cation 1 (purple) and cation 2 (green) in the refined structure of halofuginone hydrobromide, after the inversion option is invoked in Mercury. The rms Cartesian displacement is 1.343 Å. Image generated using Mercury (Macrae et al., Reference Macrae, Sovago, Cottrell, Galek, McCabe, Pidcock, Platings, Shields, Stevens, Towler and Wood2020).

Figure 8. Comparison of cation 1 (orange) and cation 2 (magenta) in the VASP-optimized structure of halofuginone hydrobromide. The rms Cartesian displacement is 1.430 Å. Image generated using Mercury (Macrae et al., Reference Macrae, Sovago, Cottrell, Galek, McCabe, Pidcock, Platings, Shields, Stevens, Towler and Wood2020).

Figure 9. Comparison of cation 1 (orange) and cation 2 (magenta) in the VASP-optimized structure of halofuginone hydrobromide, after the inversion option is invoked in Mercury. The rms Cartesian displacement is 1.370 Å. Image generated using Mercury (Macrae et al., Reference Macrae, Sovago, Cottrell, Galek, McCabe, Pidcock, Platings, Shields, Stevens, Towler and Wood2020).
The remaining discussion concentrates on the DFT-optimized structure. The best view of the crystal structure is down the b-axis (Figure 10). The crystal structure consists of alternating layers (parallel to the ab-plane) of planar and nonplanar portions of the cations. The average planes of the quinazoline ring systems are similar, at (7–18) for cation 1 and (4–14) for cation 2. The principal hydrogen bonds occur in the layers (parallel to the ab-plane) of piperidine rings.
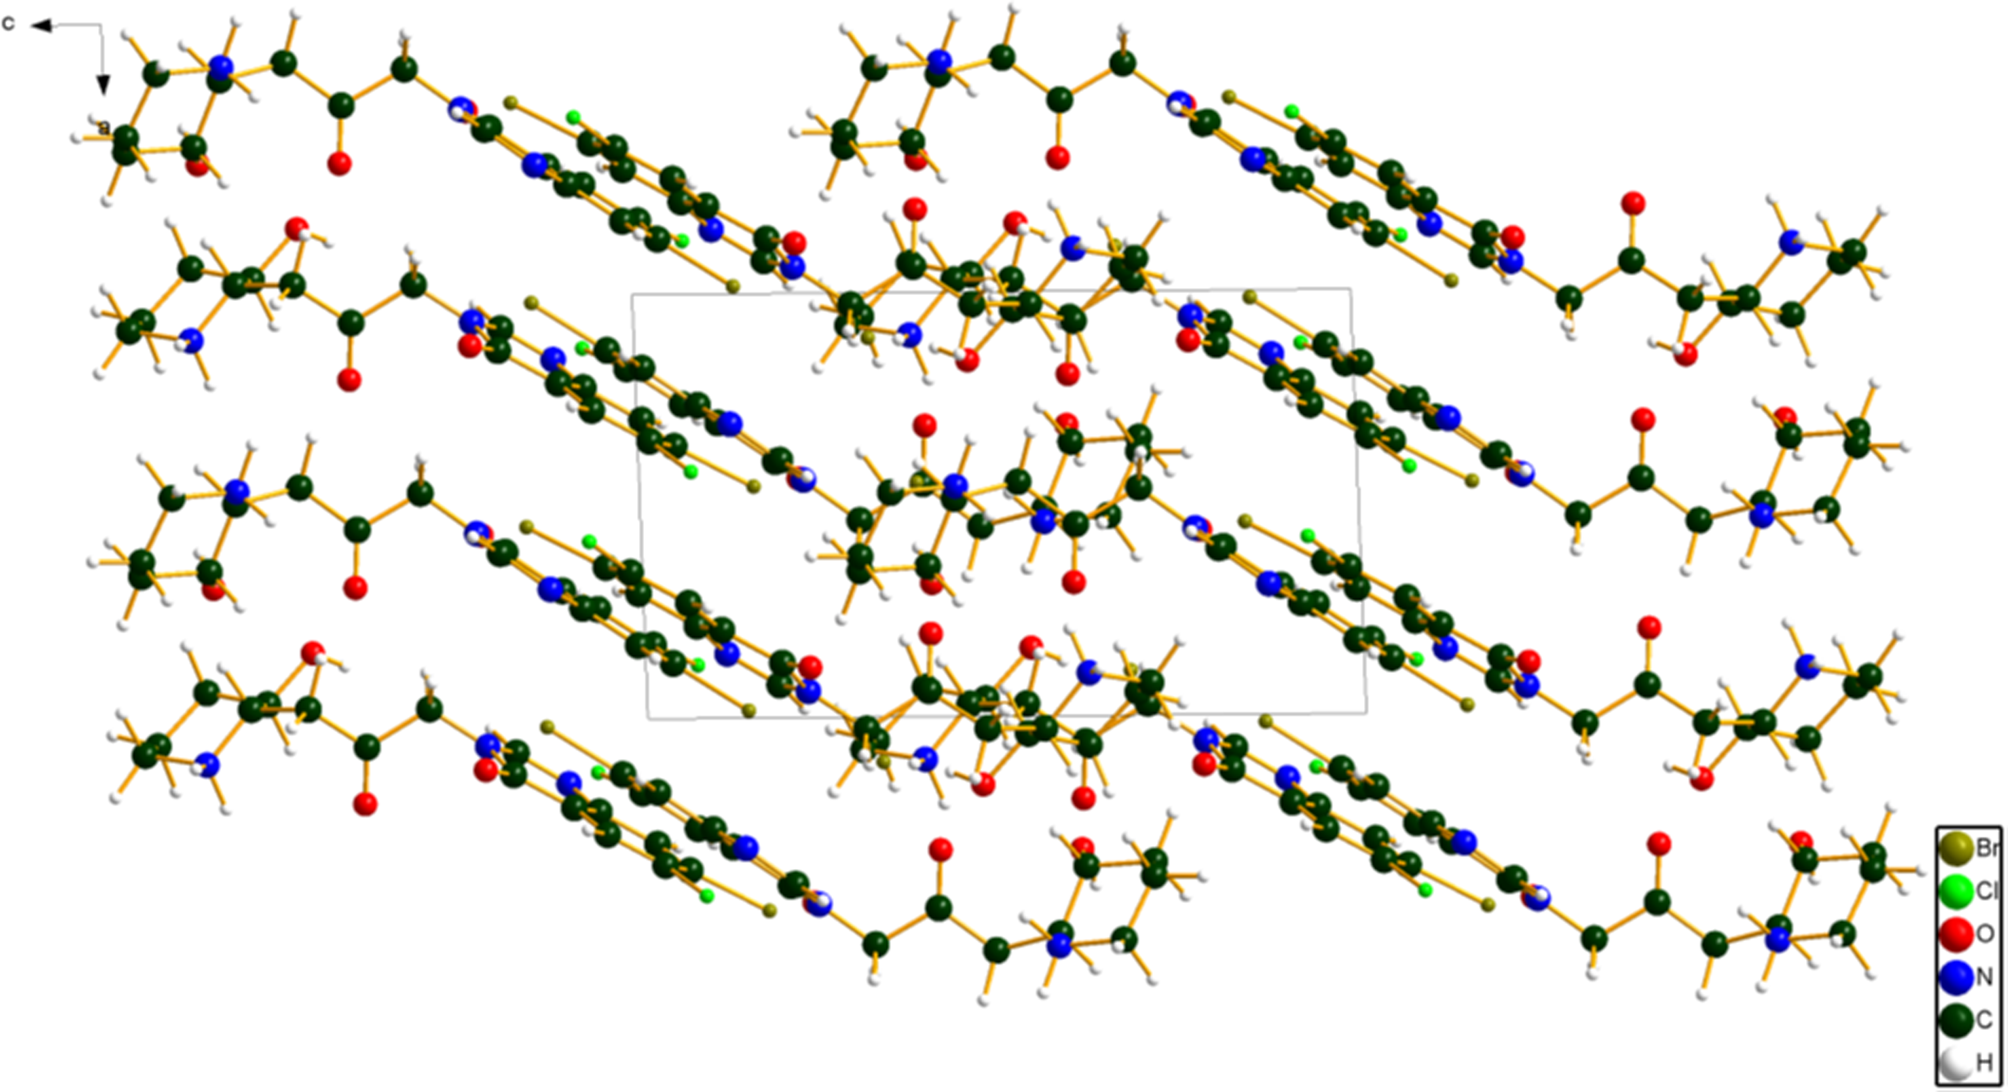
Figure 10. The crystal structure of halofuginone hydrobromide, viewed down the b-axis. Image generated using Diamond (Crystal Impact, Reference Putz and Brandenburg2022).
All of the bond distances and bond angles fall within the normal ranges indicated by a Mercury/Mogul Geometry check (Macrae et al., Reference Macrae, Sovago, Cottrell, Galek, McCabe, Pidcock, Platings, Shields, Stevens, Towler and Wood2020). The torsion angles involving rotation about the C50–C55 bond in cation 2 are flagged as unusual. They lie on the tail of a gauche part of a bimodal distribution of similar torsion angles. These torsion angles, which indicate the angle of the piperidine ring with respect to the rest of the cation, seem to be slightly unusual.
Quantum chemical geometry optimization of the halofuginone cations (DFT/B3LYP/6-31G*/water) using Spartan ‘18 (Wavefunction, 2020) indicated that the observed conformation of cation 1 is 8.6 kcal mol−1 higher in energy than the local minimum, and cation 2 is 8.5 kcal mol−1 higher in energy. The local minimum of cation 1 is 0.5 kcal mol−1 lower in energy than cation 2, within the expected error limits of such calculations, so the conformations should be considered equivalent in energy. The conformational differences are spread throughout the cations. Cation 1 is essentially in the global minimum-energy conformation. The different (but similar in energy) conformation of cation 2 shows that the cation is fairly flexible, and that intermolecular interactions are important in determining the solid-state conformations.
Analysis of the contributions to the total crystal energy of the structure using the Forcite module of Materials Studio (Dassault, 2021) suggests that the intramolecular deformation energy terms are small, but that angle deformation terms are the largest. The force-field-optimized structure reproduces the VASP-optimized structure (rms Cartesian displacements = 0.251 and 0.333 Å) better than the experimental structure (0.639 and 0.255 Å), but is closer to the experimental structure for cation 2. The intermolecular energy is dominated by electrostatic attractions, which in this force field analysis include hydrogen bonds. The hydrogen bonds are better analyzed using the results of the DFT calculation.
Hydrogen bonds are prominent in the structure (Table I). As expected, there are N–H⋯Br hydrogen bonds between the protonated piperidine nitrogen atoms H6 and H47 and the bromide anions Br83 and Br84, but only three of the four hydrogen atoms form such H-bonds. The remaining H33 forms a strong N–H⋯O hydrogen bond to the hydroxyl group O44. The energy of this N–H⋯O hydrogen bond is 6.6 kcal mol−1, calculated using the correlation of Wheatley and Kaduk (Reference Wheatley and Kaduk2019). There are also O–H⋯Br hydrogen bonds between the hydroxyl groups O3 and O44 and the bromide anions. The N–H⋯Br and O–H⋯Br hydrogen bonds link the piperidine rings into a two-dimensional network parallel to the ab-plane. The methylene groups C16 and C57, and the aromatic carbon atoms C21 and C62, both form intramolecular C–H⋯O hydrogen bonds to the carbonyl groups O5 and O46. Cation 2 forms two additional C–H⋯O hydrogen bonds. The aromatic carbon atoms C22 and C63 form intermolecular C–H⋯N hydrogen bonds.
TABLE I. Hydrogen bonds (CRYSTAL17) in halofuginone hydrobromide

a Intramolecular.
The Bravais–Friedel–Donnay–Harker (Bravais, Reference Bravais1866; Friedel, Reference Friedel1907; Donnay and Harker, Reference Donnay and Harker1937) morphology suggests that we might expect platy morphology for halofuginone hydrobromide, with {001} as the major faces. A fourth-order spherical harmonic preferred orientation model was included in the refinement. The texture index was 1.020(1), indicating that preferred orientation was minor for this rotated capillary specimen. The powder pattern of halofuginone hydrobromide from this synchrotron data set has been submitted to ICDD for inclusion in the Powder Diffraction File.
IV. DEPOSITED DATA
The Crystallographic Information Framework (CIF) files containing the results of the Rietveld refinement (including the raw data) and the DFT geometry optimization were deposited with the ICDD. The data can be requested at pdj@icdd.com.
ACKNOWLEDGEMENTS
The use of the Advanced Photon Source at Argonne National Laboratory was supported by the U.S. Department of Energy, Office of Science, Office of Basic Energy Sciences, under Contract No. DE-AC02-06CH11357. This work was partially supported by the International Centre for Diffraction Data. We thank Lynn Ribaud and Saul Lapidus for their assistance in the data collection.
CONFLICT OF INTEREST
The authors have no conflicts of interest to declare.


 Open access