


In 2015, the International Diabetes Federation demonstrated that China has the highest number of adults with diabetes (109·6 million), and type 2 diabetes mellitus (T2DM) is the most common( Reference Lyons 1 ). However, many people with T2DM remain unaware of their condition for a long time because the symptoms are usually less marked than with type 1 diabetes mellitus and may take years to be recognised( Reference Li, Su and Liang 2 – Reference Xu, Wang and He 4 ). As a result, many people already have complications when they receive a diagnosis of T2DM( Reference Lyons 1 ). About 80 % of T2DM could be prevented by behaviour and lifestyle intervention( Reference Wang, Marquez and Langenbrunner 5 ). Therefore, identifying people at high risk of T2DM is indispensable for effective prevention strategies, which could help halt the inexorable increase in T2DM incidence.
Obesity is a confirmed risk factor of premature mortality( 6 , Reference Bellocco, Jia and Ye 7 ) and T2DM( Reference Haslam and James 8 ). To predict premature mortality better, Krakauer & Krakauer( Reference Krakauer and Krakauer 9 ), proposed a body shape index (ABSI) based on waist circumference (WC) adjusted for height and weight. ABSI could predict premature mortality better than traditional anthropometric measurements (BMI or WC)( Reference Krakauer and Krakauer 10 ). Recently, a prospective cohort study based on 687 urban Chinese found that ABSI was a weaker predictor of diabetes mellitus than traditional anthropometric measurements (BMI or WC), but the study participants were from a smaller urban population( Reference He and Chen 11 ). In addition, some studies concluded that excess adiposity but not excess body weight was the real culprit of T2DM( Reference Fruhbeck 12 , Reference Thibault and Pichard 13 ). To respond to the condition of unavailable body fat information in some studies, an estimation equation based on a large white population that accounted for BMI, sex and age to body fat has been developed( Reference Gomez-Ambrosi, Silva and Catalan 14 ). However, the predictive power of estimated body adiposity estimator (BAE) based on the equation for T2DM was not assessed in the Chinese population.
The current study aimed to compare the power of ABSI and BAE with traditional anthropometric measurements (BMI, WC and waist:height ratio (WHtR)) for predicting new-onset T2DM in an adult Chinese population.
Methods
Study design and participants
A total of 19 443 participants 18 to 74 years old were recruited from a rural Chinese population between July and August 2007 and July and August 2008; 16 627 (85·5 %) participants completed the follow-up between July and August 2013 and July and October 2014. A questionnaire interview was used to collect data on demographic characteristics (sex and age), behavioural variables (smoking and drinking), physical activity and medical and family history by interviewing all participants face to face at baseline and follow-up. Among the 16 627 participants who completed the follow-up, we excluded people who died (n 881), had T2DM (n 1260) and type 1 diabetes mellitus (n 11), lacked fasting plasma glucose (FPG) values (n 10) and anthropometric measurements (n 4), had BMI <18·5 kg/m2 (n 446) at baseline; and lacked FPG values (n 2328) at follow-up. Ultimately, 11 687 participants were included in the analysis.
Covariate measurement and definition
A smoker was defined as having smoked 100 or more cigarettes during the lifetime( Reference Tomar and Asma 15 ). An alcohol drinker was defined as having consumed alcohol twelve or more times in the past year( Reference Gu, He and Duan 16 ). Physical activity level was classified as high, moderate and low according to the International Physical Activity Questionnaire score( Reference Craig, Marshall and Sjostrom 17 ). Body weight and height were measured twice by use of a metric scale and a vertical height scale to the nearest 0·1 kg and 0·1 cm, respectively, in participants wearing light indoor clothing without shoes. BMI was calculated as weight (kg) divided by height (m) squared. WC was analysed as the mean of two measurements to the nearest 0·1 cm by using a metric measurement tape at the 1-cm surface level above the navel. WHtR was calculated as WC (m) divided by height (m). ABSI was defined as WC/((BMI)2/3×(height)1/2)( Reference Krakauer and Krakauer 9 ). BAE was defined as follows: BAE=–44·988+(0·503×age)+(10·689×sex)+(3·172×BMI)−(0·026×(BMI)2)+(0·181×BMI×sex)−(0·02×BMI×age)−(0·005×(BMI)2×sex)+(0·00021×(BMI)2×age) where male=0 and female=1, and age is in years( Reference Gomez-Ambrosi, Silva and Catalan 14 ). An electronic sphygmomanometer (HEM-770A; Fuzzy) was used to measure systolic blood pressure (SBP) and diastolic blood pressure (DBP) three times on the right arm of participants who were in a seated position after a 5-min rest and at 30-s intervals.
An overnight fasting venous blood sample was collected from each participant. Levels of lipids (total cholesterol (TC), TAG and HDL-cholesterol) and FPG were measured by using a HITACHI 7060 automatic biochemical analyzer. All interviews and examinations were performed by trained and dedicated study staff. This study was conducted according to the guidelines laid down in the Declaration of Helsinki and all procedures involving human subjects were approved by the Medical Ethics Committee of Shenzhen University Health Sciences Center. Written informed consent was obtained from all participants.
Definition of type 2 diabetes mellitus
A diagnosis of T2DM was considered with a history of diabetes mellitus, currently using antidiabetic agents, or FPG level ≥7·0 mmol/l( 18 ). We excluded participants with type 1 diabetes mellitus, gestational diabetes and other diabetes types. The time of onset of T2DM was collected by dedicated survey staff who used a specially designed questionnaire with face-to-face interviews for participants. Person-years of follow-up were computed as the date of onset of T2DM or follow-up minus the date of baseline examination.
Statistical analysis
The Shapiro–Wilk test was used to evaluate normality of continuous variables. Data are presented as medians and interquartile ranges for continuous variables according to result of normality test and numbers and percentages for categorical variables. Wilcoxon’s rank sum and χ 2 tests were used to evaluate differences in continuous and categorical variables, respectively. The trend of T2DM incidence with increased ABSI, BAE, WC, BMI and WHtR was assessed by Cochran–Mantel–Haenzel test. Cox proportional-hazards regression analysis was used to estimate the risk of T2DM by anthropometric measurements (ABSI, WC, BMI and WHtR) and BAE adjusted for sex, age, smoking, alcohol consumption, physical activity, SBP and DBP, and TC, TAG and HDL-cholesterol levels. Simultaneously, the receiver operating characteristic (ROC) curve was used to identify cut-off values that balanced both sensitivity and specificity well for the anthropometric measurement in terms of the specific T2DM risk factor, with respective sensitivity and specificity values reported. All statistical analyses involved use of SAS 9.1 (SAS Institute), and a two-tailed P<0·05 was considered statistically significant. Software of Sample Size Calculations (Mark Woodward, The George Institute International Health; Lesley Francis, MIS Consultants Pty Ltd) was used estimated sample size. Statistical power was considered typically 80 %, two-sided significance level typically 0·05, T2DM incidence of unexposed group 0·5 %, relative risk 2·0 and exposed/unexposed 0·3. These parameters were set to criteria from previous studies (incidence of unexposed group: >0·5 %; relative risk: >2)( Reference Zhang, Wang and Liu 19 , Reference Ren, Liu and Sun 20 ) and overweight: 30·1 % (‘Report on nutrition and non-communicated diseases in Chinese population (2015)’( Reference Gu 21 ). Calculated result demonstrated the study need 12 136 participants. Therefore, sample size was adequate in the study.
Results
The baseline characteristics of study participants with and without T2DM during follow-up are in Table 1. During a median of 6·01 years (interquartile range: 5·89–6·06) of follow-up, we recorded 749 new-onset T2DM. Data for age, BMI, WC, WHtR, ABSI, BAE, SBP, DBP and TC, TAG and FPG levels were higher and HDL-cholesterol level was lower with T2DM than non-T2DM (P<0·0001); the groups did not differ by sex, smoking, alcohol consumption or physical activity (P>0·05).
Table 1 Baseline characteristics of study participants with and without type 2 diabetes mellitus (T2DM) during follow-up (Medians and interquartile ranges (IQR); numbers and percentages)
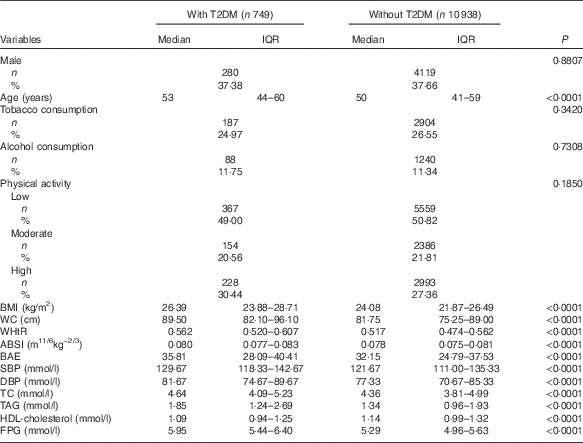
WC, waist circumference; WHtR, waist:height ratio; ABSI, a body shape index; BAE, body adiposity estimator; SBP, systolic blood pressure; DBP, diastolic blood pressure; TC, total cholesterol; FPG, fasting plasma glucose.
Fig. 1 summarises the incidence and hazard ratios and 95 % CI for T2DM by ABSI, BAE, BMI, WC and WHtR quintiles and continued value. T2DM incidence was increased with increasing level of ABSI, BAE, BMI, WC and WHtR (P trend<0·0001). As compared with the first quintile, with the second to fifth quintiles, the risk of T2DM increased for ABSI (1·53; 95 % CI 1·16, 2·03; 1·85; 95 % CI 1·38, 2·47; 2·67; 95 % CI 2·05, 3·48 and 3·55; 95 % CI 2·72, 4·64; P trend<0·0001); BAE (1·97; 95 % CI 1·50, 2·59; 1·53; 95 % CI 1·15, 2·05; 2·36; 95 % CI 1·81, 3·09 and 4·44; 95 % CI 3·46, 5·71; P trend<0·0001); BMI (1·59; 95 % CI 1·15, 2·21; 2·08; 95 % CI 1·52, 2·84; 3·51; 95 % CI 2·62, 4·69 and 5·95; 95 % CI 4·51, 7·86; P trend<0·0001); WC (1·78; 95 % CI 1·26, 2·53; 2·19; 95 % CI 1·57, 3·07; 4·03; 95 % CI 2·95, 5·51 and 7·00; 95 % CI 5·19, 9·43; P trend<0·0001); and WHtR (1·63; 95 % CI 1·14, 2·31; 2·67; 95 % CI 1·93, 3·71; 4·27; 95 % CI 3·14, 5·82 and 7·24; 95 % CI 5·38, 9·75; P trend<0·0001). After adjustment for sex, age, smoking, alcohol consumption, physical activity, SBP, DBP and TC, TAG and HDL-cholesterol levels, the association was consistent across the second to fifth quintiles for ABSI (1·27; 95 % CI 0·95, 1·69; 1·35; 95 % CI 1·00, 1·82; 1·75; 95 % CI 1·33, 2·32 and 1·87; 95 % CI 1·40, 2·49; P trend<0·0001); BAE (1·82; 95 % CI 1·38, 2·41; 1·93; 95 % CI 1·38, 2·68; 2·73; 95 % CI 1·94, 3·84 and 4·18; 95 % CI 2·98, 5·87; P trend<0·0001); BMI (1·42; 95 % CI 1·03, 1·97; 1·62; 95 % CI 1·18, 2·23; 2·59; 95 % CI 1·92, 3·50 and 3·90; 95 % CI 2·90, 5·26; P trend<0·0001); WC (1·53; 95 % CI 1·08, 2·17; 1·66; 95 % CI 1·18, 2·33; 2·72; 95 % CI 1·97, 3·76 and 4·09; 95 % CI 2·97, 5·62; P trend<0·0001); and WHtR (1·40; 95 % CI 0·98, 1·99; 2·06; 95 % CI 1·47, 2·88; 2·9095 % CI 95 % CI 2·10, 4·01 and 4·22; 95 % CI 3·05, 5·85; P trend<0·0001). As continuous variables for ABSI, BAE, BMI, WC and WHtR, the risk of T2DM also increased in unadjusted and adjusted models (P<0·0001).
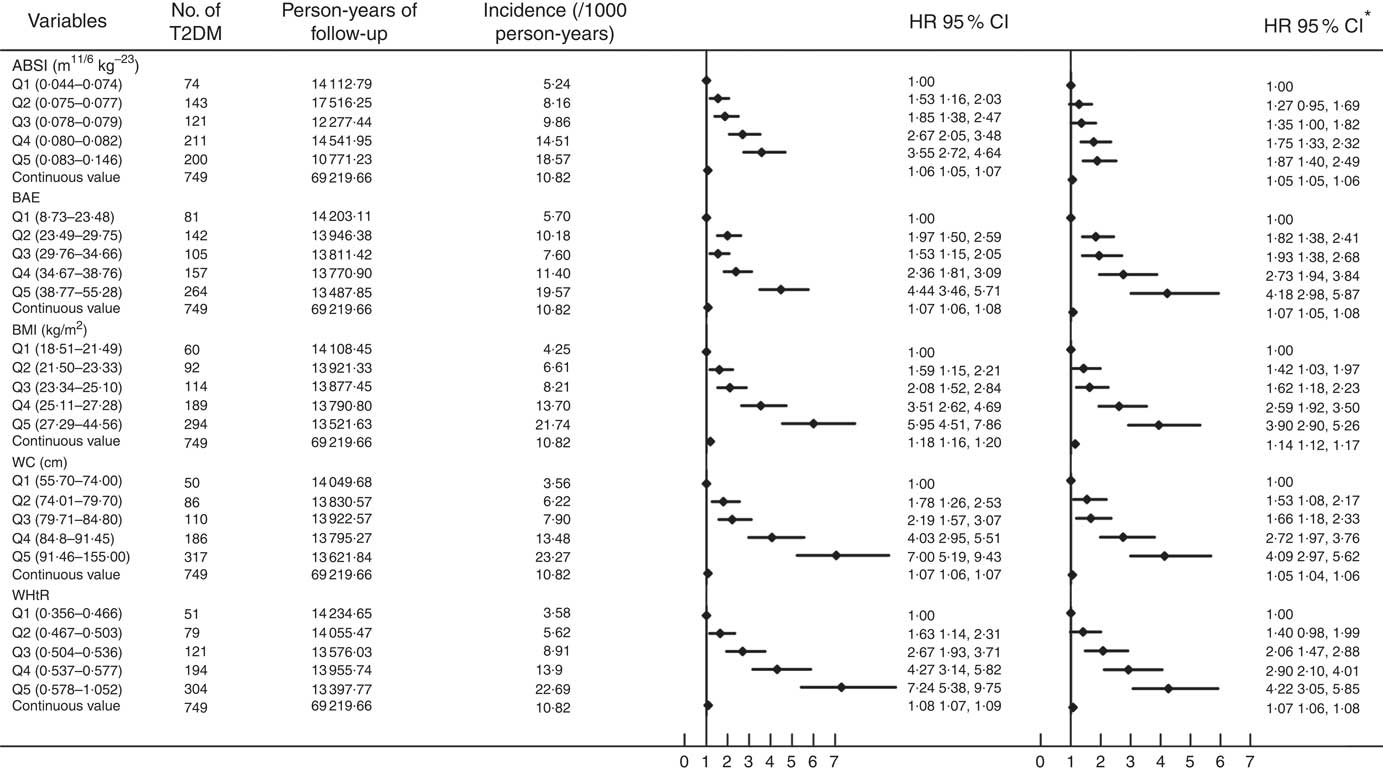
Fig. 1 Cox proportional-hazards analysis of predictors of type 2 diabetes mellitus (T2DM) incidence. ABSI, a body shape index; BAE, body adiposity estimator; HR, hazard ratio; WC, waist circumference; WHtR, waist:height ratio. *Adjusted for baseline sex, age, smoking, alcohol consumption, physical activity, systolic and diastolic blood pressure and total cholesterol, TAG and HDL-cholesterol levels.
Baseline ABSI, BAE, BMI, WC and WHtR had moderate predictive ability for T2DM ( AUC (ROC)), sensitivity and specificity but high negative predictive value and low positive predictive value (Fig. 2 and Table 2). Specificity for ABSI and BAE for predicting T2DM was higher than traditional anthropometric measurements (BMI, WC and WHtR), but sensitivity, positive and negative predictive values, and AUC were lower (Fig. 2 and Table 2).
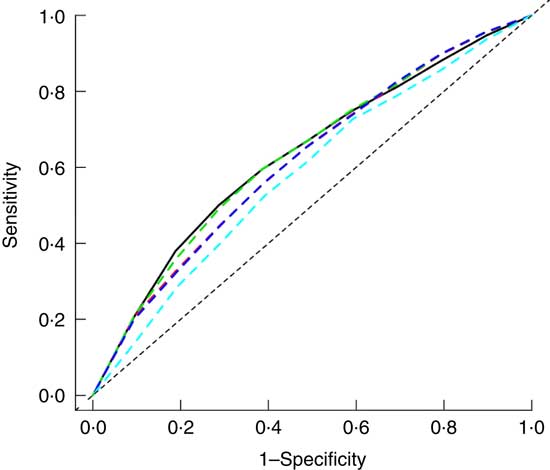
Fig. 2 Adjusted receiver operating characteristic (ROC) curves for baseline factors for identifying type 2 diabetes mellitus (T2DM). ![]() , Adjusted waist circumference (AUC 0·632);
, Adjusted waist circumference (AUC 0·632); ![]() , adjusted BMI (AUC 0·618);
, adjusted BMI (AUC 0·618); ![]() , adjusted waist:height ratio (AUC 0·633);
, adjusted waist:height ratio (AUC 0·633); ![]() , adjusted body adiposity estimator (AUC 0·618);
, adjusted body adiposity estimator (AUC 0·618); ![]() , adjusted a body shape index (AUC 0·584). Adjusted for baseline sex, age, smoking, alcohol consumption, physical activity, systolic and diastolic blood pressure and total cholesterol, TAG and HDL-cholesterol levels.
, adjusted a body shape index (AUC 0·584). Adjusted for baseline sex, age, smoking, alcohol consumption, physical activity, systolic and diastolic blood pressure and total cholesterol, TAG and HDL-cholesterol levels.
Table 2 Power of baseline factors for predicting type 2 diabetes mellitus incidence (AUC (receiver operating characteristic) and 95 % confidence intervals)
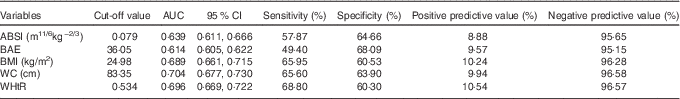
ABSI, a body shape index; BAE, body adiposity estimator; WC, waist circumstance; WHtR, waist:height ratio.
Discussion
We found risk of T2DM increased with elevated ABSI and BAE. However, for predicting development of T2DM, the ability of ABSI and BAE did not differ from traditional anthropometric measurements (BMI, WC and WHtR).
Like traditional anthropometric measures (BMI, WC and WHtR)( Reference Su, Ma and Rao 22 – Reference Xu, Qi and Dahl 30 ), elevated ABSI was associated with increased T2DM incidence. To our knowledge, only three cohort studies have evaluated the association of ABSI and diabetes mellitus( Reference He and Chen 11 , Reference Fujita, Sato and Nagashima 31 , Reference Hardy, Stallings and Garvin 32 ). One 15-year prospective cohort study of urban Chinese (n 687) found ABSI independently associated with development of diabetes mellitus( Reference He and Chen 11 ). The 4-year retrospective cohort study of a Japanese population (n 37 581) demonstrated elevated ABSI as an independent risk factor of diabetes mellitus but not a better predictor than BMI and WC( Reference Fujita, Sato and Nagashima 31 ). Recently, the Atherosclerosis Risk in Communities (ARIC) study, with data for more than 11 years of follow-up, demonstrated that ABSI had a lower association and was an inferior discriminator of incident T2DM among all race–sex groups in a US population( Reference Hardy, Stallings and Garvin 32 ). A cross-sectional study based on 9555 Iranian adults suggested increased ABSI as an independent risk factor of abnormal glucose homoeostasis but not a better predictor than BMI, WHtR and BAE( Reference Haghighatdoost, Sarrafzadegan and Mohammadifard 33 ). Previous studies indicated higher WC and BMI as an independent risk factor of T2DM( Reference Su, Ma and Rao 22 , Reference Qiao and Nyamdorj 34 ). ABSI is based on WC adjusted for height and weight. Therefore, high ABSI would be associated with increased T2DM incidence. A multicultural community-health assessment trial in Canada based on computed tomography demonstrated different amounts of abdominal adipose tissue among ethnic groups( Reference Lear, Humphries and Kohli 35 ). Development of ABSI, combining WC (mainly measurement of abdominal adipose tissue), height and weight, was based on the adult American( Reference Krakauer and Krakauer 10 ). Hence, ethnic differences might explain the weak predictive ability of ABSI for T2DM incidence.
We found general obesity (elevated BMI level) and central obesity (elevated WC) derived from excess adipose tissue as independent risk factors of T2DM incidence( Reference Lear, Humphries and Kohli 35 ), which is the best explanation for the relationship of increased BAE and T2DM incidence. Although the risk of T2DM did not differ with high BAE, WC or WHtR, BAE was not a better predictor of T2DM than WC and WHtR in our study. The predictive power of BAE for T2DM might be affected by some confounding factors, whereas high BAE is an independent risk factor of T2DM. Because BAE is derived from a study of 6510 white participants( Reference Gomez-Ambrosi, Silva and Catalan 14 ), different ethnicity might be another explanation. Because of no additional study exploring BAE, WC and WHtR for predicting T2DM, further studies are still needed to confirm the possible relationship.
This analysis has several strengths, including its novel evaluation, relatively large sample size, community-based participants and face-to-face interviews. However, all participants were from rural areas, which might decrease the representativeness. We used only FPG to detect undiagnosed T2DM in this study, which may underestimate the incidence of T2DM( 36 ). Many factors affect T2DM incidence. Because of lack of information on some factors, their potential effect on T2DM may not be fully eliminated, although we adjusted for multi-covariates by Cox regression analysis. Considering a 14·5 % lost to follow-up, statistical analysis was performed on baseline demographic characteristics by response status. The results showed significant differences between responding and non-responding participants for age but not sex, which might suggest follow-up bias. Therefore, caution is warranted when interpreting and comparing the findings.
In conclusion, the risk of T2DM may be increased with elevated ABSI and BAE, but these factors are not better predictors of T2DM than BMI, WC or WHtR in rural Chinese population. Our findings may facilitate the development and promotion of preventive strategies aimed at obesity to reduce T2DM incidence.
Acknowledgements
The investigators are grateful to the dedicated participants and all research staff of the study.
This work was supported by the National Natural Science Foundation of China (grant nos 81373074, 81402752, 81673260); and the Science and Technology Development Foundation of Shenzhen (grant no. JCYJ20160307155707264).
C. H. and D. H.: design of the study. C. H., Y. L., X. S., X. L., L. Z., Y. R., B. W., J. Z. and Y. Z.: researched and analysed the data. C. H.: wrote the manuscript. D. Z., X. L., M. Z. and D. H.: contributed to the discussion and reviewed/edited the manuscript. All authors read and approved the final manuscript.
The authors declare that there are no conflicts of interest.


