


Obesity is a serious public health challenge. When energy consumption is balanced with expenditure, body weight tends to remain stable. However, due to a variety of factors, energy intake sometimes exceeds expenditure and weight gain results. A critical issue associated with energy balance and obesity is the interplay between energy expenditure and energy intake. Although studied for decades, much remains unknown about this complex relationship and new models continue to be constructed( Reference Blundell, Caudwell and Gibbons 1 ).
Several investigations are considered classics and provide valuable insights about the effect of physical activity (PA) and energy expenditure on energy intake. In 1955, Edholm et al.( Reference Edholm, Fletcher and Widdowson 2 ) conducted a 2-week energy balance study using twelve cadets. They concluded that there is no correlation between expenditure and intake on the same day, but there is a significant relationship between daily expenditure and energy intake 2 d later.
During the following year, 1956, Mayer et al.( Reference Mayer, Roy and Mitra 3 ) studied 213 mill workers in West Bengal. The physical work required of the labourers varied widely. Mayer et al. determined that energy intake increased with physical work, except in the extremes. Consequently, Mayer is often credited with the view that increases in energy expenditure are met with increases in energy intake over time.
In 1961, Durnin( Reference Durnin 4 ) declared that men and women do not compensate for increased energy expenditure by eating more the same day, the next day or a predictable number of days in the future. Durnin concluded from several of his studies viewed collectively that the mechanism by which appetite is satisfied is not adjusted to energy expenditure in the short term.
In another classic study, Edholm et al.( Reference Edholm, Adam and Healy 5 ) tracked energy expenditure and food intake in army recruits. The authors stated, ‘There appears to be no detectable pattern of relationship between expenditures and the intakes during the same and following days’. However, Edholm acknowledged that total energy intake and expenditure are related significantly over weeks of observation.
In an exhaustive paper on the mechanisms of energy compensation, de Castro( Reference De Castro 6 ) described a study similar to the present investigation. Expenditure was assessed using triaxial accelerometers and energy consumption was estimated using 7 d food diaries. According to de Castro, total daily activity was related to total intake on the same day and for the subsequent 4 d, but none of the associations were statistically significant. He concluded that the effect of expenditure on intake is small, but persistent.
Using the doubly labelled water method to assess energy expenditure, research by Whybrow et al.( Reference Whybrow, Hughes and Ritz 7 ) indicated that individuals tend to compensate for about 30 % of an exercise-induced energy deficit. However, they concluded that compensation varies substantially among individuals. Taking the opposite approach, Stubbs et al.( Reference Stubbs, Hughes and Johnstone 8 ) showed that reducing PA can also significantly influence energy balance. They found that changing to a sedentary lifestyle does not induce a compensatory reduction in energy intake and therefore leads to a significant positive energy balance.
Several researchers have examined the connection between energy expenditure and intake indirectly through exercise-based weight-loss studies. Although energy compensation was not the focus of these studies, their findings have benefited public health strategies associated with the management of obesity. After reviewing the literature concerning the effect of exercise on weight change, Wing( Reference Wing 9 ) stated, ‘These studies raise several key questions for discussion. Most important is the question of why the effect of exercise on weight loss is so modest’ (p. S549). Wing concluded that individuals apparently compensate partially for the energy expended in exercise by eating more. Likewise, the 2001 American College of Sports Medicine Position Stand( Reference Jakicic, Clark and Coleman 10 ) reads, ‘… the failure of exercise to produce a magnitude of weight loss similar to diet in studies of free-living individuals may be a result of individuals compensating by increasing energy intake’ (p. 2148). Similarly, Donnelly and King( Reference Donnelly and Smith 11 ) concluded, ‘For exercise to be effective for weight loss, the real question is, “will exercise provide a negative energy balance without substantial compensation from other components of the energy balance equation?”’ (p. 172).
Research from the University of Leeds supports this concept. Studies by Blundell, King, Caudwell, Hopkins and others have consistently shown that there is wide variability in the effects of exercise on weight change because of compensatory eating behaviour( Reference Melanson, Keadle and Donnelly 12 – Reference Hopkins, King and Blundell 16 ). A number of other investigations indicate that energy intake increases following exercise( Reference Finlayson, Bryant and Blundell 17 – Reference Verger, Lanteaume and Louis-Sylvestre 20 ). However, results have not been consistent. Some researchers have noted no change in energy intake( Reference Hubert, King and Blundell 21 – Reference Vatansever-Ozen, Tiryaki-Sonmez and Bugdayci 27 ) or a reduction in consumption( Reference Westerterp-Plantenga, Verwegen and Ijedema 28 ). These discrepancies may be partly a function of differences in exercise intensity( Reference Pomerleau, Imbeault and Parker 19 ), obesity( Reference Kissileff, Pi-Sunyer and Segal 29 ), gender( Reference Stubbs, Sepp and Hughes 30 , Reference Stubbs, Sepp and Hughes 31 ) or other factors( Reference Finlayson, Bryant and Blundell 17 , Reference Hill, Melby and Johnson 32 , Reference Unick, Michael and Jakicic 33 ). In 2014, Cadieux et al.( Reference Cadieux, McNeil and Lapierre 34 ) concluded, ‘… more studies are needed to investigate (non-exercise activity) under free-living conditions in different populations’ (p. 117).
In summary, energy intake seems to adjust, at least partially, to physical work over a week or more. The effect of expenditure on short-term energy consumption, however, is less obvious and more inconsistent. Clearly, more research is needed regarding the timing of adjustments associated with PA, energy expenditure and intake. Hence, the purpose of the present investigation was to evaluate the general relationship between objectively measured PA and energy intake in 300 free-living, middle-aged women over seven consecutive days. Another objective was to ascertain the timing of energy adjustments. Specifically, to determine the extent to which measured PA levels predict energy intake on the same day, the next day and other days later in the week.
Methods
Design
A prospective design covering seven consecutive days was employed to examine the relationship between objectively measured PA and energy consumption. Additionally, day-to-day activity was assessed to determine if more or less activity on a given day was predictive of energy intake on the same day or subsequent days of the week.
Sample
Participants were blinded regarding the purpose of the study and were recruited using newspaper advertisements, flyers and emails distributed across approximately twenty cities in two metropolitan areas of the Mountain West, USA. Telephone interviews were conducted to screen applicants. Specifically, each qualified participant was required to be: (i) apparently healthy, evaluated using a Physical Activity Readiness Questionnaire (PAR-Q); (ii) a non-smoker; (iii) not pregnant; (iv) English speaking; (v) 35–49 years old; and (vi) female. Of approximately 400 women who were interviewed via telephone, 315 met the inclusion criteria and reported for data collection. Before data collection, each participant signed an Institutional Review Board informed consent.
Procedure
Each woman made two visits to the university lab approximately 8 d apart. At the first appointment, height and weight were measured in bare feet with participants wearing a standard, one-piece swimsuit. Participants were issued a digital food scale (Ohaus 2000, Florham Park, NJ, USA), 7 d dietary records and an ActiGraph 7164 accelerometer, all of which were discussed in detail so that participants knew how to properly weigh and log their food intake and correctly wear the activity monitor. Weighing and recording of dietary intake and continuous wear of the accelerometer occurred simultaneously during the next seven consecutive days. At the second visit, the accelerometer and dietary data were reviewed by a trained research assistant. Participants were weighed again in the swimsuit so the two body weights could be averaged, providing a more reliable index of body weight.
Exposure
Physical activity
Using an epidemiological framework, PA was the exposure variable of the present investigation. ActiGraph accelerometers, model 7164, provided a means to objectively assess PA during the same seven consecutive days that dietary intake was measured. Instructions regarding how to appropriately use the accelerometer were provided during the initial appointment. The accelerometer was worn constantly throughout the day and night, with the exception of bathing or swimming. The accelerometer was attached to a nylon belt that was worn around the participant’s waist and positioned over the left hip.
The ActiGraph is the most widely used accelerometer for field-based research and has been validated in many studies( Reference Bassett, Ainsworth and Swartz 35 – Reference Liu, Li and Song 37 ). Research on this accelerometer in adults indicates that the device provides a close representation of PA levels in comparison to doubly labelled water( Reference Liu, Li and Song 37 ). Additionally, a comparison of four accelerometers, including the one used in the present study, was performed by Bassett et al.( Reference Bassett, Ainsworth and Swartz 35 ). The only accelerometer not differing significantly from a portable metabolic system was the ActiGraph device.
Non-wear time was defined as a 10 min string of consecutive zeros. Participants were required to wear the monitor for at least 12 h/d to be considered a valid wear-day. Participants with fewer than 12 h of wear time for any of the 7 d were required to redo the PA and diet recordings. Mean wear time from 07.00 to 22.00 hours (a 15 h period) across the 7 d was 13·9 h (93 % wear-time compliance).
In the present study, PA was indexed using the sum of all activity counts acquired over the 7 d. Concurrent validity for this measure has been shown in several investigations, linking total PA counts to television viewing habits( Reference Tucker and Tucker 38 ), body fat percentage( Reference Tucker and Peterson 39 ), hip bone mineral density( Reference Nokes and Tucker 40 ), C-reactive protein( Reference LeCheminant, Tucker and Russell 41 ), abdominal circumference( Reference Davidson, Tucker and Peterson 42 ) and fibre consumption( Reference Breneman and Tucker 43 ).
Outcome
Energy intake
From an epidemiological perspective, total energy intake was the outcome variable of the present study. Daily energy consumption was measured using 7 d weighed food records. A key benefit of evaluating diet over seven consecutive days is that the assessment period includes both weekdays and weekends. Moreover, food records eliminate the need for participants to remember what they ate because foods are recorded as they are consumed. Additionally, weighing all foods and beverages minimizes the error associated with estimating serving sizes( Reference Willett 44 ).
Because of the potential problem of eating less while recording food intake, participants were individually educated. Plastic food models were used to assist in the training. Written instructions for participants to take home were also provided. Participants were also asked to continue with their typical PA levels. A follow-up telephone call during the week helped to emphasize the importance of eating normally and recording all foods consumed.
All food and beverages, including alcohol, were weighed in grams using an Ohaus 2000 electronic scale (Florham Park, NJ, USA) and recorded along with a description of the food, the day of the week and the date. Diet logs were analysed by a registered dietitian using ESHA Research software (Salem, OR, USA).
Evidence supporting the use of 7 d weighed food records to assess energy intake and diet in the present sample is plentiful. For example, total energy intake was significantly correlated with body mass (r=0·35, P<0·0001), as expected. Additionally, active women consumed more energy than less active women, independent of age and body mass (r=0·22, P<0·0001). Moreover, as shown in previous investigations, diet derived from the 7 d weighed food records is predictive of differences in body fat and BMI( Reference Tucker and Thomas 45 , Reference Tucker, Tucker and Bailey 46 ), weight gain( Reference Tucker, Tucker and Bailey 47 ) and insulin resistance( Reference Tucker, LeCheminant and Bailey 48 , Reference Tucker, Erickson and LeCheminant 49 ) in this cohort of women.
A common concern about 7 d weighed food records is that individuals will eat less and/or under-report their food intake. In the present study, it appears that the precautions employed to minimize under-reporting were successful. Mean energy intake for the sample was 8623 (sd 1335) kJ/d (2060 (sd 319) kcal/d), which is higher than the average intake for women 40–59 years old (mean 7652 kJ/d (1828 kcal/d)) reported for a national sample of adult women in the National Health and Nutrition Examination Survey( Reference Wright, Wang and Kennedy-Stephenson 50 ).
Mean RMR for the present sample was 5706 (sd 444) kJ/d (1363 (sd 106) kcal/d), estimated using Ravussin’s formula( Reference Ravussin, Lillioja and Anderson 51 ). Using a PAL (PA level) of 1·5 and an RMR of 5706 kJ/d (1363 kcal/d), total energy expenditure for this sample was estimated to be 8559 kJ/d (5706×1·5=8559; 2044 kcal/d), a difference of only 64 kJ/d (15 kcal/d) compared with the actual energy intake derived from the 7 d food records (P=0·4172). A PAL of 1·5 represents a ‘low active’ lifestyle according to the Institute of Medicine( 52 ).
Covariates
Differences in age, body mass and day of the week were treated as potential confounding variables and were controlled statistically in the present study. Alcohol use was also controlled statistically, but because it had no effect on the relationship between PA and energy intake, it was dropped as a covariate.
Body mass
Resting energy expenditure and total energy expenditure are highly related to body size( Reference Thompson and Gordon 53 ). In short, the larger a person is, the higher the energy expenditure. Hence, body mass was used as a covariate so that differences in body size would not influence the results. Mass was used instead of BMI because a person can have a relatively high BMI and a relatively small mass, or vice versa. Body mass was assessed on the first and second visits, 1 week apart, with participants wearing a lab-issued, one-piece swimsuit and bare feet. Each participant was measured on an electrical scale (Tanita, Tokyo, Japan) to the nearest 0·05 kg. Calibration of the scale occurred daily. Participants refrained from eating for 3 h before their appointment and were asked to use the restroom before being measured. Test–retest reliability using all participants with complete repositioning showed an intraclass correlation of greater than 0·999 (P<0·0001).
Day of the week
Research shows that time spent sitting and engaging in various physical activities differs across days of the week( Reference van Uffelen, Watson and Dobson 54 ). Hence, day of the week was controlled statistically in the present investigation.
Statistical methods
A power analysis was conducted using the PASS 6.0 statistical software (NCSS, Kaysville, UT, USA) to identify the number of subjects needed to detect a weak correlation (R 2=0·03) between activity counts and energy intake using multiple regression with α set at 0·05. The analysis showed that 255 subjects were necessary to achieve 0·80 power. Hence, the sample size of the present study (n 300) was excellent for the needs of the investigation.
Regression analysis using the GLM (general linear model) procedure was employed to determine the relationship between PA counts and energy intake, both treated as continuous variables. Partial correlation was used to determine the extent to which PA on a given day was predictive of energy intake, after controlling for differences in age, body mass and day of the week. Shared variance, indexed using R 2, was reported for each model, showing the amount of variance in the outcome variable, energy intake, accounted for by differences in the exposure variable, PA, individually and also when combined with the covariates. Additionally, to assist with interpretation of the weekly results, activity counts were divided into quartiles and the middle two categories were combined, forming three PA groups: Low (n 75), Moderate (n 150) and High (n 75). Because activity on a given day tends to be related to activity on other days and to weekly activity, multicollinearity was a potential threat. As multicollinearity increases, regression model coefficients become unstable and the standard errors of the coefficients become inflated. Hence, the VIF (variance inflation factor) option in SAS was used to measure the degree of multicollinearity in pertinent regression models. The value of α was set at the 0·05 level and the statistical software package SAS version 9.4 was utilized for all of the analyses.
Results
Table 1 summarizes the descriptive statistics of the women who participated in the study. On average, the women had 2764109 (sd 861954) activity counts for the 7 d of monitoring and their mean energy intake was 8623 (sd 1335) kJ/d (2060 (sd 319) kcal/d). Most of the women were white, non-Hispanic (95 %), employed part- or full-time (60 %), and married (81 %). Approximately 31 % reported having some college education. Mean BMI was 23·7 kg/m2 and approximately 30 % of the sample was overweight or obese.
Table 1 Descriptive statistics of the participants: middle-aged women (n 300), aged 35–49 years, from twenty cities in two metropolitan areas of the Mountain West, USA
Min., minimum (lowest value within the sample); P25, 25th percentile; P75, 75th percentile; max., maximum (highest value within the sample).
* Weekly activity counts are divided by 1000 to make the values more manageable.
† Total energy (kJ/d) represents the daily mean total across the 7 d of monitoring.
In the present sample, physically active women (top quartile) accumulated approximately 3·90 (sd 0·62) million activity counts over the 7 d, whereas moderately active women totalled 2·69 (sd 0·34) million counts and inactive women (bottom quartile) accumulated 1·77 (sd 0·26) million counts. Between the active and inactive women, there was a difference of 2·13 million activity counts.
Weekly physical activity and weekly energy intake
Across the 7 d of monitoring, women who engaged in higher levels of PA consumed higher levels of energy. Specially, after controlling for the covariates, for each additional 100000 activity counts per week, energy intake was 36 (se 8) kJ/d (8·5 (se 1·9) kcal/d) higher (F=19·0, P<0·0001).
As shown in Fig. 1, with participants divided into PA categories, women with Low activity (n 75) had a mean energy intake of 8364 (sd 1235) kJ/d (1998 (sd 295) kcal/d), whereas those with Moderate activity (n 150) consumed 8523 (sd 1264) kJ/d (2036 (sd 302) kcal/d) and those with High PA across the week (n 75) consumed 9079 (sd 1473) kJ/d (2169 (sd 352) kcal/d; F=6·4, P=0·0019). Women in the High activity group consumed 716 kJ (171 kcal) more per day or approximately 5023 kJ (1200 kcal) more over the week than women in the Low activity group. Controlling statistically for differences in age, body mass and day of the week slightly strengthened the overall relationship between activity and energy intake (F=7·1, P=0·0010).
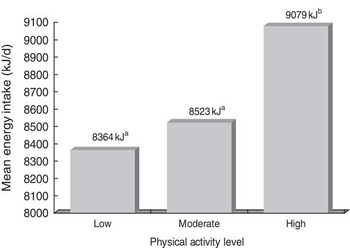
Fig. 1 Mean daily energy intake according to Low, Moderate or High physical activity level across 7 d of monitoring among middle-aged women (n 300), aged 35–49 years, from twenty cities in two metropolitan areas of the Mountain West, USA. Low physical activity (n 75), quartile 1, was defined as total activity counts <2115191 per week, with a mean of 1774054 (sd 259717) counts/week. Moderate physical activity (n 150), quartiles 2 and 3, was defined as total activity counts >2115191 and ≤3229029 per week, with a mean of 2689375 (sd 335377) counts/week. High physical activity (n 75), quartile 4, was defined as total activity counts >3229029 per week, with a mean of 3903630 (sd 622270) counts/week. F=6·4, P=0·0019. a,bMean values with unlike superscript letters were significantly different (P<0·05)
Same-day prediction
After controlling statistically for differences in age, body mass and day of the week, objectively measured daily PA counts were predictive of energy consumption on the same day across four of the seven monitored days. Table 2 shows the findings for each same-day analysis (regression coefficients and their standard errors). For participants’ first day of monitoring, energy intake was 142 (se 67) kJ (34 (se 16) kcal) higher for each additional 100000 activity counts (F=4·4, P=0·0362). For days 3, 4 and 6, energy consumption was 138 (se 67) kJ (33 (se 16) kcal; F=4·2, P=0·0418), 272 (sd 84) kJ (65 (se 20) kcal; F=10·8, P=0·0011) and 188 (se 80) kJ (45 (se 19) kcal; F=5·6, P=0·0186) higher for each 100000 count increase in PA, respectively, after controlling for the covariates. Same-day PA and energy intake were not related on days 2, 5 and 7. The shared variance (R 2) of each relationship is shown in Table 2.
Table 2 Energy intake (kJ) differences per 100000 activity counts, measured on the same day, among middle-aged women (n 300), aged 35–49 years, from twenty cities in two metropolitan areas of the Mountain West, USA
The regression coefficient and its standard error for each day show the increase in energy intake on that day for each additional 100000 activity counts on the same day. For example, on day 4, for each additional 100000 activity counts recorded, energy intake was 272 kJ higher on the same day, on average.
For the R 2 column, the first number represents the variance in energy intake for a given day accounted for by differences in physical activity counts, after controlling for differences in the covariates. The second number reflects the variance in energy intake for a given day explained by physical activity and the covariates (age, body mass and day of the week) considered together, the total variance explained by the model.
Next-day prediction
After controlling for differences in the covariates, PA on a given day was a significant predictor of energy intake the next day for five of the six comparisons, as shown in Table 3. PA on day 1 predicted energy consumption on day 2. Specifically, for each additional 100000 activity counts on the first day, energy intake was 268 (se 71) kJ (64 (se 17) kcal) higher on the second day (F=13·8, P=0·0002). With days 2 and 3 paired together, energy intake was 172 (se 71) kJ (41 (se 17) kcal) higher per additional 100000 activity counts (F=5·7, P=0·0179) and for days 3 and 4, and days 4 and 5, energy consumption was 276 (se 71) kJ (66 (se 17) kcal) higher (F=14·5, P=0·0002), and 197 (se 84) kJ (47 (se 20) kcal) higher (F=5·4, P=0·0206), respectively, after controlling for the covariates. Activity on day 5 was not predictive of energy intake on day 6 (F=1·1, P=0·2920), but activity counts on day 6 predicted energy intake on day 7, with energy intake 184 (se 80) kJ (44 (se 19) kcal) higher for each additional 100000 activity counts (F=5·3, P=0·0217). Across each of the six next-day comparisons, energy intake was 198 (sd 67) kJ (47 (sd 16) kcal) higher the next day, on average, for each additional 100000 activity counts. The shared variance (R 2) of each relationship is shown in Table 3.
Table 3 Energy intake (kJ) differences per 100000 activity counts, with the activity occurring 1 d before the energy consumption, among middle-aged women (n 300), aged 35–49 years, from twenty cities in two metropolitan areas of the Mountain West, USA
The regression coefficient and its standard error for each day show the increase in energy intake on that day for each additional 100000 activity counts recorded the day before. For example, on day 2, for each additional 100000 activity counts recorded the day prior (i.e. day 1), energy intake was 268 kJ higher the next day (i.e. day 2).
For the R 2 column, the first number represents the variance in energy intake for a given day accounted for by differences in physical activity counts, after controlling for differences in the covariates. The second number reflects the variance in energy intake for a given day explained by physical activity and the covariates (age, body mass and day of the week) considered together, the total variance explained by the model.
Prediction 2 d later
After controlling for the covariates, PA on a given day was a significant predictor of energy intake 2 d later for two of the five comparisons, as shown in Table 4. PA on day 1 was not predictive of energy consumption on day 3. However, activity counts on days 2 and 3 were predictive of energy intakes on days 4 and 5, respectively. For days 4 and 5, activity counts were not predictive of energy consumption on days 6 and 7, respectively. R 2 values for each relationship are shown in Table 4.
Table 4 Energy intake (kJ) differences per 100000 activity counts, with the activity occurring 2 d before the energy consumption, among middle-aged women (n 300), aged 35–49 years, from two metropolitan areas of the Mountain West, USA

The regression coefficient and its standard error for each day show the increase in energy intake on that day for each additional 100000 activity counts recorded two days before. For example, on day 5, for each additional 100000 activity counts recorded two days prior (i.e. day 3), energy intake was 155 kJ higher on day 5.
For the R 2 column, the first number represents the variance in energy intake for a given day accounted for by differences in physical activity counts, after controlling for differences in the covariates. The second number reflects the variance in energy intake for a given day explained by physical activity and the covariates (age, body mass and day of the week) considered together, the total variance explained by the model.
Predictions 3 and 4 d later
After controlling statistically for the covariates, PA on a given day was a significant predictor of energy intake 3 d later for only one of the four possible comparisons. Similarly, activity on a given day was a significant predictor of energy consumption 4 d later for only one of the three paired comparisons.
Discussion
Overweight and obesity are serious public health issues throughout the developed world. Numerous investigations indicate that significant physical work leading to increases in energy expenditure results in higher levels of energy consumption over time. Consequently, weight management programmes based on exercise tend to result in less weight loss than expected. Although the long-term association between energy expenditure and intake is fairly well established, predictable day-to-day adjustments in energy consumption have been difficult to identify in free-living adults. Hence, the primary objective of the present study was to investigate the relationship between objectively measured PA and energy intake over seven consecutive days and also from day to day in a sample of 300 middle-age women.
Findings of the present investigation seem to indicate that free-living, middle-aged women may compensate for increased PA by consuming more energy over time. In the study, higher weekly PA was predictive of higher energy consumption during the same week. Over the full week of monitoring, PA accounted for slightly more than 5 % of the variance in energy intake and the full model explained 22 % of the variance in energy intake (P<0·0001). Specifically, women in the highest activity quartile consumed approximately 5000 kJ (1200 kcal) more over the week of monitoring compared with women in the lowest quartile, a significant and meaningful difference of more than 710 kJ/d (170 kcal/d). Controlling for differences in age, body mass and day of the week strengthened the association slightly. In short, it appears that women of the same age and body mass tend to consume more energy as their PA levels increase, and less energy as their activity levels decrease, independent of the day of the week.
Beyond a general pattern of energy compensation related to weekly activity, there appears to be a weaker pattern of compensation associated with daily activity, as well. On days that participants were more active, energy intake tended to be higher the following day. Energy adjustments were also associated with activity on the same day, but to a lesser extent. The relationship was statistically significant for five of the six next-day sequences (Table 3), but the shared variance was small, topping out at 4·3 %, and up to 15 % for the full model. For each increase of 100000 activity counts, women consumed 197 (sd 67) kJ (47 (sd 16) kcal) more energy the next day, on average. Converting 100000 activity counts to a walking equivalent showed that a 25 min increase (or decrease) in walking time (~5·6 km/h, 3·5 miles/h) on a given day was associated with an increase (or decrease) of roughly 200 kJ (50 kcal) the next day, on average.
Although the next-day association was the strongest and most consistent, the same-day sequence was statistically significant the majority of the time. On four of the seven same-day sequences, women consumed more energy on days they were more active and less energy on days they were less active. On average, for each 100000 activity count difference on a given day, energy intake was approximately 126 (sd 84) kJ (30 (sd 20) kcal) higher or lower on the same day.
In Edholm et al.’s classic study published in 1955, there was also a delayed connection between PA and energy intake( Reference Edholm, Fletcher and Widdowson 2 ). In the present study, the most predictable pattern showed a 1 d lag, whereas in the work of Edholm there was a 2 d lag between increased expenditure and increased intake. Although not identical, in both studies a consistent short-term energy compensation pattern was identified.
Years later, Edholm et al.( Reference Edholm, Adam and Healy 5 ) published another study using soldiers in training and concluded that there is no detectable short-term pattern of energy compensation although, over 3 weeks of training, a significant relationship exists. Edholm et al.( Reference Edholm, Adam and Healy 5 ) concluded, ‘It is evident that there must be lag between expenditure and intake, but the duration of the lag is variable both between individuals and in the same individual’ (p. 1105).
After conducting a study that was similar to the present investigation, de Castro( Reference De Castro 6 ) concluded that although the effect of energy expenditure on intake is small, accounting for little variance in energy intake, the effect is persistent. He postulated that the small, persistent adjustments in energy intake produce a cumulative net alteration of intake and, over time, lead to regulation of intake. Given the small R 2 values and the predictable patterns unveiled in the present study, de Castro’s conclusion appears valid.
It is possible that multiple compensation patterns are driving the timing of the activity and energy intake relationship. If a causal association is assumed, which the present study cannot infer, higher PA on a given day may lead to a small increase in energy consumption the same day and a larger energy increase the next day, with other small and less consistent adjustments possible on subsequent days, as shown in the present investigation.
The time of day PA is performed could influence when and if energy intake compensation occurs. When significant activity occurs in the morning, some measureable compensation may occur on the same day, whereas if activity occurs in the afternoon or evening, compensation may occur the next day. Future research may require evaluation of the time of day to clarify more completely the association between PA and possible energy intake compensation.
A number of factors could be driving the interplay between PA and energy intake, including behavioural, biological, metabolic and nutritional( Reference Blundell, Caudwell and Gibbons 1 ). Blundell et al.( Reference Blundell, Caudwell and Gibbons 1 ) indicate that the effect of activity on appetite, and therefore energy intake, probably stems from at least two factors, ‘one generating a tonic stimulation of appetite and the other a counteractive meal-related episodic inhibition’ (p. 609), the latter likely associated with gastrointestinal peptides( Reference Blundell, Caudwell and Gibbons 1 ).
When activity count differences were converted to walking-time equivalencies using data from the present sample, it showed that active women (top quartile) engaged in approximately 67 min more walking (~5·6 km/h, ~3·5 miles/h) per day than inactive women (bottom quartile) and 43 min more per day than moderately active women (middle quartiles). The difference between moderately active and inactive women was equivalent to about 33 min of walking per day. However, activity count differences across the activity categories (High, Moderate and Low) were not necessarily a result of differences in walking or exercise time, since all movement was tracked by the accelerometers.
A number of studies have uncovered evidence indirectly supporting the concept of energy compensation through exercise-based weight-loss interventions. For example, Donnelly et al.( Reference Donnelly, Hill and Jacobsen 55 ) showed that moderate-intensity, supervised exercise and an ad libitum diet sustained for 16 months resulted in significant weight loss in men. However, women in the study expended almost 1880 kJ (450 kcal) per exercise session, five days per week, but actually gained a non-significant amount of weight. Donnelly and King( Reference Donnelly and Smith 11 ) concluded, ‘in women, compensation through increases in energy intake is suspect’ (p. 172).
Similarly, McTiernan et al.( Reference McTiernan, Sorensen and Irwin 56 ) studied sedentary individuals to determine the effect of moderate-to-vigorous exercise on weight and fat loss over 12 months. Their calculations showed that participants should have lost 7·8 kg over the course of the intervention, ‘if caloric intake remained stable’. They concluded that exercisers lost only 1·4 kg (women) and 1·8 kg (men), suggesting that ‘some exercisers increased caloric intake’ (p. 1509).
Recently, Rosenkilde et al.( Reference Rosenkilde, Auerbach and Reichkendler 57 ) conducted a 13-week randomized controlled trial using sedentary, overweight young men to examine the effects of different doses of aerobic exercise on body composition, energy balance and energy compensation. They indicated that although one group was required to increase its energy expenditure twice as much as the other group, body weight and fat mass changes were similar in both groups. They concluded that participants compensated significantly for the increased expenditure resulting from the exercise intervention, attenuating the exercise effect on body weight.
The current study had several strengths. First, 300 women with a broad range of PA levels were tracked prospectively and serially while living in their normal environment. Second, statistical power was excellent, allowing small relationships to be detected that other studies have not been able to identify. Third, measurements of PA and energy intake were of high quality. Fourth, under-eating and under-reporting were not significant issues. Fifth, age, body mass and day of the week were controlled statistically, allowing the relationship between PA and energy intake to be better isolated and studied.
The investigation was not without limitations. Because a prospective design was employed, cause-and-effect conclusions are not appropriate. Given PA and energy intake were assessed simultaneously in the same-day analyses, temporality was a potential issue. However, for the other calculations, when energy intake was assessed after PA, temporality was not a threat. Additionally, when participants were asked to record their diets, there is a risk that they changed their intake in order to look like they eat healthier than they typically do. In the present study, this threat would likely influence less active women as well as active women. However, the potential for dietary changes associated with the self-recording of diets is a limitation. Lastly, because the study included middle-aged, non-smoking, mostly non-Hispanic white women, generalization of the results should be limited to groups with similar characteristics.
From a public health perspective, although a critical element of disease prevention and health promotion, regular PA may be limited in its capacity to engender substantial weight loss because energy adjustments tend to partially offset increased energy expenditure associated with activity. The present investigation supports this concept.
Conclusion
In conclusion, findings of the present study indicate that the relationship between PA and energy intake is weak when viewed day to day, but improves over a 7 d time period. Apparently, as PA increases, energy intake increases over 7 d, and as activity decreases, energy consumption tends to decrease as well. The current investigation indicates that physically active women consume 5023 kJ (1200 kcal) more per week than inactive women, enough to make weight loss less than expected. Moreover, on any given day, as PA increases, energy intake tends to increase the next day and, to a lesser extent, on the same day. Clearly, more research focusing on the timing of short-term energy compensation resulting from PA is needed before more effective public health strategies can be developed to reduce the incidence of obesity.
Acknowledgements
Financial support: This investigation was supported internally through a Brigham Young University (BYU) faculty fellowship award. BYU had no role in the design of the study, analysis of the data or writing of the manuscript. Conflict of interest: The author reports no conflict of interest. Authorship: L.A.T. conceived and designed the study, obtained funding, supervised data collection and data entry, performed the data analysis and wrote the manuscript. Ethics of human subject participation: The procedures used in this study were approved by the university Institutional Review Board (IRB). Each participant signed an IRB informed consent.


