


Being born small for gestational age (SGA) and stunting are major public health concerns and are highly prevalent in the developing nations of Africa and Asia. The WHO recommends the use of linear growth faltering (e.g. stunting) as a measure of health inequity(Reference Braveman1) because of its close association with other development indicators. One-third of the world’s children under 5 years of age are stunted, with approximately 70 % living in Asia, 26 % in Africa, and 4 % in Latin America and the Caribbean(Reference de Onis, Frongillo and Blössner2). There are both short- and long-term consequences of early-life growth faltering, including an increased susceptibility to infection(Reference Kossmann, Nestel, Herrera, El-Amin and Fawzi3), attenuated cognitive ability(Reference Mendez and Adair4, Reference Black, Sazawal, Black, Khosla, Kumar and Menon5), delayed childhood growth phase(Reference Liu, Albertsson-Wikland and Karlberg6), reduced final adult height(Reference Adair and Guilkey7), reduced work capacity(Reference Haas, Murdoch, Rivera and Martorell8), and increased risk of child and adulthood obesity(Reference Popkin, Richards and Montiero9, Reference Hoffman, Sawaya, Verreschi, Tucker and Roberts10), CVD and type 2 diabetes(Reference Barker11).
A number of factors have been shown to be associated with infant growth faltering in developing countries(Reference Martorell, Khan and Schroeder12, Reference Kessler and Dawson13). These include nutritional factors such as suboptimal weaning and inappropriate complementary feeding(Reference Shrimpton, Victora, de Onis, Lima, Blössner and Clugston14–Reference Emond, Drewett, Blair and Emmett16), social factors such as maternal education and deprivation(Reference Frost, Forste and Haas17), and health factors relating to infectious diseases like diarrhoea(Reference Assis, Barreto, Santos, Fiaccone and da Silva Gomes18). The value of using stunting as a developmental indicator has been enhanced through an increased understanding of the association between socio-economic status (SES) and stunting outcomes across a variety of settings. SES has been observed to show an inverse relationship with stunting, with the most deprived groups experiencing the highest levels of morbidity and mortality(Reference Anderson and Armstead19). In developing country settings where measures of income and expenditure are notoriously difficult to assess accurately, proxies for SES such as ownership of household consumer durables are used to provide an indicator of household wealth(Reference Montgomery, Gragnolati, Burke and Paredes20, Reference Filmer and Pritchett21). For instance, the Demographic and Health Surveys (DHS) in many developing countries use such proxies of SES(22). In fact, proxy measures of SES have been commonly used in household surveys across a number of developing countries since the middle of the 20th century (e.g. World Fertility Survey(22)).
These proxy measures of SES are collected across diverse settings that carry a common label of being ‘transitioning’ or developing. Although these countries share a common label, they cover a wide variety of cultures, SES, inequalities and span several continents. Despite the relationship between poverty and stunting being well established, few studies have examined and compared the determinants of linear growth faltering at several critical time points in infancy between developing countries that exhibit differing social and economic profiles using such common and consistent proxy SES measures. Understanding the meaning of these proxy variables for SES in relation to stunting across cultural settings for growth in the early years of life is important for informing public health policies as well as for the design and collection of SES measures in health surveys. For instance, do such proxy SES measures capture variation in growth patterns and remain relevant in countries that are at an intermediate level of development?
South Africa and the Philippines are both classified as displaying medium levels of human development(23). Despite both sharing medium levels of development, these contexts provide an interesting contrast for examining the demographic and socio-economic determinants of SGA and stunting in the first two years of life. The Philippines has a higher prevalence of infant malnutrition (31 %) than South Africa (25 %)(24), although the income inequalities, while large in both settings, are highest within the South African context(Reference May25). Relatively few studies(Reference Griffiths, Madise, Whitworth and Matthews26) have compared socio-economic determinants of poor infant growth outcomes between African and Asian infants. Both of these countries are currently experiencing rapid social, economic and nutritional transition and the identification of factors that drive poor growth within this type of environment is of particular interest for the development of successful context-specific intervention policies. The present study therefore aimed to examine whether a child’s early socio-economic environment significantly increases their risk of poor fetal and infant growth, and if so, which individual measures of SES are associated with these poor growth outcomes.
Subjects and methods
Sample
The present study utilized data from two longitudinal birth cohort studies: the Birth to Twenty (Bt20)Footnote * and the Cebu Longitudinal Health and Nutrition Survey (CLHNS)Footnote †. The Bt20 cohort (comprising 3273 mother–infant dyads), set in Johannesburg–Soweto, South Africa, was enrolled over a 7-week period between 23 April and 8 June 1990. The CLHNS cohort (comprising 3080 mother–infant dyads) was established from thirty-three randomly selected barangays located in metropolitan Cebu, in the Central Philippines, over a 1-year period between 1 May 1983 and 30 April 1984. A more detailed description of the Bt20(Reference Richter, Norris and De Wet27) and CLHNS(Reference Adair and Popkin28) study designs and sampling techniques can be found elsewhere. Both studies acquired ethical approval before the initiation of data collection. Bt20 obtained permission through a human subjects clearance issued by the University of Witwatersrand, South Africa. The CLHNS gained permission through the ethical committee at the University of North Carolina, USA. The present analysis has been approved by the ethical committee of the Department of Human Sciences at Loughborough University, UK.
The Bt20 cohort is exclusively urban; therefore, only urban infants were included in the analysis for CLHNS (urban: n 2355) to enable a more direct comparison between the samples. Furthermore, because the Bt20 sample was predominantly of black African ethnic origin, infants of other minority ethnic origins were excluded from the Bt20 sample (black African: n 2568). The present study therefore compares urban black South African infants with urban Asian Filipino infants. Within the current investigation, a mixed longitudinal sub-sample from both of the original cohorts was used. Of the 2355 infants in the original urban CLHNS sample, sixty-two cases were excluded from the analysis because they were missing birth and/or gestational age data. This also occurred for fifty-five cases of the original black Bt20 sample of 2568. Therefore, the total sample sizes available for analysis were 2293 and 2513 for the CLHNS and Bt20 cohorts, respectively. These sample sizes were then further reduced in the multivariate analysis. Table 1 shows the total sample sizes available for each of the outcome variables: SGA, stunting at 1 year of age and stunting at 2 years of age for each cohort. Analysis of how these sample size reductions may have influenced the findings is shown in the Results section.
Table 1 Total sample sizes available for each outcome variable of interest for the Birth to Twenty (Bt20) and Cebu Longitudinal Health and Nutrition Survey (CLHNS) cohorts

Measures
Recumbent length (birth to 24 months) or standing height (>24 months) and weight were measured following standard procedures(Reference Cameron29). Gestational age was calculated based on maternal report of the last menstrual period (LMP). In both samples, infants weighing less than 2500 g and infants whose mothers reported pregnancy complications were further assessed by trained nurses using the Ballard method(Reference Ballard, Novak and Driver30). Ballard-score-based measures taken within 120 h of birth were used when available, and LMP dates were used for all other gestational age estimates. All infants who had a birth weight below the 10th percentile of sex- and gestational-age-specific references(Reference Williams, Creasy, Hawes, Norris and Tashiro31) were classified as SGA. Height and weight measurements were compared with the National Center for Health Statistics/WHO reference population(Reference Hamill, Drizd, Johnson, Reed, Roche and Moore32) in order to calculate Z scores using ANTHRO Software for Calculating Pediatric Anthropometry version 1·02 (Centers for Disease Control and Prevention, Atlanta, GA, USA). Stunted children at 1 and 2 years of age were identified using the definition of height-for-age Z score of more than two standard deviations below the median for the reference population for the appropriate gender and age. SES was measured using questionnaires administered to the mother of each child that assessed a range of proxies of SES which were available in both cohorts and which are commonly used in large, developing country surveys such as the DHS. These included maternal education, water and toilet facilities, and refrigerator and television ownership. Sex and parity were also assessed through the questionnaire administered to the mother.
Statistical analyses
All data analyses were undertaken using the Statistical Package for the Social Sciences statistical software package version 14.0 (SPSS Inc., Chicago, IL, USA). Descriptive and bivariate analyses were used to determine the proportions of the sample that were born SGA, stunted at 1 year and stunted at 2 years, and 95 % confidence intervals for these estimates were calculated. Principal components analysis (PCA) was used to create an SES index using the same socio-economic variables (maternal education, refrigerator and television ownership, water and toilet facilities) in both cohorts. This data reduction technique has been used increasingly within the demographic literature and been shown to be a valid and reliable method for the construction of a socio-economic index(Reference Filmer and Pritchett21). Logistic regression analysis was used to identify whether the socio-economic index was significantly associated with SGA, stunting at 1 year and stunting at 2 years. Each model was applied to the data from both cohorts separately. The baseline models included the socio-economic index only, while the adjusted models included the socio-economic index plus maternal height, sex and parity. Building the models in this two-stage process allowed the association between SES and SGA, stunting at 1 year and stunting at 2 years to be tested, while controlling for maternal height, sex and parity (primaparous/non-primaparous). It also permitted knowledge of how maternal height, sex and parity influenced the significance of the association between the socio-economic factors and the outcome variables. Following the building of these six models, a further six models (baseline and adjusted for each outcome) were built in the same two-stage process, but with individual household socio-economic variables entered simultaneously into the model, rather than the index variable. The analysis was repeated with both the SES index and with individual SES variables in order to identify which aspects of household SES are associated with these poor infantile growth outcomes.
Results
Growth
A summary of the key growth characteristics of the two cohorts is shown in Table 2. Parity was significantly greater in CLHNS mothers than in Bt20 mothers (P < 0·001). More Bt20 mothers were primaparous compared with CLHNS mothers (P < 0·01). CLHNS infants had lower mean birth weight, despite having higher mean gestational age (P < 0·001 for both). In addition, significantly more CLHNS infants were born pre- and post-term compared with Bt20 infants (P < 0·01 for both). Significantly more CLHNS infants than Bt20 infants were born SGA (P < 0·01). At 1 year of age, CLHNS infants were nearly four times as likely to be stunted compared with Bt20 infants (P < 0·01). At 2 years of age, nearly half of the CLHNS infants were stunted compared with one-fifth of the Bt20 infants (P < 0·01).
Table 2 Descriptive statistics for anthropometric and sociodemographic factors relating to the 1990-born Birth to Twenty (Bt20) and the 1983/84-born Cebu Longitudinal Health and Nutrition Survey (CLHNS) cohorts
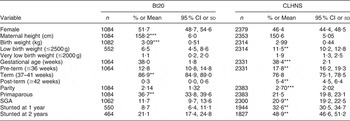
SGA, small for gestational age.
Significance: *P < 0·05, **P < 0·01, ***P < 0·001.
Socio-economic status
Table 3 highlights the socio-economic differences between the two cohorts. At the time of the infant’s birth, fewer CLHNS families owned a television or a refrigerator and they were more likely to have shared access to toilet and water facilities (P < 0·01 for all). A significantly higher proportion of Bt20 mothers had completed high school compared with CLHNS mothers when they gave birth to their infants (P < 0·01).
Table 3 Asset ownership sample sizes, percentage and 95 % confidence intervals of the Birth to Twenty (Bt20) and Cebu Longitudinal Health and Nutrition Survey (CLHNS) cohorts
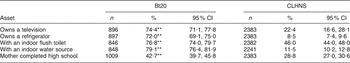
Significance: **P < 0·01.
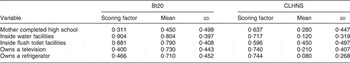
Table 4 shows the scoring factors and the summary statistics for the variables that were used to create a socio-economic index for each of the cohorts via PCA. The scoring factor is the weight allocated to each variable in the linear combination of variables that is created in the first principal component. The percentage of the variance that was explained by the first principal component was 41·4 % for the Bt20 cohort and 47·5 % for the CLHNS cohort. The eigenvalue for the first component of the Bt20 model was 2·07 compared with 2·38 for the CLHNS model.
Table 4 Scoring factors and summary statistics for the socio-economic status variables in the first principal component for the Birth to Twenty (Bt20) and Cebu Longitudinal Health and Nutrition Survey (CLHNS) cohorts
The results of the logistic regression analyses are shown in Tables 5–7 and are presented as odds ratios and 95 % confidence intervals. Table 5 compares SGA infants with average-for-gestational-age infants for both cohorts. SES was a significant predictor of SGA in the CLHNS cohort (P < 0·05), but not in the Bt20 cohort in the baseline model. However, SES was not a significant predictor of SGA in either cohort when controlling for maternal height, parity and sex. The lack of significance was observed both when using individual variables and index measures of SES. Having a taller mother and not being the first-born child reduced the odds of being born SGA in both cohorts (P < 0·05 and P < 0·01 respectively in Bt20; P < 0·001 for both in CLHNS) and being female reduced the odds of being born SGA in the CLHNS cohort (P < 0·05).
Table 5 Odds ratios and 95 % confidence intervals for the predictors of infants being born small for gestational-age v. average for gestational age in the Birth to Twenty (Bt20) and Cebu Longitudinal Health and Nutrition Survey (CLHNS) cohorts
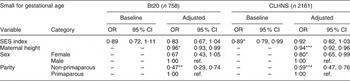
SES, socio-economic status.
Baseline model controlled for SES index only; adjusted model controlled for SES index, maternal height, sex and parity.
Significance: *P < 0·05, **P < 0·01, ***P < 0·001; ref. is the reference category.
A lower level of SES, having a shorter mother, being male and being born parity two or higher were all independent risk factors for stunting at 1 year of age in the CLHNS cohort (P < 0·001 for all) (Table 6). Only maternal height was a significant predictor of stunting at 1 year in the Bt20 cohort (P < 0·05). The models were re-run using individual SES variables rather than an SES index while controlling for maternal height, parity and gender. Not owning a television (OR = 1·69; 95 % CI 1·20, 2·36; P < 0·01), not having access to an indoor flush toilet (OR = 1·49; 95 % CI 1·18, 1·87; P < 0·01) and having a mother with less than high school education (OR = 1·42; 95 % CI 1·08, 1·88; P < 0·05) all significantly increased the odds of stunting at 1 year of age in the CLHNS cohort (results not shown). SES, when represented by an index or as individual variables, was not associated with stunting at 1 year in the Bt20 cohort.
Table 6 Odds ratios and 95 % confidence intervals for the predictors of infants being stunted v. not stunted at 1 year of age in the Birth to Twenty (Bt20) and Cebu Longitudinal Health and Nutrition Survey (CLHNS) cohorts

SES, socio-economic status.
Baseline model controlled for SES index only; adjusted model controlled for SES index, maternal height, sex and parity.
Significance: *P < 0·05, **P < 0·01, ***P < 0·001; ref. is the reference category.
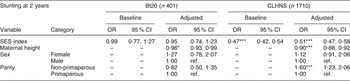
A lower level of SES, having a shorter mother and being the second or later-born child within a family were all independent risk factors for stunting at 2 years of age in the CLHNS cohort (P < 0·001 for all) (Table 7). Only maternal height was a significant predictor of stunting at 2 years in the Bt20 cohort (P < 0·05). The models were re-run using individual SES variables rather than an SES index while controlling for maternal height, parity and gender. Not owning a television (OR = 1·72; 95 % CI 1·27, 2·35; P < 0·01), not having access to an indoor flush toilet (OR = 1·72; 95 % CI 1·38, 2·15; P < 0·001) and having a mother with less than high school education (OR = 2·04; 95 % CI 1·56, 2·65; P < 0·001) all significantly increased the odds of stunting at 2 years of age in the CLHNS cohort (results not shown). SES, when represented by an index or as individual variables, was not associated with stunting at 2 years in the Bt20 cohort.
Table 7 Odds ratios and 95 % confidence intervals for the predictors of infants being stunted v. not stunted at 2 years of age in the Birth to Twenty (Bt20) and Cebu Longitudinal Health and Nutrition Survey (CLHNS) cohorts
SES, socio-economic status.
Baseline model controlled for SES index only; adjusted model controlled for SES index, maternal height, sex and parity.
Significance: *P < 0·05, **P < 0·01, ***P < 0·001; ref. is the reference category.
Sample size limitations
The relatively smaller sample sizes available for analyses of SGA (n 758) and stunting at 1 year (n 450) and 2 years (n 401) in the Bt20 cohort may have resulted in a lack of statistical power to detect significant SES predictors of growth faltering. To investigate this further, identically sized samples to those available from the Bt20 cohort were randomly selected from the CLHNS cohort and the logistic regression models re-run (data not shown). After re-analysing with these smaller sample sizes for the CLHNS cohort, the SES index remained a significant predictor of stunting at 1 and 2 years of age after controlling for maternal height, sex and parity. This suggests that sample size differences did not influence the different patterns of association observed between SES and stunting in the two cohorts. Another problem is that these reduced samples may not be socio-economically representative of the original Bt20 sample. South Africa experiences high levels of economic inequality and so these reduced sample sizes may decrease the range of socio-economic profiles within the cohort. Investigations of those Bt20 infants who were included in the analysis and those who were excluded showed significant differences in key demographic indicators and household SES (data not shown). Those included in the sample were significantly heavier at birth even though, on average, they had significantly shorter gestational periods and they had significantly fewer siblings. In addition, infants included in the analysis were significantly more likely to have access to sole toilet facilities and be the first-born child within the family. This suggests that the Bt20 sample included may have over-represented higher socio-economic groups, thus skewing the SES distribution, which could have influenced the significance of the SES predictors because of the lower variability in these measures compared with the original cohort.
Discussion
The present study examined how proxy measures of household SES relate to poor infant growth outcomes within South Africa and the Philippines, both as an index and using individual SES variables. SGA and stunting were prevalent within both cohorts, with the highest levels being experienced in the Philippines. Our analyses reveal that several measures of household SES are important for the prediction of growth faltering at different time points both between and within the two cohorts. However, the larger number of significant SES predictors in the CLHNS cohort suggests that the socio-economic milieu experienced by CLHNS infants increases the risk of becoming and remaining stunted in infancy; when using maternal education, water and toilet facilities, and ownership of a television or refrigerator to determine SES.
There was a significant difference between the two cohorts in the proportion of infants born SGA. Although a number of studies have shown an inverse relationship between the level of maternal education and the risk of delivering an SGA infant while controlling for maternal height(Reference Wen33–Reference Yunis, Beydoun and Tamim35), this was not the case for either the South African or Filipino infants. While SES was a significant predictor of SGA in the CLHNS cohort, it became insignificant when maternal height, parity and sex were controlled for. This may reflect that maternal height is a function of SES and that maternal height is the pathway linking SES and infant growth. The finding that there were no or relatively few socio-economic predictors of SGA is consistent with other studies which have suggested that maternal factors such as age, smoking status and weight gain were more important determinants of poor birth outcomes than SES per se(Reference Yunis, Beydoun and Tamim35–Reference Thompson37).
The nutritional status (i.e. height-for-age) of the infants within both cohorts deteriorated as the infants got older, resulting in more infants being stunted by 2 years compared with 1 year of age. This may reflect the progression from breast-feeding through the weaning process to solid foods. The introduction of solid or complementary foods increases the risk of infection, reduces breast milk production and thus increases the risk of malnutrition(Reference Madise and Mpoma38). During the transition from infanthood to childhood, an infant becomes increasingly independent of their caregiver and starts to interact more with the environment through crawling and walking, making them at greater risk of entering a cycle of malnutrition and infection, especially in less hygienic environments(Reference Nandy, Irving, Gordon, Subramanian and Davey-Smith39). The increasing prevalence of stunting in both cohorts highlights the adverse environments into which both groups of children were born, despite South Africa’s relatively better socio-economic status.
Results of the present study show that SES had a greater influence on child growth in the Philippines compared with South Africa. A potential explanation for this is that the Filipino social and economic milieu may have increased the risk of children being stunted in the first years of life in contrast to South African children. Urbanized living within Cebu may result in a lower SES than a similar environment within Soweto; however, Soweto families would still be considered poor according to developed country standards. Differences in development may have been expressed in contrasting community urban environments at the time of the birth and in the early years of life for the children in the two cohorts. For instance, at ages 1 and 2 years, the CLHNS infants and toddlers who lived in families who did not have an indoor flush toilet were significantly more likely to be stunted, whereas toilet facilities did not show the same association for the South African children. We know that in the South African sample the majority of the facilities were flush raised toilets (78·6 %), compared with a minority (46·0 %) within the Filipino sample. Flush toilets present less risk for contamination and infectious diseases than pit latrines for young children(Reference Gorter, Sandiford, Pauw, Morales, Perez and Alberts40) and so may reduce the risk of malnutrition through a reduction in infectious disease prevalence. The more households and respective household members sharing these toilet facilities, the higher is the probability that a child is exposed to infection. In an environment where more families have access to flush toilets, it is likely that the number of families sharing other types of facilities will reduce and thus the risk of infection and consequential malnutrition risk is reduced. The proportion of South African households who owned consumer durables and who had access to indoor water facilities was higher than that observed in the Filipino sample. This suggests that fewer South African families within the cohort were living in extreme poverty, as measured using these proxy variables, potentially reducing the pressure on the infrastructure and services that supported these families compared with the Filipino families. In addition, this homogeneity or lack of variation in possession ownership within the South African cohort may have influenced the lack of association between SGA, stunting and SES. Other measures of SES that could have better distinguished the variation in SES between households which are commonly used in developed countries like the UK, such as employment, measures of overcrowding, car and household ownership(Reference Townsend, Phillimore and Beattie41), may have shown an association with growth faltering.
The current investigation used measures of household SES, both as an index and as individual variables, to predict poor infantile growth outcomes and the results suggest that the impact of these household variables is dependent on the context in which they were observed. SES, as defined by the measures within the present study, was not a significant predictor, either as an index or as individual variables, of being born SGA or of being stunted at 1 or 2 years of age in the Bt20 context. However, it is important to highlight that although the measures of SES used herein were not significant predictors of SGA and stunting in the Bt20 cohort, maternal height was protective of SGA and stunting; thus SES may indirectly (through a maternal height pathway) have an influence on infantile growth status in children from these cohorts. SES measured as an index and using individual variables was a significant predictor of these poor growth outcomes in the CLHNS cohort. While the use of an SES index provides a useful indication of the association and its direction, it loses sensitivity around the knowledge of which specific components of SES are important in the prediction of poor growth, from which there is potential to intervene and to develop policy. It should be noted that the measures employed within Cebu may have been a better reflection of conditions in this setting, as compared with the South African setting, and thus may have resulted in the higher number of significant SES predictors within the CLHNS cohort.
Limitations
The information regarding household SES was collected through questionnaires administered to the primary caregiver. These measures may have been slightly different between the two cohorts as the questionnaires were designed by different researchers, but both groups had similar research aims and objectives. Equally rigorous questionnaire design with particular attention to content validity makes it improbable that the differences observed between the two cohorts are directly attributable to differences in response from caregivers. The relatively smaller sample sizes available for the analyses of SGA (n 758) and stunting at 1 year (n 450) and 2 years (n 401) within the Bt20 cohort could have resulted in a lack of statistical power to detect significant SES predictors of growth faltering. However, further investigations suggested that sample size differences did not influence the different patterns of association observed between SES and stunting in the two cohorts.
Conclusion
The present findings highlight that there are several key differences in the socio-economic determinants of being born SGA and being stunted at 1 and 2 years of age between South African and Filipino infants when using maternal education, water and toilet facilities, and ownership of a television and refrigerator as proxy measures of SES. There were no socio-economic predictors of poor growth outcomes in the Bt20 cohort, whereas there were several important predictors of poor growth in the CLHNS cohort: maternal education and sanitation facilities. This emphasizes the fact that the association between SES, SGA and stunting is context-specific. The identification of key individual household SES predictors of SGA and stunting within the Filipino context underscores the need to collect detailed SES data in health surveys. This is further confirmed by the lack of significance of SES predictors in the South African context, showing that these traditionally used measures of SES may not be as useful in transitioning economies such as South Africa. Thus, the collection of detailed household SES data in health surveys is important to aid policy development and to present an opportunity for potential context-specific interventions. However, as developing countries become more developed and urbanized, the choice of proxy measures for SES may need to be re-evaluated in health surveys in these regions.
Acknowledgements
Birth to Twenty (http://web.wits.ac.za/Academic/Health/Research/BirthTo20/) receives financial and logistical support from the Medical Research Council of South Africa, the Human Sciences Research Council of South Africa, the University of the Witwatersrand–Johannesburg, The Wellcome Trust (UK) and the Anglo-American Chairman’s Fund. The analysis of the Bt20 SES data was partially supported by a grant from the Medical Research Council, UK (Grant ID # 70363). Funding for the Cebu Longitudinal Health and Nutrition Survey was provided by the Ford Foundation, the US National Academy of Science, the National Institutes of Health, the Nestlé Coordinating Center for Nutrition Research, Wyeth International, and the US Agency for International Development.
Conflicts of interest: There are no conflicts of interest.
Author contributions: L.L.J., P.L.G. and N.C. were involved in the study conception and design. L.L.J., P.L.G. and L.S.A. were involved in the acquisition and interpretation of data. L.L.J. and P.L.G. were responsible for drafting the manuscript. All authors contributed to the final interpretation of data and provided critical revision.


