


Epidemiological studies have suggested that polyphenols may play a role against chronic diseases, such as cardiovascular diseases( Reference van Dam, Naidoo and Landberg 1 ), diabetes( Reference Zamora-Ros, Forouhi and Sharp 2 ), some cancers( Reference Zamora-Ros, Touillaud and Rothwell 3 ) and total mortality( Reference Zamora-Ros, Jimenez and Cleries 4 , Reference Ivey, Hodgson and Croft 5 ). Dietary polyphenols comprise a large family of >500 different compounds with highly diverse structures and are divided into four main classes: flavonoids, phenolic acids, stilbenes and lignans( Reference Zamora-Ros, Touillaud and Rothwell 3 ). Their bioavailability and biological properties vary to a great extent and are affected by their chemical structure( Reference Manach, Williamson and Morand 6 ). Therefore, it is relevant to take into account the heterogeneity of the intake of individual polyphenols when investigating their health effects.
Polyphenols exclusively occur in plant-based foods, such as fruits, vegetables, nuts, legumes, cereals, cocoa and their derived beverages, such as coffee, tea and wine( Reference Zamora-Ros, Knaze and Rothwell 7 ). Polyphenol content is highly variable, both qualitatively and quantitatively. Some polyphenols are generally distributed in the plant kingdom, whereas others are characteristic to specific foods( Reference Perez-Jimenez, Neveu and Vos 8 ). Food composition also varies depending on plant variety, geographical area, state of maturity at harvest and food processing and cooking( Reference Perez-Jimenez, Neveu and Vos 8 , Reference Rothwell, Medina-Remon and Perez-Jimenez 9 ).
Phenol-Explorer (www.phenol-explorer.eu)( Reference Neveu, Perez-Jimenez and Vos 10 ) is a comprehensive food composition database on all known dietary polyphenols. Since its initial publication in 2009, Phenol-Explorer has been used to estimate the intake of all known individual polyphenols in European adults and the elderly( Reference Zamora-Ros, Knaze and Rothwell 7 , Reference Perez-Jimenez, Fezeu and Touvier 11 – Reference Yahya, Day and Lawton 15 ). However, no similar studies have been conducted in Latin-American countries, where different foods are consumed (such as tropical fruit and vegetables) and different dietary habits are observed, except in Brazil( Reference Miranda, Steluti and Fisberg 16 ). Intakes of three flavonoid subclasses, cinnamic acids and lignans were estimated in two Mexican studies( Reference Hernandez-Ramirez, Galvan-Portillo and Ward 17 , Reference Galvan-Portillo, Wolff and Torres-Sanchez 18 ) using the US Department of Agriculture (USDA) databases( 19 ). The Mexican Teachers’ Cohort (MTC) study offers a unique opportunity to estimate the intake of all individual polyphenols and their main food sources, and to compare these intakes among different Mexican states, as well as between rural and urban areas, using the same dietary assessment methodology. Our hypothesis was that in Mexico there is a north to south westernisation gradient, and westernised diets are less abundant in fruit and vegetables, and therefore in polyphenols. A similar hypothesis was believed for rural v. urban areas, where the adherence of westernised diets is higher.
Methods
The MTC study is a cohort of 115 315 female teachers over 25 years from twelve states of Mexico from both urban and rural schools( Reference Lajous, Ortiz-Panozo and Monge 20 ). The main objective of the cohort is to evaluate the relationships between diet, lifestyle and environmental factors, and the incidence of cancer and chronic diseases in Mexican women. The study started in 2006 enrolling teachers from two states (Veracruz and Jalisco), and in 2008–2011 ten others states (Baja California, Chiapas, Mexico City, Durango, Estado de México, Guanajuato, Hidalgo, Nuevo León, Sonora and Yucatán) were added. A total of 106 466 participants with available dietary data were included in this cross-sectional analysis.
The study research was conducted according to the Declaration of Helsinki and was approved by the Institutional Review Board at the Mexican National Institute of Public Health (INSP) and by the International Agency for Research on Cancer Ethics Committee. All participants provided written informed consent for future use of biological specimens and questionnaire data.
Dietary and lifestyle information
The habitual diet of the preceding year was assessed using a self-administrated semi-quantitative FFQ, which included 140 food items with their standard portion size( Reference Romieu, Escamilla-Nunez and Sanchez-Zamorano 21 ). The list of food items was based on the Mexican version of the FFQ developed by Willett( Reference Willett 22 ) and updated with food items from the Mexican National Health Survey( Reference Rivera-Dommarco, Shamah-Levy and Villalpando-Hernández 23 ). The FFQ was validated among 134 women living in Mexico City, comparing two FFQ administered by an interviewer at an interval of approximately 1 year to four 4-d 24-h dietary recalls at 3-month intervals( Reference Hernandez-Avila, Romieu and Parra 24 ).
Data on demographics, socio-economic status (SES), reproductive history, clinical history, physical activity, smoking history and early-life risk factors were collected at baseline through a self-administered questionnaire( Reference Lajous, Ortiz-Panozo and Monge 20 ). SES was based on whether the participant had the following items: telephone, mobile telephone, car, computer, vacuum cleaner, microwave oven and internet access (low SES: ≤3 items, medium: SES 4–5 items, high SES: 6+ items). A plastic measuring tape and a short set of instructions were provided to standardise self-reported anthropometric measures (height, weight, waist and hip circumference). BMI was calculated as weight (kg) per height (m) squared. We evaluated the validity of self-reported anthropometry in this population in a subset of 3413 participants. Standardised technician measurements were well correlated with self-reported weight (r 0·2), height (r 0·86) and waist circumference (r 0·78)( Reference Ortiz-Panozo, Yunes-Díaz and Lajous 25 ).
Food composition database on polyphenols
Phenol-Explorer database provides data on 502 polyphenol compounds in 452 raw plant-based foods( Reference Neveu, Perez-Jimenez and Vos 10 ). All animal foods that contain none or only traces of plant polyphenols were excluded. Some typical Mexican foods contained in the FFQ were not present in Phenol-Explorer. For some of them (mamey, zapote, papaya, sweet potato and prickly pears), we found some polyphenol content data in the literature, but not for others (nopal, guava, jicama and squash blossoms). For these foods, polyphenol composition data were not extrapolated from other similar foods, because large differences in their composition can be found between members of the same botanical family( Reference Perez-Jimenez, Neveu and Vos 8 ).
Phenol-Explorer contains data on all polyphenol classes, such as flavonoids, phenolic acids, stilbenes and lignans( Reference Neveu, Perez-Jimenez and Vos 10 ). Total polyphenol content was calculated as the sum of individual compounds analysed by chromatography without hydrolysis. Polyphenol contents were expressed as glycosides and esters, as present in nature (mg/100 g fresh weight). Proanthocyanidin (PA) dimer data were obtained by chromatography without hydrolysis; however, for PA with a polymerisation degree higher than two (PA trimers, PA 4–6-mers, PA 7–10-mers and PA polymers (>10-mers)), data obtained by normal-phase HPLC were used.
For foods that contained polyphenols linked to the food matrix and only solubilised and quantified after basic or acid hydrolysis, content values obtained by chromatography after hydrolysis were used, as lignans in all foods, ellagic acid in walnuts and hydroxycinnamic acids in cereals, legumes and olives( Reference Neveu, Perez-Jimenez and Vos 10 ). Moreover, some missing values from orange fruit and breakfast cereals were extrapolated from orange juice and wheat flour, respectively. The effect of food cooking and processing was considered applying individual retention factors from Phenol-Explorer( Reference Rothwell, Perez-Jimenez and Neveu 26 ).
Statistical analyses
Dietary polyphenol intakes by state were presented as medians and 25th and 75th percentiles, and geometric means because their distributions were skewed. The contribution of each polyphenol class, subclass and family to the total intake of both classes and total polyphenols was calculated as a percentage of geometric means. The contribution of each food group to the intake of total polyphenols and totals per polyphenol classes was also calculated as a percentage. Moreover, main food source groups and contribution to total polyphenol intake by state were computed. Polyphenol intakes were also compared between different states, groups of age, BMI, SES, smoking status, rural and urban area and physical activity index categories. In addition, predictors of specific polyphenol intake were evaluated using general linear models accounting for age, state, BMI and energy intake. P values <0·05 (two-tailed) were considered significant. All analyses were conducted using SAS (version 9.3).
Results
The daily median intakes of total polyphenol, flavonoids, phenolic acids and other polyphenols in adult Mexican women were 694 (25th–75th percentile 413–1103), 235 (25th–75th percentile 141–367), 361 (25th–75th percentile 166–690) and 15·1 (25th–75th percentile 7·9–28·5) mg/d, respectively. Daily intakes of lignans and stilbenes were very low: 0·07 (25th–75th percentile 0·03–0·17) and 0·55 (25th–75th percentile 0·35–0·84) mg/d, respectively. Total polyphenol intake was highest in the states of Baja California (750 mg/d) and Mexico City (746 mg/d) and lowest in Yucatan (536 mg/d) (Fig. 1 and online Supplementary Table S1). Flavonoid and phenolic acid intakes were greatest in Jalisco (270 mg/d) and Chiapas (439 mg/d), respectively. Yucatan was the state with the lowest intake of flavonoids (188 mg/d) and phenolic acids (243 mg/d).
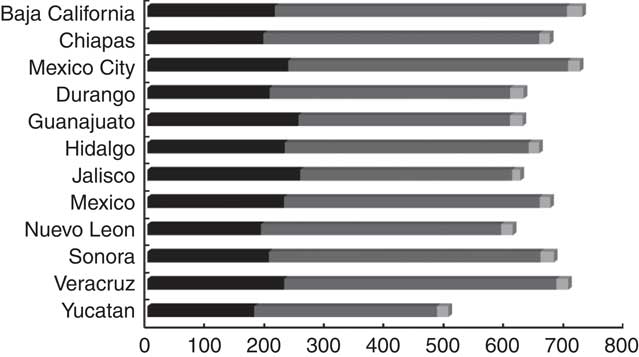
Fig. 1 Geometric mean of the main polyphenol class intakes by state in the Mexican Teachers’ Cohort. ![]() , Flavonoids;
, Flavonoids; ![]() , phenolic acids;
, phenolic acids; ![]() , other polyphenols.
, other polyphenols.
The intake of flavonoids, lignans and stilbenes increased with age, whereas the highest consumers of total polyphenols and phenolic acids were those in the 50- to 59-year age group (Table 1). Women living in urban areas consumed more polyphenols, total and all classes, compared with those living in rural areas. Women with BMI <25 kg/m2 had the highest intake of flavonoids, but the lowest intake of phenolic acids. Current smokers had the highest intake of total polyphenols and phenolic acids, whereas former smokers were the top consumers of flavonoids. The intake of total and all classes of polyphenols increased with the level of physical activity and SES (Table 1).
Table 1 Daily intakes of total and polyphenol classes by socio-demographic and lifestyle factors in the Mexican Teachers’ CohortFootnote *(Medians and 25th and 75th percentiles)
* All P values were <0·001 of differences in median intakes by age, state, energy intake and BMI among stratification variables subgroups.Missing values: area, 1259 (1·2 %); BMI, 10 106 (9·5 %); smoking status, 5116 (4·8 %); physical activity, 3149 (3·0 %); socio-economic status, 10 130 (9·5 %).
Phenolic acids were the main contributors to total polyphenol intake (63·5 %), followed by flavonoids (33·5 %) (Table 2). Stilbenes and lignans only accounted for 0·1 % of total polyphenol intake. Regarding polyphenol subclasses, the three most important were hydroxycinnamic acids (61·7 %), flavanols (17·3 %, of which mostly were PA 14·8 %) and flavanones (8·6 %). Other subclasses were less important.
Table 2 Number of individual polyphenols (PP) and contribution of classes and subclasses of total polyphenols, and the top three most consumed polyphenols for each polyphenol class and subclass in the Mexican Teachers’ Cohort
PA, proanthocyanidins.
Intake of a total of 287 individual polyphenols could be documented, of which 167 were flavonoids, sixty-seven were phenolic acids, ten were lignans, seven were stilbenes and thirty-six were other polyphenols (Table 2). In all, forty-two polyphenols were consumed in a median quantity of at least 1 mg/d, seventy-seven polyphenols between 0·1 and 1 mg/d, ninety-four polyphenols between 0·01 and 0·1 mg/d and seventy-four polyphenols in amounts between >0 and 0·01 mg/d (online Supplementary Table S2). The most consumed individual polyphenols were the 5-caffeoylquinic acid (19·4 %), 4-caffeoylquinic acid (12·1 %), 3-caffeoylquinic acid (11·4 %), ferulic acid (8·5 %), PA polymers (5·3 %) and hesperidin (5·0 %). High heterogeneity on the intake of individual polyphenols among individuals was observed – for example, the intake of 5-caffeoylquinic acid ranged from 4·7 to 520 mg/d (5th and 95th percentile of the distribution) (online Supplementary Table S2).
The main food sources of total polyphenols were coffee (47·4 %) and fruit, especially apples (7·2 %), orange and mandarins (5·1 %), and orange juice (4·8 %) (Table 2). After stratifying by state, a great variability in the contribution of food sources was observed. For example, non-alcoholic beverages contributed to total polyphenols between 41 % in Guanajuato and 56 % in Chiapas and Baja California. Fruits contributed from 22 % in Chiapas to 36 % in Jalisco. Cereals and tubercles varied between 6 % in Jalisco and 14 % in Durango. However, the contribution of vegetables and legumes (8–11 %) was similar in all states (online Supplementary Table S3). Intake of total polyphenols coming from non-alcoholic beverages and fruits was higher in urban than rural areas, whereas the opposite was observed for vegetables and legumes (Fig. 2).
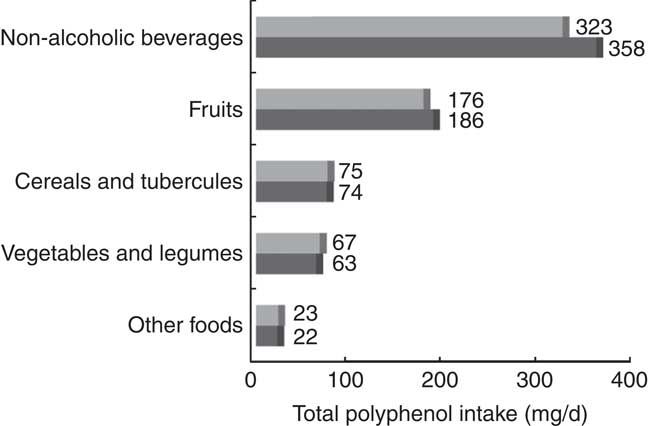
Fig. 2 Median intake of total polyphenols coming from main food groups by area (urban (![]() ) and rural (
) and rural (![]() )) in the Mexican Teachers’ Cohort.
)) in the Mexican Teachers’ Cohort.
Discussion
This is a large study estimating the intake of all known dietary polyphenols, their food sources and their determinants in a large sample of adult women in a Latin-American country. The use of the same FFQ in the entire cohort allowed us to compare differences across states and socio-economic groups. Moreover, the use of Phenol-Explorer( Reference Neveu, Perez-Jimenez and Vos 10 ) allows a straightforward comparison of polyphenol intake with previously published studies, although we need to take into account that some of the differences among studies could be owing to the different comprehensiveness of the dietary questionnaires used. To date, mostly European studies have used this food composition database( Reference Zamora-Ros, Knaze and Rothwell 7 , Reference Perez-Jimenez, Fezeu and Touvier 11 – Reference Yahya, Day and Lawton 15 ), and a few recent studies conducted in Sao Paulo-Brazil( Reference Miranda, Steluti and Fisberg 16 ), Korea( Reference Jun, Shin and Joung 27 ) and Japan( Reference Wang, Ohnaka and Morita 28 ).
In the present study, the median intake of total polyphenols was 694 mg/d, ranging from Yucatan (536 mg/d) to Baja California and Mexico City (approximately 750 mg/d). Therefore, no large differences were observed between Mexican states. Dietary patterns derived in this cohort show three distinct diets, one rich in vegetables, fruit and legumes; a Western-like diet rich in processed meats, fast foods and red meat; and a Modern Mexican diet rich in tortillas, hot peppers and sodas( Reference Monge, Lajous and Ortiz-Panozo 29 ). Patterns differ between regions in the country; the Western pattern was more frequently consumed in the northern regions of the country, and the Fruit and Vegetables and the Modern Mexican patterns were more frequently consumed in the southern regions. In our study, polyphenol intake was almost 2·5-fold the median intake in Sao Paulo-Brazil (300 mg/d)( Reference Miranda, Steluti and Fisberg 16 ). However, it was comparable with the mean intake in some Mediterranean countries, similar to that observed in the European Prospective Investigation into Cancer and Nutrition (EPIC)-Greece (584 mg/d)( Reference Zamora-Ros, Knaze and Rothwell 7 ) and Spain (280 and 820 mg/d in institutionalised elderly women and subjects at high risk of cardiovascular diseases, respectively)( Reference Tresserra-Rimbau, Medina-Remon and Perez-Jimenez 12 , Reference Gonzalez, Fernandez and Cuervo 14 ). However, total polyphenol mean intake in other European regions was much higher, as observed in French women participating in the Supplémentation en Vitamines et Minéraux Antioxydants study (1108 mg/d)( Reference Perez-Jimenez, Fezeu and Touvier 11 ), UK women in the EPIC study (1603 mg/d)( Reference Zamora-Ros, Knaze and Rothwell 7 ) and Polish women in the Health, Alcohol and Psychosocial factors In Eastern Europe (HAPPIE) study (1727 mg/d)( Reference Grosso, Stepaniak and Topor-Madry 13 ). A large south-to-north gradient was observed in Europe, where the intake in EPIC-Aarhus (Denmark) (1626 mg/d) tripled the consumption in EPIC-Greece( Reference Zamora-Ros, Knaze and Rothwell 7 ). These large differences in polyphenol intake were because of the high consumption of tea in the UK and coffee in northern Italy and northern European countries. In Mexico, tea is not commonly consumed and coffee consumption is lower than in Europe, although it is still the main dietary source of total polyphenols in our study (>50 %), like in Brazil (70 %)( Reference Miranda, Steluti and Fisberg 16 ).
In the Mexican states with the highest intake of polyphenols, the median intake of phenolic acids was between 350 and 440 mg/d, being the main contributors to total polyphenol intake (approximately 65 %), whereas in the states with a lower polyphenol intake (such as Guanajuato and Jalisco), phenolic acid median intake was below 300 mg/d, accounting only for 55 % of total polyphenols. In Brazil, although the total polyphenol intake was lower (mean=285 mg/d) than in our study, phenolic acids contributed to 75 % of total polyphenol intake( Reference Miranda, Steluti and Fisberg 16 ). In Europe, phenolic acid intakes were higher, approximately 500 and 700 mg/d in Mediterranean and non-Mediterranean countries, respectively, and they contributed to 47 and 57 % of total polyphenols, respectively( Reference Zamora-Ros, Knaze and Rothwell 7 ). Despite these differences in total phenolic acid intake, in all cases, coffee was the main food source of phenolic acids either in Mexico (approximately 75 %), Europe (70–75 %)( Reference Zamora-Ros, Luján-Barroso and Bueno-Mesquita 30 ) or Brazil (>90 %)( Reference Miranda, Steluti and Fisberg 16 ). In Mexico, median coffee intake was between 38 and 55 ml/d and in Europe the median varied between 90 mL/d of mainly espresso in Italy and 900 ml/d of mostly filtered diluted coffee in Denmark( Reference Zamora-Ros, Luján-Barroso and Bueno-Mesquita 30 ), whereas in Brazil the mean intake was 168 ml/d( Reference Miranda, Steluti and Fisberg 16 ). Espresso coffee is a concentrated coffee, and thus it is approximately 2-fold richer in polyphenols than normal filtered coffee, and 4-fold richer than ‘American’ or filtered diluted coffee( Reference Parras, Martínez-Tome and Jiménez 31 ), which is the habitual coffee of Mexicans.
The daily intake of flavonoids in Mexico was between 188 (Yucatan) and 270 mg/d (Jalisco). In Guanajuato and Jalisco, flavonoids contributed about 40 % of total polyphenols, whereas in the rest of the states they only accounted for approximately 30 %. In Brazil, flavonoids only account for 15 % of total polyphenol intake( Reference Miranda, Steluti and Fisberg 16 ). This low figure could be because of the low consumption of fruits and vegetables in this population (mean=67 g/d) or a methodological error. In Europe, flavonoid intake was also higher than in Mexico (approximately 500 mg/d), accounting for ~40 % of total polyphenols( Reference Zamora-Ros, Knaze and Rothwell 7 ). This was even higher in the UK (900 mg/d) owing to the large consumption of tea, the main dietary source of flavonoids in this country( Reference Zamora-Ros, Knaze and Rothwell 7 , Reference Yahya, Day and Lawton 15 ). The low intake of flavonoids in Mexican women and Brazilians( Reference Miranda, Steluti and Fisberg 16 ) may be because of the almost null tea consumption and the potential underestimation of flavonoid intake, because the food composition data of several tropical foods (such as prickly pears, nopal, squash blossoms, mamey, zapote, guava, jicama) are not available or not fully described in Phenol-Explorer( Reference Neveu, Perez-Jimenez and Vos 10 ). Among the flavonoid subclasses, PA and flavanones were the most consumed ones, with fruit and fruit juices as their major dietary sources. Our results cannot be compared directly with other descriptive studies on flavonoids( Reference Galvan-Portillo, Wolff and Torres-Sanchez 18 , Reference Zamora-Ros, Knaze and Lujan-Barroso 32 , Reference Chun, Chung and Song 33 ) using USDA databases( 19 ), as intake values in these studies were calculated and reported as aglycones, and not as glycosides and esters as done here( Reference Perez-Jimenez, Neveu and Vos 8 ). If we convert our results to aglycone equivalents, the median intake of total flavonoids (sum of flavonoid monomers and PA) in Mexico is 140 mg/d, which is lower than in Europe (mean 370 mg/d)( Reference Zamora-Ros, Knaze and Lujan-Barroso 32 ) and the USA (mean 285 mg/d)( Reference Chun, Chung and Song 33 , Reference Wang, Chung and Song 34 ).
The median intakes of stilbenes, lignans and other minor classes of polyphenols were very minor: 0·1, 0·6 and 15·1 mg/d, respectively. The largest contributors were alkylphenols (alkylresorcinols (median=5·7 mg/d)) mainly found in whole-grain cereals. In women from non-Mediterranean countries, the consumption of alkylresorcinols was higher (30 mg/d) than in Mexican women, because they consume larger amounts of whole-grain cereals. Stilbenes and tyrosols are characteristic of wine and olives/olive oil, respectively. Those foods are less consumed in Mexico and Brazil( Reference Miranda, Steluti and Fisberg 16 ), and thus stilbenes (0·1 mg/d) and tyrosols (0·1 mg/d in Mexico and 3·1 mg/d in Brazil) were minor polyphenol subclasses. However, in women from Mediterranean countries, the mean intake of stilbenes and tyrosols was higher (1·2 and 22·5 mg/d, respectively) owing to the greater consumption of wine, olive oil and olives( Reference Zamora-Ros, Knaze and Rothwell 7 ).
Associations between polyphenol intake and lifestyle factors have been examined in several studies. Physically active women with higher SES had a larger consumption of total polyphenols, flavonoids and phenolic acids as in the EPIC study( Reference Zamora-Ros, Knaze and Rothwell 7 ). However, women with a BMI ≥30 kg/m2 had a higher intake of total polyphenols and phenolic acids, because of a higher consumption of coffee. Current smokers also consumed more total polyphenols and phenolic acids, as smokers are much more likely to drink coffee( Reference Nettleton, Follis and Schabath 35 ). Despite this, both current smokers and women with BMI ≥30 kg/m2 tended to consume less flavonoids mainly provided from fruit and fruit juices. A similar pattern was described in both the EPIC and the Polish arm of the HAPPIE study( Reference Zamora-Ros, Knaze and Rothwell 7 , Reference Grosso, Stepaniak and Topor-Madry 13 ).
Polyphenol intake was compared in urban and rural areas. Mexican women living in urban areas had a higher intake of total and all classes of polyphenols compared with those living in rural areas. These results were expected for phenolic acids, because coffee was more consumed in urban areas and especially for women with a higher SES, who tended to live in urban areas. Flavonoid intake was also higher in urban areas; it is probably owing to the better access to fruit and vegetables in urban than rural areas( Reference Aburto, Pedraza and Sánchez-Pimienta 36 ). Another potential explanation could be that women in rural areas consume more local fruits and vegetables with limited or no polyphenol composition data in Phenol-Explorer, resulting in an underestimation of polyphenol intake in women living in rural areas.
In the present study using an FFQ, 287 individual polyphenols were described, whereas intakes of 347, 337 and 290 polyphenols have been reported in the Polish arm of the HAPIEE study( Reference Grosso, Stepaniak and Topor-Madry 13 ), in the SU.VI.MAX study( Reference Perez-Jimenez, Fezeu and Touvier 11 ) and in the Spanish PREvención con DIeta MEDiterránea study( Reference Tresserra-Rimbau, Medina-Remon and Perez-Jimenez 12 ), respectively. In the studies using a single 24-h dietary recall, the number of individual polyphenols was higher, especially in the EPIC study (n 437)( Reference Zamora-Ros, Knaze and Rothwell 7 ), but comparable to the Brazilian study (n 317)( Reference Miranda, Steluti and Fisberg 16 ). In our study, only forty-two individual polyphenols were found to be consumed in a median amount >1 mg/d; however, approximately 100 polyphenols were consumed in a mean quantity of at least 1 mg/d on average in the remaining studies( Reference Zamora-Ros, Knaze and Rothwell 7 , Reference Perez-Jimenez, Fezeu and Touvier 11 – Reference Grosso, Stepaniak and Topor-Madry 13 ). This phenomenon is due to the highly skewed distribution of polyphenol intakes.
A large inter-individual variability in the intake of individual polyphenols was observed (up to 100-fold change) – for example, the median intake of 5-caffeoylquinic acid was 90 mg/d, ranging from 4·7 to 520 mg/d (5th and 95th percentile of the distribution). High heterogeneity among subjects is also described in other studies( Reference Zamora-Ros, Knaze and Rothwell 7 , Reference Perez-Jimenez, Fezeu and Touvier 11 – Reference Grosso, Stepaniak and Topor-Madry 13 , Reference Miranda, Steluti and Fisberg 16 ). In EPIC, the intake of 5-caffeoylquinic acid varied between 20 and 460 mg/d (5 and 95 %, median 195 mg/d)( Reference Zamora-Ros, Knaze and Rothwell 7 ). Furthermore, the most consumed individual polyphenols were the 5-, 4- and 3-caffeoylquinic acids, and ferulic acid, which are almost exclusively related to coffee. PA and hesperidin were also abundant individual polyphenols such as in the European studies( Reference Zamora-Ros, Knaze and Rothwell 7 , Reference Perez-Jimenez, Fezeu and Touvier 11 – Reference Grosso, Stepaniak and Topor-Madry 13 ).
The first strength of this study was the large number of participants in the MTC study. The second was the use of an extensive food composition database, Phenol-Explorer, including a complete list of 500 polyphenols expressed as they are found in foods and including individual retention factors( Reference Neveu, Perez-Jimenez and Vos 10 , Reference Rothwell, Perez-Jimenez and Neveu 26 ). The third advantage was the use of a validated FFQ in the whole cohort( Reference Hernandez-Avila, Romieu and Parra 24 ). However, our study has also some limitations. A relevant weakness is the likely underestimation of true polyphenol intake, owing to missing food composition data on some tropical foods in the FFQ. Our results cannot be totally generalisable, as all participants were teachers and therefore no illiterate people or women with very low education were recruited.
In conclusion, these data indicate a large heterogeneity in intakes of individual polyphenols among Mexican women, but a moderate heterogeneity across Mexican states. The main food sources per individual polyphenol were similar among states. In addition, we showed that socio-demographic, anthropometric and lifestyle factors are associated with different levels of polyphenol intake. Indeed, women living in urban areas consumed more polyphenols, total and all classes, compared with those living in rural areas. These descriptive data provide a platform to further investigate the role of polyphenol intake against disease outcomes.
Acknowledgements
The authors are grateful first and foremost to all MTC participants for their time and commitment. The authors would like to thank Carrera Magisterial at the Ministry of Education, with special thanks to Victor Sastré, Director de Regulation. The authors thank Institute for Social Security and Services for Civil Servants’s Medical Directorate staff and Jalisco’s regional office and the Veracruz Ministry of Health for technical and administrative support. R. Z.-R. would like to thank the ‘Miguel Servet’ programme (CP15/00100) from the Institute of Health Carlos III and the European Social Fund.
This work was supported by the American Institute for Cancer Research (grant no. 10A035); Consejo Nacional de Ciencia y Tecnologia (grant no. 115312); and Ministry of Health of Mexico, AVON, Banorte.
R. Z.-R. and I. R. designed the research; . A. M., M. L., R. L.-R. and A. S. collected the data; R. Z.-R. and J. A. R. carried out the study; and C. B. performed the statistical analysis. R. Z.-R. and A. S. drafted the manuscript. All authors read, critically reviewed and approved the final manuscript.
The authors declare that there are no conflicts of interest.
Supplementary material
For supplementary material/s referred to in this article, please visit https://doi.org/10.1017/S0007114518001381


