

Sparassodonta is a monophyletic group, basal to the crown group Marsupialia (Forasiepi Reference Forasiepi2009), which includes more than 50 species of extinct marsupial predators. They inhabited the South American continent during most of the Cenozoic (e.g., Marshall Reference Marshall1978; Forasiepi 2009; Prevosti et al. Reference Prevosti, Forasiepi and Zimicz2013), and shared the predatory guild with phorusrhacoid ‘terror’ birds, large terrestrial crocodiles (Sebecidae), giant snakes (Madtsoiidae) and, in the last part of the Tertiary, with placental carnivores (Carnivora) (Simpson Reference Simpson1950, Reference Simpson1980; Patterson & Pascual Reference Patterson, Pascual, Keast, Erk and Glass1972; Reig Reference Reig1981; Gasparini Reference Gasparini1984; Albino Reference Albino and Arratia1996; Pascual Reference Pascual2006; Forasiepi et al. Reference Forasiepi, Martinelli and Goin2007; Riff et al. Reference Riff, Seyferth, Ribeiro Oliveira, Aguilera, Hoorn and Wesselingh2010; Prevosti & Soibelzon Reference Prevosti, Soibelzon, Patterson and Costa2012; Prevosti et al. Reference Prevosti, Turazzini, Ercoli and Hingst-Zaher2012a, b). The Sparassodonta had a wide range of body sizes and locomotor habits, from the scansorial opossum-like Pseudonotictis pusillus of about 1 kg, to the large terrestrial Thylacosmilus atrox of near 100 kg (Wroe et al. Reference Wroe, Myers, Wells and Gillespie1999, Reference Wroe, Myers, Seebacher, Kear, Gillespie, Crowther and Salisbury2003, Reference Wroe, Argot and Dickman2004, Reference Wroe, Chamoli, Parr, Clausen, Ridgely and Witmer2013; Argot Reference Argot2003a, Reference Argotb, Reference Argot2004a, Reference Argotb, Reference Argotc; Vizcaíno et al. Reference Vizcaíno, Bargo, Kay, Fariña, Di Giacomo, Perry, Prevosti, Toledo, Cassini and Fernicola2010; Ercoli & Prevosti Reference Ercoli and Prevosti2011; Ercoli et al. Reference Ercoli, Prevosti and Álvarez2012; Prevosti et al. Reference Prevosti, Forasiepi, Ercoli, Turazzini, Vizcaíno, Kay and Bargo2012b), and a variety of morphological adaptations to carnivory, reaching extreme morphotypes such as the sabertoothed Thylacosmilus atrox (Marshall Reference Marshall, Hecht, Goody and Hecht1977a; Goin & Pascual Reference Goin and Pascual1987; Argot Reference Argot2004a; Forasiepi & Carlini Reference Forasiepi and Carlini2010; Prevosti et al. Reference Prevosti, Turazzini and Chemisquy2010; Engelman & Croft Reference Engelman and Croft2014; Ercoli et al. Reference Ercoli, Prevosti and Forasiepi2014; Forasiepi et al. Reference Forasiepi, Judith Babot and Zimicz2014). The stratigraphic range of Sparassodonta goes from early Paleocene (Tiupampan age, ≈64–62 Ma) to middle Pliocene (Chapadmalalan Age, ≈3.3 Ma), reaching their acme, with eleven species, during the late early Miocene (Santacrucian Age, 18–16 Ma) (Sinclair Reference Sinclair1906; Argot Reference Argot2004c; Forasiepi Reference Forasiepi2009; Prevosti et al. Reference Prevosti, Forasiepi, Ercoli, Turazzini, Vizcaíno, Kay and Bargo2012b).
Most species of Sparassodonta are only known from isolated teeth or fragmentary mandibles, so previous authors made inferences of their diet by comparing the dentition of sparassodonts with that of living mammal carnivores (e.g., Marshall Reference Marshall1978). The dentition of sparassodonts is extremely specialised towards a carnivorous diet (Muizon & Lange-Badré Reference Muizon and Lange-Badré1997), but variations in tooth morphology suggest differences in the type of food ingested (Marshall Reference Marshall, Hecht, Goody and Hecht1977a, Reference Marshall1978, Reference Marshall1979, Reference Marshall1981). In genera where the skull and mandible are preserved (e.g., Cladosictis, Borhyaena, Prothylacinus), morphological differences lead to infer different biting capabilities. Additionally, postcranial evidence suggests a diversification of hunting and preying behaviours (Argot Reference Argot2003a, Reference Argotb, Reference Argot2004c; Blanco et al. Reference Blanco, Jones and Grinspan2011).
Sparassadonta is divided in two main clades, Hathliacynidae and Borhyaenoidea (see Forasiepi Reference Forasiepi2009). Hathliacynids include small to medium-sized sparassodonts (e.g., Cladosictis and Sipalocyon), most of them with scansorial habits, with pseudo-opposable pollex that enabled manipulative behaviour, and a generalised carnivorous dentition (Argot Reference Argot2003b, Reference Argot2004c; Forasiepi Reference Forasiepi2009; Ercoli et al. Reference Ercoli, Prevosti and Álvarez2012; Prevosti et al. Reference Prevosti, Forasiepi, Ercoli, Turazzini, Vizcaíno, Kay and Bargo2012b, Reference Prevosti, Forasiepi and Zimicz2013; Zimicz Reference Zimicz2014). Cladosictis patagonica has been considered as having the most specialised dentition among hathliacynids, adapted toward hypercarnivory; however, it seems to be a species with a weak bite force when compared with other marsupials, suggesting that they only preyed on small vertebrates and perhaps had a more omnivorous diet (Blanco et al. Reference Blanco, Jones and Grinspan2011). Borhyaenoids are medium to large sized, and morphologically more diverse than the other clade, with most of the species showing a specialised diet towards hypercarnivory. Basal borhyaenoids, such as Prothylacynus and Lycopsis, were considered omnivores or mostly omnivores (Marshall Reference Marshall, Hecht, Goody and Hecht1977a, Reference Marshallb, Reference Marshall1978, Reference Marshall1979, Reference Marshall1981), although their dental morphology, stomach contents remains (in the case of Lycopsis longirostrus) and the architecture of the postcranial skeleton suggests a more active predation (Marshall Reference Marshall1977b; Argot Reference Argot2003a, Reference Argot2004a, Reference Argotc). Proborhyaenidae (Proborhyaena, Arminiheringia and Callistoe) represent mostly a pre-Miocene radiation of hypercarnivore borhyaenoids (Marshall Reference Marshall1978), some of them considered as the largest bone cracker sparassodonts (Zimicz Reference Zimicz2012; Forasiepi et al. Reference Forasiepi, Babot and Zimicz2015). The derived borhyaenoids (Borhyaenidae), Borhyaena and Artodictis, are regarded as large specialised carnivores, with robust and bulbously rooted teeth, and robust deep jaws, which led several authors to infer some capacity to crush bones (Argot Reference Argot2004c; Forasiepi et al. Reference Forasiepi, Goin and Tauber2004, Reference Forasiepi, Babot and Zimicz2015). Finally, the most derived borhyaenoids are the Thylacosmilidae, which convergently evolved a sabre-toothed morphology (Marshall Reference Marshall1976, Reference Marshall1978; Forasiepi & Carlini Reference Forasiepi and Carlini2010).
Most of the palaeoecological reconstructions for the group were based on qualitative approaches (e.g., Marshall Reference Marshall, Hecht, Goody and Hecht1977a, Reference Marshall1978, Reference Marshall1979, Reference Marshall1981; Argot Reference Argot2003a, Reference Argotb, Reference Argot2004a, Reference Argotb; Forasiepi et al. Reference Forasiepi, Goin and Tauber2004; Forasiepi Reference Forasiepi2009) or on dental morphometric indexes and bite force estimations (Blanco et al. Reference Blanco, Jones and Grinspan2011; Prevosti et al. Reference Prevosti, Forasiepi, Ercoli, Turazzini, Vizcaíno, Kay and Bargo2012b, Reference Prevosti, Forasiepi and Zimicz2013). The analysis of the dental morphometric indexes suggested that most sparassodonts had hyper-carnivorous diets (Prevosti et al. Reference Prevosti, Forasiepi, Ercoli, Turazzini, Vizcaíno, Kay and Bargo2012b, Reference Prevosti, Forasiepi and Zimicz2013), but this hypothesis has not yet been tested using a wider comparative sample and multivariate statistics analyses.
The main aim of this study is to explore the evolution of mandible shape in Sparassodonta, Carnivora and Marsupialia, and its relation with diet, size and phylogeny. In order to accomplish this objective, we analysed mandible shape using 2D geometric morphometric methods and multivariate techniques in a wide sample of extant species to infer dietary habits in Sparassodonta species, in particular in santacrucian taxa. We also compared our results with previous dietary inferences (e.g., Wroe & Milne Reference Wroe and Milne2007; Goswami et al. Reference Goswami, Milne and Wroe2011), especially with those based on dental anatomy (Marshall Reference Marshall, Hecht, Goody and Hecht1977a, Reference Marshall1978, Reference Marshall1979, Reference Marshall1981; Prevosti et al. Reference Prevosti, Forasiepi and Zimicz2013; Zimicz Reference Zimicz2014). Finally, we discuss the implications of our results for the evolutionary history of the Sparassodonta.
1. Materials and methods
1.1. Materials and taxonomic sample
The dataset studied included a total of 498 mandibles belonging to 142 species of extant marsupials (Dasyuromorphia, Didelphimorphia, Peramelemorphia and Microbiotheria) and placental carnivores (Carnivora), in addition to the 35 fossil specimens belonging to 15 species of Sparassodonta (). For extant taxa, only adult specimens with fully erupted dentition were included and, when possible, we tried to sample an equal number of males and females, up to six per species. For extinct taxa, we included specimens with fully erupted dentition and no evident deformation; fragmentary material was included as long as all landmarks could be identified. Mandibles were photographed aligning the medial surface of the mandible resting on the table or camera stand base. The sparassodont species included in this study belong to the family Hathliacynidae Ameghino, Reference Ameghino1894, and the superfamily Borhyaenoidea Simpson, Reference Simpson and Pompeckj1930 (systematic arrangement after Forasiepi Reference Forasiepi2009) ().
Since we analysed lower carnassial morphology (i.e., trigonid/talonid development of m1 in Carnivora and m4 in marsupials), we did not include taxa with reduced dentition and no carnassials (e.g., the living Pinnipedia, Proteles). The lower fourth molar (m4) of metatherians was chosen as an analogue of the carnivore m1 because it usually presents the more carnassial-like shape, is placed closest to the condyle and, from a biomechanical point of view, it is in the ‘correct’ to be an analogue for a carnassial in an adult marsupial (see Werdelin Reference Werdelin1986, Reference Werdelin1987; Jones Reference Jones, Jones, Dickman and Archer2003; Prevosti et al. Reference Prevosti, Turazzini, Ercoli and Hingst-Zaher2012a).
We classified the species according to their diet () following the categories proposed by Van Valkenburgh (Reference Van Valkenburgh and Gittleman1989) with minor modifications:
– Hypercarnivores: most of their diet is composed by other vertebrates;
– Mesocarnivores: feed mainly on other vertebrates (usually smaller species than themselves), but also plants and invertebrates;
– Omnivores: plants and invertebrates represent a large proportion of the diet;
– Herbivores: feed mostly on plant materials;
– Insectivores: feed mostly on insects.
Data on extant species diet was taken from the bibliography (). We are aware of the limitations of classifying a continuous character such as diet in discrete categories, but since, for many of the species included, there are no detailed diet analyses by using this classification scheme, we were able to include a larger sample of extant species, improving the representation of the morphological variability present in living species of carnivores and marsupials. In the case of otters, although most of the species could be classified as piscivores since they eat a large proportion of fish, we classified them as hypercarnivores since fish are vertebrates; moreover changing their classification did not alter our results.
1.2. Geometric morphometrics
1.2.1. Landmarks
Two sets of landmarks were combined with different taxonomic groups to construct three samples. The first sample (MAND_TOT) includes the metatherians and eutherians using a configuration of 29 landmarks representing the whole mandible as defined by Prevosti et al. (Reference Prevosti, Turazzini, Ercoli and Hingst-Zaher2012a) Fig. 1A). The second sample (MAND_MET) includes only metatherians and the same landmark configuration as the first analysis. Finally, a third sample (BODY_MET) was performed with metatherians, but using a configuration of 33 landmarks placed only on the mandibular body (Fig. 1B).
Figure 1 Configurations of landmarks (filled circles) and ‘semi-landmarks’ (open circles) used. (A) Set 1 in Chrysocyon brachyurus lower jaw: 1 = distal extreme of the mandible condyle; 2 = most concave point of mandible notch; 3 = dorso-caudal angle of the coronoid process; 4–11 = ‘semi-landmarks’; 12 = distal extreme of the carnassial; 13 = distal border of the protoconid projected to the base of the crown of the carnassial; 14 = mesial extreme of the lower carnassial; 15 = distal extreme of the c1; 16 = mesial extreme of the c1; 17–28 = ‘semi-landmarks’; 29 = anterior border of the masseteric fossa. (B) Set 2 in Cladosictis patagonica lower jaw: 1 = anterior border of the masseteric fossa; 2 = distal extreme of the m4; 3 = distal border of the protoconid projected to the base of the crown of the m4; 4 = mesial extreme of the m4; 5 = distal extreme of the m3; 6 = distal border of the protoconid projected to the base of the crown of the m3; 7 = mesial extreme of the m3; 8 = distal extreme of the m2; 9 = distal border of the protoconid projected to the base of the crown of the m2; 10 = mesial extreme of the m2; 11 = distal extreme of the m1; 12 = distal border of the protoconid projected to the base of the crown of the m1; 13 = mesial extreme of the m1; 14 = distal extreme of the p3; 15 = mesial extreme of the p3; 16 = distal extreme of the p2; 17 = mesial extreme of the p2; 18 = distal extreme of the p1; 19 = mesial extreme of the p1; 20 = distal extreme of the c1; 21 = mesial extreme of the c1; 22–33 = ‘semi-landmarks’.
We used landmarks of types I, II and III (sensu Bookstein Reference Bookstein1991), which were digitised using the software tpsDig 2.09 (Rohlf Reference Rohlf2006). Prior to the use of tpsDig, we used the program MakeFan6 (Sheets Reference Sheets2003) to place alignment ‘fans’ that helped to place type III landmarks (i.e., semi-landmarks) consistently. In the analyses of the whole mandible, fans were placed equiangular, radiating from the distal extreme of the mandibular condile (semi-landmarks 4–11) and equidistantly from the distal-most point of the mandibular condyle to the mesial-most point of the lower canine (semi-landmarks 17–28); whilst for the analysis of the mandibular body, they were placed equidistantly from the ventral margin projection of the landmark of the distal extreme of m4 to the ventral margin projection of the landmark of the distal extreme of the c1 (semi-landmarks 22–33) (see Bookstein Reference Bookstein1997; Perez et al. Reference Perez, Bernal and Gonzalez2006). The software tpsUtil 1.40 (Rohlf Reference Rohlf2008) was used to compile image files and to perform other basic operations. Sliding of the semi-landmarks, as well as superimposition of landmark configurations through generalised Procrustes analysis (GPA; Goodall Reference Goodall1991; Rohlf Reference Rohlf1999) was performed using the software tpsRelw 1.45 (Rohlf Reference Rohlf2007).
1.2.2. Analyses
The discrimination of diet classes and the placement of fossils was explored through a between-group PCA (BgPCA; Bookstein Reference Bookstein1989; Rohlf Reference Rohlf, Marcus, Bello and Garcia-Valdecasas1993; Zelditch et al. Reference Zelditch, Swiderski, Sheets and Fink2004; Mitterocker & Bookstein Reference Mitteroecker and Bookstein2011) and with a discriminant analysis (DA) using the MASS library (Venables & Ripley Reference Venables and Ripley2002) for the software R (R Development Core Team 2010). For the BgPCA, we used the Procrustes coordinates of the specimens aligned previously. In the discriminant analysis, we used the scores of the BgPCA (five or four variables) as dependent variables, in order to control the negative impact of having many dependent variables (Neff & Marcus Reference Neff and Marcus1980; Kovarovic et al. Reference Kovarovic, Aiello, Cardini and Lockwood2011), but without discarding any morphological information. For the same reason, we used specimens and not species means in the DAs, and each specimen of Sparassodonta was classified independently. The same probability of classification was assigned to each group and the percentage of posterior correct reclassification was calculated using cross validation (CV; Reyment et al. Reference Rement, Blackith and Campbell1984; Jackson Reference Jackson1993; Mendoza et al. Reference Mendoza, Janis and Palmqvist2002).
Aligned landmark coordinates were used to perform a multivariate regression between size and shape, using Procrustes coordinates (i.e., shape) as dependent variables and natural log-transformed centroid size (i.e., size) as the explanatory variable (). The significance of this relationship was analysed using permutations (10000 replicates). The regression analyses were performed using the software MorphoJ 1.02b (Klingenberg Reference Klingenberg2011). In order to take into account the phylogenetic structure of the data, we constructed a phylogenetic covariance matrix based on a combined phylogenetic tree (see below), and performed the same regression of size onto shape, but incorporating this matrix into the error term of the regression equations (PGLS (phylogenetic generalised least squares); Martins & Hansen Reference Martins and Hansen1997). These analyses were carried out using the package APE (Paradis et al. Reference Paradis, Claude and Strimmer2004) for R (R Development Core Team 2010).
The phylogenetic matrix was constructed from a combined phylogenetic tree, following the same procedures as in Prevosti et al. (Reference Prevosti, Turazzini, Ercoli and Hingst-Zaher2012a). The combined phylogenetic tree () was built from recently published phylogenies (Krajewski & Westerman Reference Krajewski, Westerman, Jones, Dickman and Archer2003; Flynn et al. Reference Flynn, Finarelli, Zehr, Hsu and Nedbal2005; Gaubert et al. Reference Gaubert, Wozencraft, Cordeiro-Estrela and Veron2005; Johnson et al. Reference Johnson, Eizirik, Pecon-Slattery, Murphy, Antunes, Teeling and O'Brien2006; Koepfli et al. Reference Koepfli, Jenks, Eizirik, Zahirpour, Van Valkenburgh and Wayne2006, Reference Koepfli, Gompper, Eizirik, Ho, Linden, Maldonado and Wayne2007, Reference Koepfli, Deere, Slater, Begg, Begg, Grassman, Lucherini, Veron and Wayne2008; Beck Reference Beck2008; Krause et al. Reference Krause, Unger, Nocon, Malaspinas, Kolokotronis, Stiller, Soibelzon, Spriggs, Dear, Briggs, Bray, O'Brien, Rabeder, Matheus, Cooper, Slatkin, Paabo and Hofreiter2008; Flores Reference Flores2009; Patou et al. Reference Patou, Mclenachan, Morley, Couloux, Cruaud, Jennings and Veron2009; Sato et al. Reference Sato, Wolsan, Minami, Hosoda, Shinaga, Hiyama, Yamaguchi and Suzuki2009; Wolsan & Sato Reference Wolsan, Sato, Nevo, Mares, Johnson, Marroig and Marquet2009; Prevosti Reference Prevosti2010, for living taxa; and Forasiepi et al. Reference Forasiepi, Babot and Zimicz2015 for Sparassodonta). For the phylogenetic relationships of B. musteloides, Pe. pungens, Ps. pusillus and S. gracilis, we followed Marshall (Reference Marshall1981).
2. Results
2.1. Diet and shape variation
2.1.1. Analysis of the whole mandible in carnivorans and metatherians (MAND_TOT)
BG-PC1 explained 58.31 % of the total variance. On the negative scores, we found specimens with a robust mandibular body, high coronoid process, ventrally displaced condyle, anteriorly expanded masseteric fossa (landmark 29), and large canines and carnassials (Fig. 2). Specimens with positive scores showed the opposite trend (Fig. 2). BG-PC2 explained 19.87 % of the total variance; specimens with positive scores showed mandibles with a broader coronoid process, a lower mandibular body in its anterior portion but higher in the posterior region, a well-developed subangular lobule, a small canine, and the carnassial placed more anteriorly and with a short trigonid and a long talonid. The opposite trend is observed in the negative end of this axis (Fig. 2).
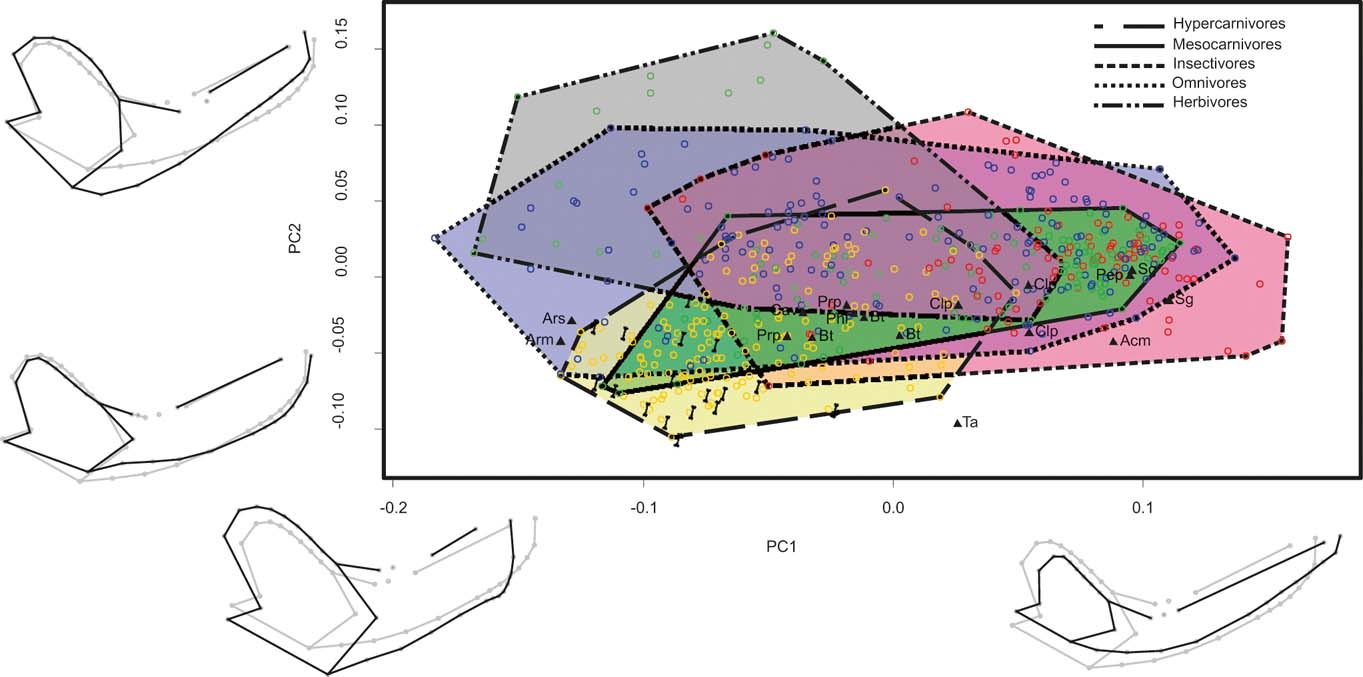
Figure 2 Graph showing the first two axes of between-group principal component analysis of the sample that includes carnivorans and metatherians and the whole mandible configuration (MAND_TOT). Mandible shapes at each end of each axis shown in black; consensus shapes in grey. Abbreviations: Acm = Acyon myctoderos; Arm = Arctodictis munizi; Ars = Arctodictis sinclairi; Bt = Borhyaena tuberata; Cav = Callistoe vincei; Clp = Cladosictis patagonica; Pep = Perathereutes pungens; Phl = Pharsophorus lacerans; Prp = Prothylacynus patagonicus; Sg = Sipalocyon gracilis; Ta = Thylacosmilus atrox. Yellow and long dashed line = hypercarnivores; pale green and continuous line = mesocarnivores; blue and dotted line = omnivores; red and short dashed line = insectivores; grey and two point-dashed = herbivores. Bones indicate ossifragous specimens.
Although there was a wide overlap between all diet categories, a pattern could be observed whereby hypercarnivores had negative scores on BG-PC1 and 2, and herbivores had negative scores for BG-PC1, but positive scores on BG-PC2. Mesocarnivores, insectivores and omnivores were widely overlapped in the centre of the distribution (Fig. 2). Sparassodonts had negative scores for BG-PC2, but are widely distributed along BG-PC1. Larger species (e.g., Borhyaena, Thylacosmilus, Arctodictis) are in the area dominated by hypercarnivores, whilst the smaller species (e.g., Cladosictis, Sipalocyon) overlapped with omnivores, mesocarnivores and insectivores (Fig. 2).
2.1.2. Analysis of the whole mandible in metatherians (MAND_MET)
BG-PC1 explains 51.55 % of the total variance. Specimens with negative scores showed robust mandibles with a ventrally displaced condyle, posteriorly displaced carnassials (placed near the base of the coronoid process) that present a reduced talonid, an anteriorly displaced masseteric fossa, and large canines (Fig. 3). Specimens with positive scores showed the opposite morphological trend. BG-PC2 explains 35.67 % of the total variance, and changes are less evident than in BG-PC1. Specimens with positive scores showed mandibles with a broader coronoid process, a large and posteriorly displaced condyle, a more convex ventral border, and a more robust mandibular body (Fig. 3). Specimens with negative scores showed the opposite pattern (Fig. 3).
Hypercarnivores were completely separated from the other groups and placed toward the negative scores of BG-PC1, but omnivores, mesocarnivores and insectivores are widely overlapped on both axes (Fig. 3). Sparassodonts were aligned with hypercarnivores on BG-PC1, but most species showed higher BG-PC2 scores; whilst Thylacosmilus showed smaller scores for that axis (Fig. 3). Cladosictis, Sipalocyon, Acyon and Perathereutes overlapped with omnivores, mesocarnivores or insectivores.
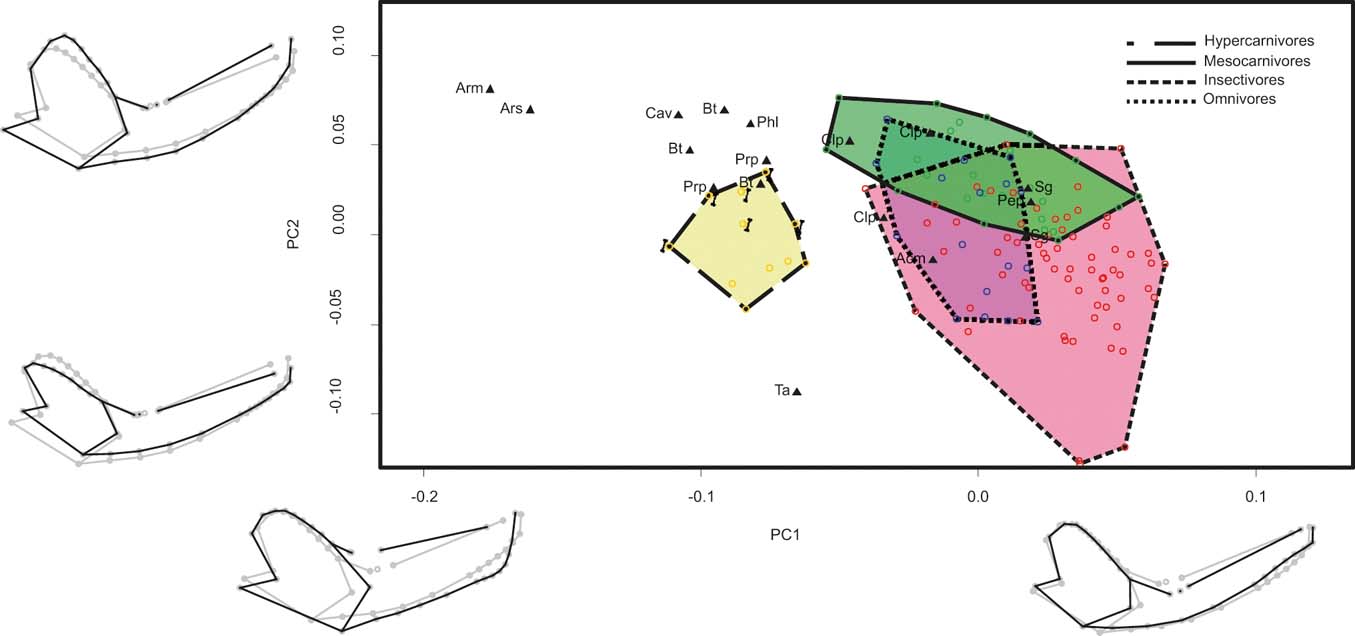
Figure 3 Graph showing the first two axes of between-group principal component analysis of the sample that includes the complete mandible configuration of metatherians (MAND_MET). Mandible shapes at each end of each axis shown in black; consensus shapes in grey. Abbreviations: Acm = Acyon myctoderos; Arm = Arctodictis munizi; Ars = Arctodictis sinclairi; Bt = Borhyaena tuberata; Cav = Callistoe vincei; Clp = Cladosictis patagonica; Pep = Perathereutes pungens; Phl = Pharsophorus lacerans; Prp = Prothylacynus patagonicus; Sg = Sipalocyon gracilis; Ta = Thylacosmilus atrox. Yellow and long dashed line = hypercarnivores; pale green and continuous line = mesocarnivores; blue and dotted line = omnivores; red and short dashed line = insectivores. Bones indicate ossifragous specimens.
2.1.3. Analysis of the mandibular body in metatherians (BODY_MET)
BG-PC1 explained 48.92 % of the total variance. Specimens with negative scores showed a shorter and more robust mandibular body, anteriorly displaced masseteric fossa, larger canines, reduced p1 and larger molars with a highly reduced talonid (Fig. 4). Specimens with positive scores show the opposite trend (Fig. 4). BG-PC2 explained 31.62 % of the total variance, and towards its negative end specimens showed a larger p2 and p3, and an anteriorly displaced masseteric fossa (Fig. 4). Specimens with positive scores show the opposite trend (Fig. 4).
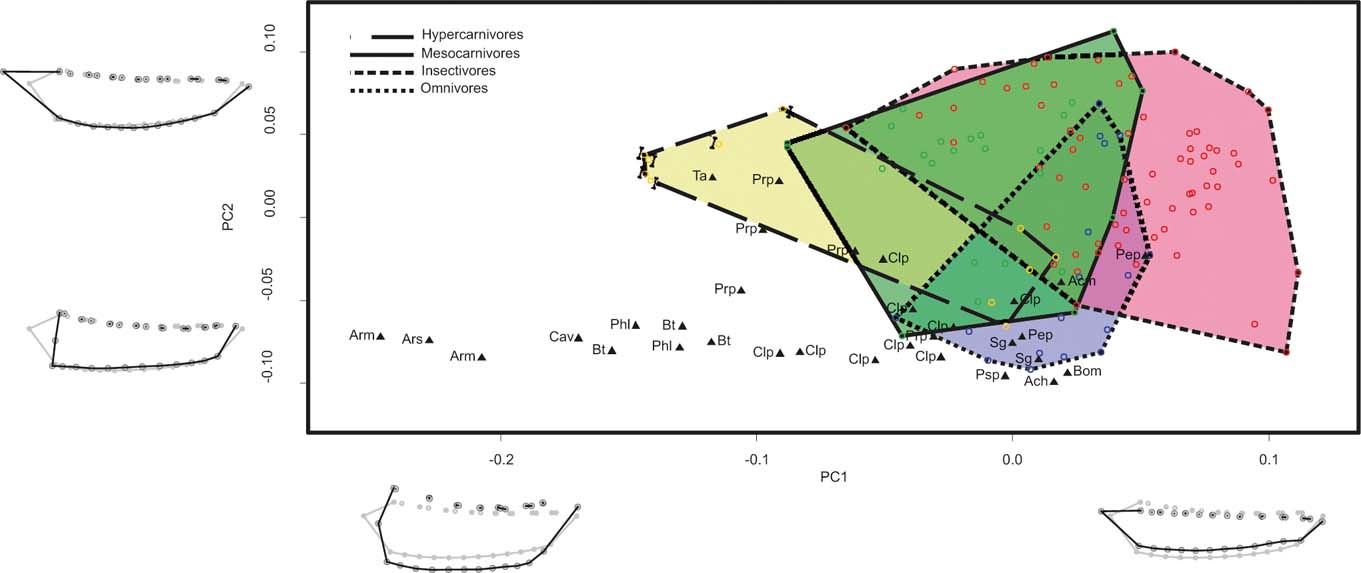
Figure 4 Graph showing the first two axes of between-group principal component analysis of the sample that includes only the mandibular body configuration of metatherians (BODY_MET). Mandible shapes at each end of each axis shown in black; consensus shapes in grey. Abbreviations: Ach = Acyon herrerae; Acm = Acyon myctoderos; Arm = Arctodictis munizi; Ars = Arctodictis sinclairi; Bhm = Borhyaneidium musteloides; Bt = Borhyaena tuberata; Cav = Callistoe vincei; Clp = Cladosictis patagonica; Pep = Perathereutes pungens; Phl = Pharsophorus lacerans; Prp = Prothylacynus patagonicus; Psp = Pseudonitictis pusillus; Sg = Sipalocyon gracilis; Ta = Thylacosmilus atrox. Yellow and long dashed line = hypercarnivores; pale green and continuous line = mesocarnivores; blue and dotted line = omnivores; red and short dashed line = insectivores. Bones indicate ossifragous specimens.
Diet categories were widely overlapped, but in BG-PC1 we observed a trend, where several insectivores had higher BG-PC1 scores than the rest, whilst some hypercarnivores (specimens of Sarcophilus) had lower scores than the remaining specimens (Fig. 4). Sparasodonts mostly shared the BG-PC1 morphospace with hypercarnivores, but some had lower scores in that axis, and most of them showed lower BG-PC2 scores. Cladosictis, Sipalocyon, Acyon and Perathereutes were overlapped with omnivores, mesocarnivores and insectivores (Fig. 4).
2.2. Diet classification
The data set that showed the highest total percentage of correct classification (after cross-validation) in the discriminant analysis was MAND_MET, with 74.74 % of correct classification, followed by BODY_MET with 58.82 %, whilst MAND_TOT only classified correctly 46.39 % of the specimens (Table 1). It is noteworthy that the discriminant analysis of the MAND_MET dataset classified correctly 100 % of the living hypercarnivores, whilst the remaining analyses showed a percentage of correct classification of 71.62 % (MAND_TOT) and 54.54 % (BODY_MET) for that diet category (Table 1). The results shown in Table 1 indicate that these functions are useful to separate hypercarnivores, but not to discriminate the other categories.
Table 1 Confusion matrices of the Discriminant Analyses (AD). MAND_TOT = complete mandible configuration and the whole taxonomic sample explained; MAND_MET = the analysis of the complete mandible configuration of metatherians; BODY_MET = configuration of the mandible body of metatherians; PRCP = percentage of correct posterior reclassification (global percentage shown in bold).
In the discriminant analyses, Ac. myctoderos was classified as a mesocarnivore or omnivore with low-moderate posterior probabilities (PP) and Ac. herrerae was classified as a hypercarnivore with high PP (Table 2). Cladosictis patagonica was classified as an omnivore with high-moderate PP, and as a hypercarnivore with very high PP. Sipalocyon gracilis was classified as an insectivore or omnivore with low-moderate PP, and as a mesocarnivore with very high PP. Borhyaenidium musteloides and Ps. pusillus were classified as omnivores with high PP, whilst Pe. Pungens was classified as a mesocarnivore, omnivore or hypercanivore with low-moderate PP. Large sparassodonts (Arctodictis, Borhyaena, Callistoe, Thylacosmilus and Pharsophorus) were identified as hypercarnivores, mostly with very high PP, but Borhyaena, Callistoe, and Pharsophorus were also classified as mesocarnivores with moderate PP with the MAND_TOT function (Table 2; ).
Table 2 Summary of a posteriori diet classification of fossil species: 1 = analysis of the whole mandible configuration and complete taxonomic sample (MAND_TOT); 2 = analysis that included the whole mandible configuration, but only metatherians (MAND_MET); 3 = analysis restricted to the mandible body configuration of metatherians (BODY_MET). Symbols indicate the posterior probability of assignation for each analysis: ** = 0.99–0.900; * = 0.899–0.800; ^ = 0.799–0.500; ‘ = <0.499. Differences in the percentages or the categories between specimens of the same species are indicated.
2.3. Allometry
In the allometric analysis of the MAND_TOT dataset, size explained 9.38 % of shape variation. Smaller specimens had slender mandibles, with a dorsally displaced condyle, anteriorly displaced carnassials with long talonids and a small canine. Larger specimens had robust mandibles, with a ventrally displaced condyle, large canines and carnassials with a reduced talonid (Fig 5A). The relationship between size and shape was statistically significant; both without taking into account the phylogenetic effect (P < 0.0001) and when including the phylogenetic effect in the PGLS analysis (Wilks' Lambda F = 0.213, P < 0.0001).
Figure 5 Regression graphics between shape and centroid size, and shape variability of the allometric analyses, representing the shape for the zero value of the log of centroid size in grey and the shape of mandible for the two value of the log of centroid size in black. (A) analysis that includes the complete mandible configuration and the whole taxonomic sample explained (MAND_TOT); (B) analysis of the complete mandible configuration of metatherians (MAND_MET); (C) analysis that includes only the configuration of the mandibular body of metatherians (BODY_MET). Filled black circles indicate specimens of Sparassodonta; open black circles indicate specimens of Marsupialia; filled grey circles indicate specimens of Carnivora.
In the allometric analysis of the MAND_MET dataset, size explained 18.30 % of shape variability. The smaller specimens had slender mandibles, with dorsally displaced condyle, small carnassials and small canines; larger specimens had robust mandibles, with ventrally displaced condyle, large canines, large carnassials with reduced talonid, and an incipient symphyseal process (Fig. 5B). The relationship between size and shape was statistically significant when the phylogenetic effect was not considered (P < 0.001), but the PGLS analysis showed a non-significant relationship between size and shape (Wilks' Lambda F = 0.008, P = 0.154).
In the allometric analysis of the BODY_MET dataset, size explained 31.74 % of the shape variability. The smaller specimens showed a dorsoventrally compressed mandibular body, with a posteriorly displaced masseteric fossa, molars with well-developed talonids, and small canines; larger specimens showed a dorsoventrally expanded mandibular body, with an anteriorly displaced masseteric fossa, large molars with a reduced or absent talonid, reduced first premolars and large canines (Fig. 5C). The relationship between size and shape was statistically significant when the phylogenetic effect was not considered (P < 0.001), but when taking the phylogenetic effect into account in the PGLS analysis, a non-significant relationship between size and shape was recovered (Wilks' Lambda F = 0.070, P = 0.766).
3. Discussion
3.1. Reconstruction of dietary habits
The BgPCA and the discriminant analyses showed an overlap between most of the diet categories, hypercarnivores being the category that presented a better separation from the others (Figs 2–4; Table 1). This pattern was found in other studies (e.g., Prevosti et al. Reference Prevosti, Turazzini, Ercoli and Hingst-Zaher2012a) and is to be expected, since most hypercarnivorous species have a very specialised mandibular morphology, with large carnassials with reduced talonids, reduced postcarnassial molars, a robust mandibular body and a ventrally displaced mandibular condyle; whilst groups that eat different items, apart from vertebrates, share a more generalised mandibular shape (Van Valkenburgh Reference Van Valkenburgh and Gittleman1989; Meloro et al. Reference Meloro, Raia, Piras, Barbera and O'Higgins2008; Meloro & Raia Reference Meloro and Raia2010; Prevosti et al. Reference Prevosti, Turazzini, Ercoli and Hingst-Zaher2012a). Overlapping between diet classes could also be influenced by allometric constraints and the phylogenetic legacy, due to evolutionary constraints, as was found in other studies of mandible and skull shape (e.g., Wroe and Milne Reference Wroe and Milne2007; Meloro et al. Reference Meloro, Raia, Piras, Barbera and O'Higgins2008; Meloro & Raia Reference Meloro and Raia2010; Goswami et al. Reference Goswami, Milne and Wroe2011; Prevosti et al. Reference Prevosti, Turazzini, Ercoli and Hingst-Zaher2012a). This overlap had an impact in the discrimination power of the AD functions, which had a moderate or low percentage of global posterior correct reclassification (46–75 %) but, with the exception of the BODY_MET dataset, hypercarnivores had a high percentage of correct reclassification (72 % and 100 %, respectively), and few non-hypercarnivores specimens were classified in this class (<7 %). Thus, even though total percentages of posterior correct reclassification are not very high, these functions, in combination with the distribution of the specimens in the BgPCA, can be used to distinguish hypercarnivores from other diet categories. Another issue that could be affecting the performance of the analyses is the construction of discrete classes from continuous variables such as diet, mainly when the classes do not present a clear separation (e.g., omnivore vs. mesocarnivore). This problem could be exacerbated by the absence of good ecological data for some species and the intraspecific seasonal or geographic variation of diet.
The distribution of sparassodonts in the plots of the BgPCA (Figs 2–4) and their classification with the DAs (Table 2) is evidence that there is a wide variety of mandibular shapes in the group, and that larger genera (Borhyaena, Arctodictis, Callistoe, Pharsophorus, Thylacosmilus and Prothylacynus) were more similar to extant carnivoran hypercarnivores. This can be explained by the fact that large sparassodonts have a short and robust mandibular body, with a ventrally displaced condyle, anteriorly expanded masseteric fossa, and a large carnassial with a reduced talonid, that is displaced posteriorly (Figs 2–4). These morphological traits are interpreted as a specialisation to consume high percentages of meat and hunt prey that could be larger than the carnivore itself (Van Valkenburgh Reference Van Valkenburgh and Gittleman1989; Meloro et al. Reference Meloro, Raia, Piras, Barbera and O'Higgins2008; Meloro & Raia Reference Meloro and Raia2010; Prevosti et al. Reference Prevosti, Turazzini, Ercoli and Hingst-Zaher2012a). A robust mandibular body (i.e., short and high) is good for supporting high stresses (Therrien Reference Therrien2005; Prevosti et al. Reference Prevosti, Turazzini, Ercoli and Hingst-Zaher2012a), which is important when dealing with large prey or processing hard objects such as bones, as was proposed for larger sparassodonts (e.g., Arctodictis; Forasiepi et al. Reference Forasiepi, Goin and Tauber2004, Reference Forasiepi, Babot and Zimicz2015; see also Prevosti et al. Reference Prevosti, Forasiepi, Ercoli, Turazzini, Vizcaíno, Kay and Bargo2012b). Since borhyeanoids have some morphological features (e.g., strong mandible body and premolars) that were interpreted as indicators of ossifragous habits (Forasiepi et al. Reference Forasiepi, Goin and Tauber2004, Reference Forasiepi, Babot and Zimicz2015), we explored the position of the living ossifragous taxa (e.g., Hyaena, Crocuta, Gulo, Sarcophilus) in our analyses. In the MAND_TOT analysis, ossifragous species are placed overlapped with hypercarnivores and some mesocarnivores and omnivores, but towards the negative end of the hypercarnivore distribution in both axes. That morphospace is shared with derived borhyaenoids (Fig. 2; e.g., Borhyaena, Callistoe, Pharsophorus, Prothylacynus). Something similar can be seen in the analyses that only included Metatherians, where the extant Sarcophilus is overlapped with those taxa in the first axis (Figs 3, 4). These observations suggest that derived borhyaenoids could have been hypercarnivores, with the capacity to consume carcasses and crack bones, similar to the living Crocuta or Sarcophilus.
Contrary to larger species, hathliacynids shared the morphospace with non-hypercarnivorous species (omnivores, insectivores and mesocarnivores), mostly due to their longer and slender mandibular body (Figs 2–4). Consequently, the discriminant analyses classified most hathliacynids as omnivores or mesocarnivores. However, Acyon herrerae, and some specimens of Cladosictis, were also identified as hypercarnivores (Table 2; ), something that could be indicating that these species had a tendency to consume more meat than other hathylacinids (as was supported by other studies; Prevosti et al. Reference Prevosti, Forasiepi, Ercoli, Turazzini, Vizcaíno, Kay and Bargo2012b, Reference Prevosti, Forasiepi and Zimicz2013) or, in the case of Cladosictis, indicating intraspecific variability in the diet. Therefore, hathliacynids had less carnivorous diets than the borhyaenoids studied here, and probably (mainly due to the shape of their mandible and their body size) did not hunt frequently on prey larger than themselves (see Ercoli et al. Reference Ercoli, Prevosti and Forasiepi2014). Dasyurus spp. (e.g., D. maculatus) could be a good model for these sparassodonts, because it has a mesocarnivore diet and generally hunts prey smaller than its own body mass (Strahan Reference Strahan1995; Attard et al. Reference Attard, Parr, Wilson, Archer, Hand, Rogers and Wroe2014).
Our results are mostly congruent with the palaeoecological interpretation of Marshall (Reference Marshall1978), who concluded that sparassodonts had different degrees of feeding adaptations, with a trend towards a specialisation on a carnivorous and hypercarnivorous diet. Marshall (Reference Marshall1978) considered hathliacynids and basal borhyaenoids (e.g., Pr. patagonicus) as predominantly omnivorous, but Argot (Reference Argot2003b), based on the morpho-functional analysis of postcranial elements, inferred that Pr. patagonicus was an active predator with ambush habits; an interpretation that is in agreement with our results (Pr. patagonicus was classified as a hypercarnivore in the DA).
In recent studies based on a dental morphometric index (relative grinding area (RGA) of the fourth lower molar) all the sparassodonts studied here fall into the hypercarnivore category (Prevosti et al. Reference Prevosti, Forasiepi, Ercoli, Turazzini, Vizcaíno, Kay and Bargo2012b, Reference Prevosti, Forasiepi and Zimicz2013; Zimicz Reference Zimicz2014), whilst we found omnivorous or mesocarnivorous diets for some species. It is possible that the agreement between Marshall's (Reference Marshall1978) results and ours is because the geometric morphometric analyses conducted here captured the same morphological traits that Marshall used. Indeed, it is not clear why our results were so different from the analyses based on the RGA index, mainly because we included landmarks from the lower carnassial in our analyses. One possible explanation is that since the lower carnassial represents a small subset of landmarks in the global configuration of the mandible, the changes of the mandibular shape as a whole subordinated the morphological differences of the carnassials (i.e., any changes in the carnassial will be very small compared to changes in each part of the mandible), reducing its impact in diet discrimination. This is combined with the fact that hathliacynids have a mandibular morphotype that is not commonly present in living predators, which combines a relatively long and slender mandibular body with a carnassial with a reduced talonid. Thus, it is possible that hathliacynids were in fact more carnivorous than here inferred, and that mandible shape is more related to other factors such as prey size. The latter interpretation agrees with the interpretation of Ercoli et al. (Reference Ercoli, Prevosti and Forasiepi2014), who concluded that hathliacynids of the Santa Cruz Formation hunted on small prey, but that borhyaenoids could prey more frequently on vertebrates larger than themselves.
The three datasets analysed here also allowed us to explore the use of samples that include different morphotypes (more limited in the ones that includes only metatherians), the inclusion of more distant lineages (i.e., Carnivora in the MAND_TOT sample), and the possibility of classifying more incomplete fossils (BODY_MET). It is clear that MAND_MET is the best discriminant function (Table 1) for living species with known diet, but several sparassodonts were placed outside the morphospace of the living taxa used to construct this function (Fig. 3), something that could bias the classifications because fossils could belong to a category not covered by any of the living species included (see Reyment et al. Reference Rement, Blackith and Campbell1984; Legendre & Legendre Reference Legendre and Legendre1998). This problem is not present in the analysis based on the MAND_TOT dataset (Fig. 2). On the other hand, the analysis of only the mandibular body (BODY_MET) allowed us to include incomplete fossils of other species such as Borhyaenidium musteloides, Acyon herrerae, and Pseudonotictis pusillus. Moreover, the inclusion of more landmarks in this analysis let us contemplate other morphological features for the inferences (Fig. 4; Table 2).
3.2. Mandible shape, body size, carnassial shape and sparassodont evolution
The allometric and multivariate analyses presented here, and the positive significant relation between the first axis of the analyses and the centroid size, showed a correlation between mandible size and shape (Figs. 2–5). A covariance of carnassial shape, dental morphology and body size has been reported previously by several authors (Marshall Reference Marshall, Hecht, Goody and Hecht1977a, Reference Marshall1978, Reference Marshall1979, Reference Marshall1981; Forasiepi Reference Forasiepi2009; Prevosti et al. Reference Prevosti, Forasiepi, Ercoli, Turazzini, Vizcaíno, Kay and Bargo2012b, Reference Prevosti, Forasiepi and Zimicz2013; Ercoli et al. Reference Ercoli, Prevosti and Forasiepi2014), since taxa with short and robust mandibles were shown to have large body sizes and molars with extremely reduced talonids (RGA near 0). On the contrary, smaller taxa have longer and slender mandibles, and molars with more developed talonids (Marshall Reference Marshall, Hecht, Goody and Hecht1977a, Reference Marshall1978, Reference Marshall1979, Reference Marshall1981; Forasiepi Reference Forasiepi2009; Prevosti et al. Reference Prevosti, Forasiepi, Ercoli, Turazzini, Vizcaíno, Kay and Bargo2012b, Reference Prevosti, Forasiepi and Zimicz2013). The morpho-functional diversity of sparassodonts is also related to the phylogenetic relationships of the group, because most of the small species, with generalised mandibles, are basal sparassodonts or hathliacynids, and the larger species, with shorter and robust mandibles, are borhyaenoids (see also Forasiepi Reference Forasiepi2009). The strong influence of the phylogenetic legacy in the relationship between shape, diet and size can also be observed in the shape–size regression of whole metatherian analyses (Fig. 5). The significant relationship between shape and size changed to non-significant levels when phylogeny was taken into account, suggesting that the associated changes in shape and size follow the structure of the phylogenetic relationships, occurring together in specific clades. The phylogenetic structure of mandible size and shape also indicates that ecological factors (diet in this case) have influenced the evolution of Sparassodonta, since more carnivore habits were derived changes of borhyaenoids. On the other hand, smaller and slender mandibles could be indirectly conditioned by the predominant scansorial locomotion habits of hathliacynids (e.g., Cladosictis, Sipalocyon, Pseudonotictis) since scansorial and arboreal mammals tend to be small-bodied (Van Valkenburgh 1987; Argot Reference Argot2003b, Reference Argot2004c; Ercoli et al. Reference Ercoli, Prevosti and Álvarez2012). The association of large body sizes and more carnivorous habits was also found in the evolution of some groups of placental carnivores (Felidae and Canidae; Carbone et al. Reference Carbone, Mace, Roberts and Macdonald1999; Van Valkenburgh et al. Reference Van Valkenburgh, Wang and Damuth2004), and could be explained by metabolical constraints, because species larger than 15–25 kg (Carbone et al. Reference Carbone, Mace, Roberts and Macdonald1999, Reference Carbone, Teacher and Rowcliffe2007) are mostly obligated to hunt on larger prey. This constraint could explain the covariation of mandibular size, body size and mandibular shape observed in sparassodonts, and could be one of the factors that controlled the diversification and morphological evolution of sparassodonts.
Some species not included in our analyses because their fossils were too fragmentary, such as Stylocynus and Lycopsis, apparently escape this pattern of covariation between size, mandible shape and carnassial shape. Although they have a relatively large body size and a long and slender mandibular body, the RGA index for Stylocynus indicates that it was an omnivore or mesocarnivore, whilst for Lycopsis, the index has higher values than other borhyaenoids (Prevosti et al. Reference Prevosti, Forasiepi, Ercoli, Turazzini, Vizcaíno, Kay and Bargo2012b, Reference Prevosti, Forasiepi and Zimicz2013). The new borhyaenid described by Engelman & Croft (Reference Engelman and Croft2014) could be another exception, because it has a small body size, hypercarnivore habits and a short rostrum that could be correlated with a mandible with a short and robust body (something that it is not possible to corroborate because it is only known from cranial remains). These exceptions show that sparassodonts had a wide variability of ecomorphs, something that agrees with the disparity observed in living carnivorans, which include large omnivores and small carnivores with similar morphologies (e.g., Prevosti et al. Reference Prevosti, Turazzini, Ercoli and Hingst-Zaher2012a).
The analyses performed here suggest that Sparassodonts have less disparity in the mandibular shape and smaller ecological amplitude than Carnivora, as was recently tested and linked to evolutionary and functional constraints (Echarri & Prevosti Reference Echarri and Prevosti2015; see also Werdelin Reference Werdelin1987; Prevosti et al. Reference Prevosti, Forasiepi, Ercoli, Turazzini, Vizcaíno, Kay and Bargo2012b). Sparassodont also appear to have less mandibular shape disparity than the extant marsupials used here as potential living analogues; but this should be tested with other methods, since the between-group PCA cannot be used to test this, and also the difference in sample size could bias the comparison (see Echarri & Prevosti Reference Echarri and Prevosti2015).
Finally, our results could be relevant to the discussion of the existence of competence between the last sparassodonts and the first Carnivora that invaded South America in the Late Miocene (see Prevosti et al. Reference Prevosti, Forasiepi and Zimicz2013; Zimicz Reference Zimicz2014), because some species could be less carnivorous than previously thought. For example, Borhyaenidium musteloides could be omnivorous, as were the first South American carnivorans (i.e., Cyonasua). However, these changes do no alter the main pattern described in previous papers (see Prevosti et al. Reference Prevosti, Forasiepi and Zimicz2013; Zimicz Reference Zimicz2014), because this sparassodont is smaller than Cyonasua or Chapalmalania (1.6 vs >6 kg, respectively), and its dentition is much less specialised to an omnivorous diet (Cyonasua and Chapalmalania have very few effective shearing crests on their molars) (Prevosti et al. Reference Prevosti, Forasiepi and Zimicz2013; Prevosti & Pereira Reference Prevosti and Pereira2014).
4. Conclusions
The mandible shape of Sparassodonta species suggests a hypercarnivore diet for borhyaenoids, whilst hathliacynids could have had less carnivorous diets (omnivores or mesocarnivores). Our results also showed differences with the diets inferred using the RGA index (relative molar grinding area), which assigned all the studied sparassodonts to the hypercarnivore class. Alternatively, mandible shape could be related to relative prey size, and species with shorter and robust mandibles could have preyed on larger prey (similar or larger than their own body size) and taxa with long and slender mandibles could have hunted only small prey, as was recently proposed for the Santacrucian fauna (Ercoli et al. Reference Ercoli, Prevosti and Forasiepi2014).
The shape of the mandible of Sparassodonta is covariate with body size and molar morphology, since larger taxa have lower molars with reduced talonids (RGA near 0) and short and robust mandibles, whilst smaller species present the opposite pattern (larger but still hypercarnivore RGA values, and longer and slender mandibles). This pattern is congruent with the phylogenetic placement of those species, suggesting that ecological factors have influenced the evolution of the sparassodonts. The metabolic constraint on the diet of large species, which was described in Carnivora (Carbone et al. Reference Carbone, Mace, Roberts and Macdonald1999, Reference Carbone, Teacher and Rowcliffe2007; Van Valkenbugh et al. 2004), could be involved in the correlation between mandible size and diet that we found, as well as in the evolutionary history of Sparassodonta.
5. Acknowledgments
We thank the curators who helped during visits to museum collections: I. Olivares, D. Verzi, M. Reguero, L. Pomi, A. Kramarz, B. Simpson, R. MacPhee, B. Patterson, M.-T. Schulenberg, J. Flynn, R. van Zelst, G. Veron, J. Galkin, W. Stanley, L. Gordon, W. Joyce, V. Segura and D. Flores. J. Babot and A. Forasiepi allowed us to include specimens under their study in our analysis. S. Vizcaíno, S. Bargo and R. Kay allowed us to study new sparassodont specimens collected in the Santa Cruz Formation. Our thanks to S. Vizcaíno for inviting us to participate in this Special Issue, based on our presentation at the Symposium “Form, Function and Palaeobiology” held during the 4th International Paleontological Congress. N. Zimicz and L. Werdelin provided useful comments that helped improve the manuscript. CONICET, the American Museum of Natural History, the Field Museum of Natural History and the Florida Museum of Natural History provided collection study grants to FJP. Partial financial support was provided by CONICET (PIP 2011-0164), ANPCyT (PICT 2011-309), UNLU (Disp. CDD-CB 328-14), FCNyM-UNLP (N474), and NSF (0851272, 0824546).


