


Insulin resistance is a central feature in the clustering of metabolic risk factors that predispose to an increased risk of CVD and type 2 diabetes. Reducing SFA intake, through diets either low in fat or high in MUFA has been shown to improve insulin sensitivity (Si) with supervised meals(Reference Perez-Jimenez, Lopez-Miranda and Pinillos1). In free-living individuals, whilst Si was significantly impaired on a high SFA intake, the beneficial effect of substituting dietary MUFA was only shown with a total fat intake <38% energy (%E)(Reference Vessby, Unsitupa and Hermansen2). Diets with a low glycaemic index (GI) may also improve Si but there is limited evidence for their efficacy(Reference Frost, Leeds, Trew, Margara and Dornhorst3, Reference Aston, Bluck, Stokes, Jackson, McKenna and Jebb4).
RISCK is a multi-centre randomised controlled dietary intervention study in subjects at increased risk of metabolic syndrome (MS)(Reference Jebb, Frost, Griffin, Jebb, Sanders and Lovegrove5). Over a 24-week period subjects followed a high-SFA (HS)–high-GI (HGI) ‘reference’ diet or one of four isoenergetic interventions: high-MUFA (HM)–HGI; HM–low-GI (LGI); low-fat (LF)–HGI; LF–LGI. The target intake for total fat was 38%E in the HS and HM diets and 28%E in the LF diets, with respective carbohydrate (CHO) intakes of 45 and 55%E. The HM and LF diets were designed to reduce dietary SFA to 10%E with a planned MUFA intake of 18%E in the HM diets. The target GI differential between the HGI and LGI groups was approximately 12 points. Dietary targets were broadly achieved with clear segregation between diets(Reference Moore, Farrant, Gitau, Goff, Griffin, Lewis and Lovegrove6). An intravenous glucose tolerance test (IVGTT) was conducted at 0 (visit 1) and 24 (visit 2) weeks of the intervention. Modelling of the IVGTT data (MINMOD Millennium programme, version 6.02) was used to calculate Si and other variables of glucose metabolism. Quantitative insulin-sensitivity check index (QUICKI) was calculated from fasting measures of glucose and insulin.
A total 548 of 720 participants completed the study; thirty-eight subjects were excluded from the analysis because of incomplete IVGTT data (n 4) or unsuccessful modelling of data (n 34). There were no significant effects of the intervention on Si or other variables of glucose metabolism.
Table. Mean changeFootnote * in measures of insulin sensitivity, glucose disposal (Sg) and insulin secretion (AIRg)
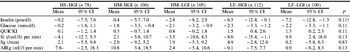
* Calculated on transformed scale, but expressed as % change from median value at visit 1. Outliers first removed (transformations: log (glucose), log (insulin), 1/QUICKI, 1/RQUICKI, log(Si), 3√(AIRg)).
† From ANCOVA of visit 2 measure on visit 1 measure adjusted for gender, centre, ethnicity, waist, log(HDL), age.
In the present study isoenergetic manipulation of the proportion of fat and CHO, the proportion of SFA and MUFA or the GI of the diet does not have a major effect on Si in subjects at increased risk for MS.
The RISCK study was funded by the Food Standards Agency (NO2031).

