


Vitamin D research has gained a high profile in the past few decades, mainly because of increased recognition of widespread vitamin D deficiency in many different populations( Reference Hanley and Davison 1 – Reference Holick 2 ). The RDA for vitamin D recommended by the Institute of Medicine (IOM) is based on dietary levels to achieve optimal musculoskeletal health( 3 ). However, many other adverse effects have been recently correlated with vitamin D deficiency including cancer, CVD, autoimmunity, diabetes, osteoarthritis, depression and lung dysfunction( Reference Garland, Kim and Burgette 4 – Reference Pilz, Verheyen and Grubler 8 ). The blood levels required to maintain optimal health outside the musculoskeletal system are uncertain. For example, the lowest incidences of cancer seem to occur at high blood vitamin D levels( Reference McDonnel, Baggerly and French 7 ), whereas the potential for adverse effects in other systems such as CVD and allergy at these high blood levels remains uncertain( Reference Grant, Karras and Bischoff-Ferrari 6 , Reference Pilz, Verheyen and Grubler 8 ).
Vitamin D deficiency can be prevented through adequate sun exposure. However, vitamin D cannot be synthesised via sunlight exposure from November to February in most parts of North America, because of poor angle of the sun, low-intensity UVB and short daylight hours( Reference Sharma, Barr and Macdonald 9 ). Even in equatorial latitudes or in northern parts in summer, an increasingly urban, indoor lifestyle plus sunscreen use likely prevent adequate synthesis( Reference Holick and Chen 10 ). The current Canadian and American nutritional clinical definition of inadequate is <75 nmol/l of plasma 25-hydroxy vitamin D (25(OH)D)( 3 ), but definitions in the scientific community range from <40( Reference Hanley and Davison 1 ) to <100 nmol/l( Reference Garland, Gorham and Mohr 11 ). Higher 25(OH)D levels of 75–110 nmol/l have previously been suggested to provide optimal outcomes for musculoskeletal, cardiovascular and cancer health( Reference Bischoff-Ferrari, Willett and Wong 12 , Reference Souberbielle, Body and Lappe 13 ), whereas more recent review of evidence suggests no clear evidence of benefit between 75 and 125 nmol/l and caution at levels >125 nmol/l( Reference Pilz, Verheyen and Grubler 8 ). Plasma 25(OH)D levels <30 nmol/l are associated with excess risk of cardiovascular events such as myocardial infarction, hypertension, stroke, heart failure and sudden cardiac death, when compared with levels of 75–100 nmol/l in humans( Reference Giovannucci, Liu and Hollis 14 – Reference Kunutsor, Apekey and Steur 18 ), whereas other studies have found inconsistent associations( Reference Pilz, Verheyen and Grubler 8 , Reference Scragg, Slow and Stewart 19 , Reference Van Ballegooijen, Gansevoort and Lambers-Heerspink 20 ). Vitamin D deficiency was not associated with carotid-intimal thickness or atherosclerotic plaque size, suggesting vitamin D may not influence atherogenesis( Reference Blondon, Sachs and Hoofnagle 21 , Reference Deleskog, Piksasova and Silveira 22 ). However, the totality of observational and interventional studies examining the influence of vitamin D levels on cardiovascular health in humans reveals a fairly consistent finding. Systolic blood pressure increases by 2–6 mmHg when vitamin D levels are deficient, with little or no effect on diastolic pressure( Reference Pilz and Tomaschitz 23 ). Another large meta-analysis study showed that for every incremental 25 nmol/l increase in 25(OH)D levels, there was a 12 % lower risk for hypertension( Reference Kunutsor, Apekey and Steur 18 ). Evidence suggests that arterial stiffness, which can be measured with peak carotid systolic blood velocity using ultrasound, may be a primary mechanism linking vitamin D deficiency with systolic hypertension( Reference Christakos, Dhawan and Verstuyf 5 , Reference Kruger, Kruger and Doak 24 , Reference Reynolds, Haque and Berry 25 ). Arterial stiffness is considered the major cause of increased systolic blood pressure and pulse pressure, while at the same time tending to decrease diastolic blood pressure with advancing age( Reference O’Rourke, Staessen and Vlachopoulos 26 – Reference Al Mheid, Patel and Murrow 28 ). Confirming studies in rodent models show a causal relationship between vitamin D deficiency and high blood pressure( Reference Christakos, Dhawan and Verstuyf 5 , Reference Weng, Sprague and Oh 29 , Reference Sundersingh, Plum and DeLuca 30 ). Although vitamin D deficiency is clearly associated with increased systolic blood pressure and arterial stiffness, few studies support the upper limit for vitamin D, particularly regarding cardiovascular outcomes.
Increased vitamin D supplementation seems to be an increasing trend to help prevent not only musculoskeletal disorders but also cancer, inflammatory conditions and now CVD( Reference Christakos, Dhawan and Verstuyf 5 , Reference Grant, Karras and Bischoff-Ferrari 6 ). Many epidemiological studies have confirmed that low vitamin D poses health risks (( Reference Grant, Karras and Bischoff-Ferrari 6 ) reviewed in ( Reference Pilz, Verheyen and Grubler 8 )), so too may excessively high levels( Reference Sundersingh, Plum and DeLuca 30 – Reference Dror, Giveon and Hoshen 32 ). Some studies have suggested that vitamin D may have a non-linear dose–response curve for most of its effects( Reference Zittermann, Iodice and Pilz 33 , Reference Wang, Pencina and Booth 34 ), resembling a reverse J-shape or possibly a U-shape( Reference Sundersingh, Plum and DeLuca 30 ), but more recent meta-analyses and epidemiological studies cast doubt on this relationship( Reference Grant, Karras and Bischoff-Ferrari 6 , Reference Pilz, Verheyen and Grubler 8 , Reference Van Ballegooijen, Gansevoort and Lambers-Heerspink 20 ). However, the active metabolite of vitamin D, 1,25-dihydroxy vitamin D, is generally not measured because of its inconsistent relationship with vitamin D status( Reference Christakos, Dhawan and Verstuyf 5 ); a recent study suggests that increasingly high levels of this active metabolite is associated with increased risk of hypertension, whereas the converse is true for 25(OH)D( Reference Van Ballegooijen, Gansevoort and Lambers-Heerspink 20 ). Blood levels of 25(OH)D in humans rarely reach the upper safe limit or no observed adverse effects level (NOAEL) of 220–250 nmol/l proposed by a consensus of experts in 2010 and in a risk assessment for vitamin D( Reference Souberbielle, Body and Lappe 13 , Reference Hathcock, Shao and Vieth 35 ). Most recent epidemiology and meta-analysis studies report only a few data points above 100 nmol/l and none above 175 nmol/l of 25(OH)D( Reference Garland, Kim and Burgette 4 , Reference Grant, Karras and Bischoff-Ferrari 6 – Reference Pilz, Verheyen and Grubler 8 , Reference Van Ballegooijen, Gansevoort and Lambers-Heerspink 20 ). Incidence of 25(OH)D levels >160 nmol/l was recently reported to be <2 % in the general Spanish population( Reference Pérez-Barrios, Hernández-Álvarez and Blanco-Navarro 36 ), leaving uncertainty regarding potential adverse effects at higher levels. Risk assessment for the NOAEL for vitamin D blood levels was based exclusively on hypercalcaemia( Reference Hathcock, Shao and Vieth 35 , Reference Vieth 37 ). The fundamental assumption was that all adverse effects associated with excess vitamin D, including vomiting, anorexia, soft tissue calcification, kidney stones and hypertension, are due to the primary causative factor of hypercalcaemia( Reference Hathcock, Shao and Vieth 35 ). However, all-cause mortality and acute coronary syndrome were recently reported to increase at levels that did not produce hypercalcaemia( Reference Sundersingh, Plum and DeLuca 30 – Reference Dror, Giveon and Hoshen 32 ).
In addition to confirming a cause–effect relationship between vitamin D deficiency and hypertension, there is a need to better delineate the relationship between hypercalcaemic effects of high 25(OH)D and adverse effects on the cardiovascular system. In order to address these problems, the aim of this study was to use a normal rat model to examine the effect of different dietary levels of cholecalciferol from deficiency through to toxicity on cardiovascular function. We hypothesise that rats with both high and low plasma 25(OH)D levels will have adverse cardiovascular effects, specifically increased arterial stiffness and systolic hypertension, compared with rats with adequate 25(OH)D levels. High-resolution ultrasound and intravascular blood pressure telemetry were used to monitor changes in blood pressure, as well as cardiac and vascular structure and function, in rats over 4 weeks of test diets. These changes were then related to plasma 25(OH)D, Ca and phosphate levels.
Methods
Study materials
A total of sixty-four male Wistar rats (346 (sd 0·1) g) (Charles River) were housed individually under standard conditions, acclimatised and handled in the animal care unit for 1 week before initiation of the study. Test diets were a vegetarian-based rodent diet in order to prevent any vitamin D in the diet other than what was added exogenously. Therefore, the zero vitamin D test diet contained 0 mg/d vitamin D (Harlan Laboratories; see Table 1 for composition of diets) and was used to create vitamin D deficiency in rats fed this diet for 4 weeks. In addition to the deficiency diet, three different amounts of cholecalciferol were added to this base diet for a total of four test diets. Test diets had the rat equivalent to human daily intake values of 0 (deficiency), 0·015 RDA, 0·25 (NOAEL) and 3·75mg/d (probable toxic level and used as a positive control dose). Human equivalent doses were converted to rat doses using a 0·75 exponential coefficient to correct for differences in body size and surface area. This exponent correction is commonly used to account for differences in metabolic rate between humans and small mammals( Reference Sharma and McNeill 38 ). Thus, the actual cholecalciferol contents in a 1 kg diet were 0, 0·01, 0·168 and 2·5mg cholecalciferol for these diets (Table 1). During acclimatisation, regular rodent rat chow (ProLab Rat, Mouse, Hamster 3000 with 0·06mg/kg vitamin cholecalciferol) was fed. Baseline reading of rats was performed on day −1, before beginning the test diets. Rats (n 18 rat/group) were fed test diets for a period of 4 weeks, which is considered to be equivalent to 28 months in human’s life( Reference Andreollo, Dos Santos and Araújo 39 ). All protocols and procedures were approved by the Animal Care and Use Council at the University of Saskatchewan in accordance with the Canadian Council on Animal Care guidelines and conformed to ARRIVE guidelines for reporting animal research.
Table 1 The test diets used in the current rat vitamin D experiment are all based on the Teklad Global 18 % protein rodent diet (no. 2018; Harlan Laboratories)Footnote *
* This diet uses vegetarian sources to minimise vitamin D addition from animal source ingredients, thereby limiting vitamin D to the added amounts indicated below for our four test diets.
† Ether extract is used to measure fat in pelleted diets, whereas an acid hydrolysis method is required to recover fat in extruded diets. Compared with ether extract, the fat value for acid hydrolysis will be approximately 1 % point higher.
‡ Carbohydrate (available) is calculated by subtracting neutral detergent fibre from total carbohydrates.
§ Neutral detergent fibre is an estimate of insoluble fibre, including cellulose, hemicellulose and lignin. Crude fibre methodology underestimates total fibre.
|| Energy density is a calculated estimate of metabolisable energy based on the Atwater factors assigning 17 kJ/g (4 kcal/g) to protein, 38 kJ/g (9 kcal/g) to fat and 17 kJ/g (4 kcal/g) to available carbohydrate.
¶ Indicates added amount but does not account for contribution from other ingredients.
Laboratory analyses
Blood samples were collected by cardiac puncture under isoflurane anaesthesia at termination into heparinised tubes. Plasma was separated by centrifuging the blood at 4000 rpm for 20 min at 4°C and stored in a −80°C freezer for subsequent analysis. Plasma Ca, phosphate and 25(OH)D levels were measured using a calcium assay kit (Cayman Chemical Co.; intra-assay variability=4·6 %, inter-assay variability=5·1 % in our hands), phosphate colorimetric assay kit (BioVision; intra-assay variability=7·1 %, inter-assay variability=14·5 %) and 25-OH-Vitamin D ELISA kit (Eagle Biosciences Inc.; intra-assay variability=9·4 %, inter-assay variability=15·9 %). All kits were developed for use in human plasma, but as free Ca, free phosphate and 25(OH)D are chemically identical across species no species differences are anticipated. For the 25(OH)D ELISA, the company reports a 100 % cross-reactivity with 25(OH)D2 and 25(OH)D3, whereas cross-reactivities with D3 (cholecalciferol), D2 (ergocalciferol) and 24,25(OH)D3 were all reported to be <0·05 % (Eagle Biosciences Inc.). Spike-recovery for the vitamin D ELISA was determined to be 98 (sd 5) % (n 3 determinations) in preliminary experiments with rat plasma, indicating negligible nonspecific cross-reactivity in our rat samples and good assay performance.
Blood pressure measurements
A sub-sample of rats from each treatment group (n 8 rats/group) was surgically implanted with blood pressure radiotelemetry devices, as described previously from this laboratory( Reference Gentner and Weber 40 ). Blood pressure was measured in only a sub-sample of rats because of high monetary and man-power costs associated with the blood pressure telemetry technique. In brief, PA-C10 radio-telemetry transmitter (Data Sciences International) was implanted into the femoral artery and advanced towards the iliac artery with the transmitter body placed subcutaneously in the left flank using appropriate isoflurane anaesthesia and buprenorphine for analgesia. Rats were allowed to recover from surgery for 5–7 d before baseline testing, followed by initiation of test diets. During the recovery and subsequent test diet feeding periods, implant batteries failed for two rats (one in 0·015mg/d and one in 0·25mg/d group) or slipped out of the artery mid-testing in the case of one rat (in the 0·015mg/d group). We were able to retain these three rats for the duration of the study for all other aspects (ultrasound, blood work and organ weights), but not blood pressure data. Thus, final sample sizes for blood pressure end points were n 6–8 rats/treatment group. Blood pressure (systolic and diastolic blood pressure, pulse pressure and pulse rate) was recorded for 24 h (5 min of sampling/h per rat) at the baseline and weekly during the 4 weeks of test diet feeding in freely moving rats within their home cages without any anaesthesia or sedation.
Cardiac B-mode and carotid Doppler ultrasonography
Ultrasonography was done using a VEVO 770 (Visualsonics Fujifilm) under anaesthesia (isoflurane 5 % for induction and 3 % for maintenance) according to the methods previously described from this laboratory( Reference Wildemann, Mirhosseini and Siciliano 41 ). B-mode echocardiography was performed in one long axis and three separate short axes, and then left ventricular volumes were calculated using Simpsons rule and values were obtained from VEVO 770 analysis software. Mean values for end-systolic and end-diastolic volumes were used from a minimum of three separate measurements from each rat at each time point. Stroke volume was calculated by subtracting end-diastolic volume from end-systolic volume. Cardiac output was computed by multiplying stroke volume with pulse rate. Ejection fraction was calculated by dividing stroke volume by end-diastolic volume and expressed as percentage. Using a long-axis view, left ventricular free wall thickness was measured in exported still images taken from cine loops during systole and diastole using ImagePro 6.0 software (Media Cybernetics). B-mode ultrasound was also performed on the carotid artery, with luminal diameter and wall thickness measured at the point just before bifurcation of the artery using ImagePro 6.0 software. Average luminal diameter was measured in frames with the narrowest diameter (corresponding to diastole). Doppler ultrasound was then performed on the carotid artery to measure peak carotid systolic blood velocity. In all cases, mean values from a minimum of three separate measurements were used to generate values for each rat at a given time point. Ultrasonography was done at the baseline and at the end of test diets (week 4). Of the telemetry-implanted rats, only n 4 rats/group were subjected simultaneously to carotid artery ultrasound measurements, thereby allowing calculation of two indicators of arterial stiffness( Reference Turk, Pretnar-Oblak and Zupan 42 ), the β-arterial stiffness index and arterial elasticity (Ep). These parameters were calculated as follows, where Ps is the systolic pressure, Pd the diastolic pressure, Dd the carotid diameter during diastole and Ds the carotid diameter during systole
 $$\eqalignno{ & \beta \,{\equals}\,{\rm ln}{{\left( {Ps\,/\,Pd} \right)} \mathord{\left/ {\vphantom {{\left( {Ps\,/\,Pd} \right)} {\left( {\left( {Ds-Dd} \right)\,/\,Dd} \right)}}} \right. \kern-\nulldelimiterspace} {\left( {\left( {Ds-Dd} \right)\,/\,Dd} \right)}} \cr & Ep\,{\equals}\,{{\left( {Ps-Pd} \right)} \mathord{\left/ {\vphantom {{\left( {Ps-Pd} \right)} {\left( {\left( {Ds-Dd} \right)\,/\,Dd} \right)}}} \right. \kern-\nulldelimiterspace} {\left( {\left( {Ds-Dd} \right)\,/\,Dd} \right)}}. $$
These parameters were calculated in addition to the percentage dilation of the carotid artery with each pulse
 $$\,\%\,{\rm Dilation}\,{\equals}\,100\,{\times}\left( {\left( {Ds-Dd} \right)\,/\,Dd} \right).$$
Statistical analysis
Data were analysed using SPSS (IBM SPSS Statistics for Windows, version 20.0.; IBM Corp.). All data were expressed as mean values and standard deviations. All data were tested for and passed assumptions for parametric statistics, namely normality and homogeneity of variance using Shapiro–Wilk and Levene’s test, respectively, except for β and Ep. Pre-exposure (baseline) blood pressure, carotid diameter, wall thickness and peak carotid systolic blood velocity values were subtracted from post-exposure values at 4 weeks of diet treatment in the same individual to determine the treatment effects. This approach was done to minimise the effect of variation among individual rats in baseline values. All organ weights and tissue sizes were corrected by body weight, before using in ANOVA analysis. Differences among groups were detected using repeated measure ANOVA for blood pressure values. For carotid diameter and thickness, carotid systolic blood velocity, cardiac function and percentage carotid artery distensibility values, and one-way ANOVA followed by Tukey’s post hoc tests, as appropriate, were used to determine differences among treatment groups. For carotid artery β-arterial stiffness index and Ep, non-parametric Kruskall–Wallis tests followed by pairwise comparison with Dwass–Steel–Critchlow–Fligner tests were used. The α level was set at P<0·05 and a 95 % CI.
Results
A total of sixty-four rats, with average initial body weight of 346 (sd 0·1) g (see Table 2 for all rat baseline information), were used in this study. No differences among treatment groups were detected at baseline – that is before feeding test diets – and Table 2 data show results for all groups combined before treatment. The average daily cholecalciferol consumed per rat was 0, 0·33, 5·45 and 82·73µg/d, respectively, over the 4 weeks, which is roughly equivalent to 0 (deficiency), 0·015 (control), 0·25 (NOAEL) and 3·75 (probably toxic level) mg/d in humans (Table 3). After 4 weeks of test diets, the control group had a plasma 25(OH)D level of 43 nmol/l, with the 25(OH)D plasma level in the deficiency group being lower but non-significant at 30 nmol/l (Table 3). The plasma 25(OH)D for the NOAEL group was significantly higher at 108 nmol/l than the control group after 4 weeks (Table 3). However, the toxicity group had significantly higher 25(OH)D levels than all other groups at 561 nmol/l after 4 weeks (Table 3). For all graphs in this study, data are presented with these mean plasma 25(OH)D values as labels for each treatment group (Figs. 1–3). Despite these significant changes in plasma 25(OH)D, both plasma Ca and plasma phosphate did not differ significantly among treatment groups (Table 3). Importantly, no hypocalcaemia was observed with deficiency and no hypercalcaemia was observed with toxicity after 4 weeks of test diet feeding in these rats.
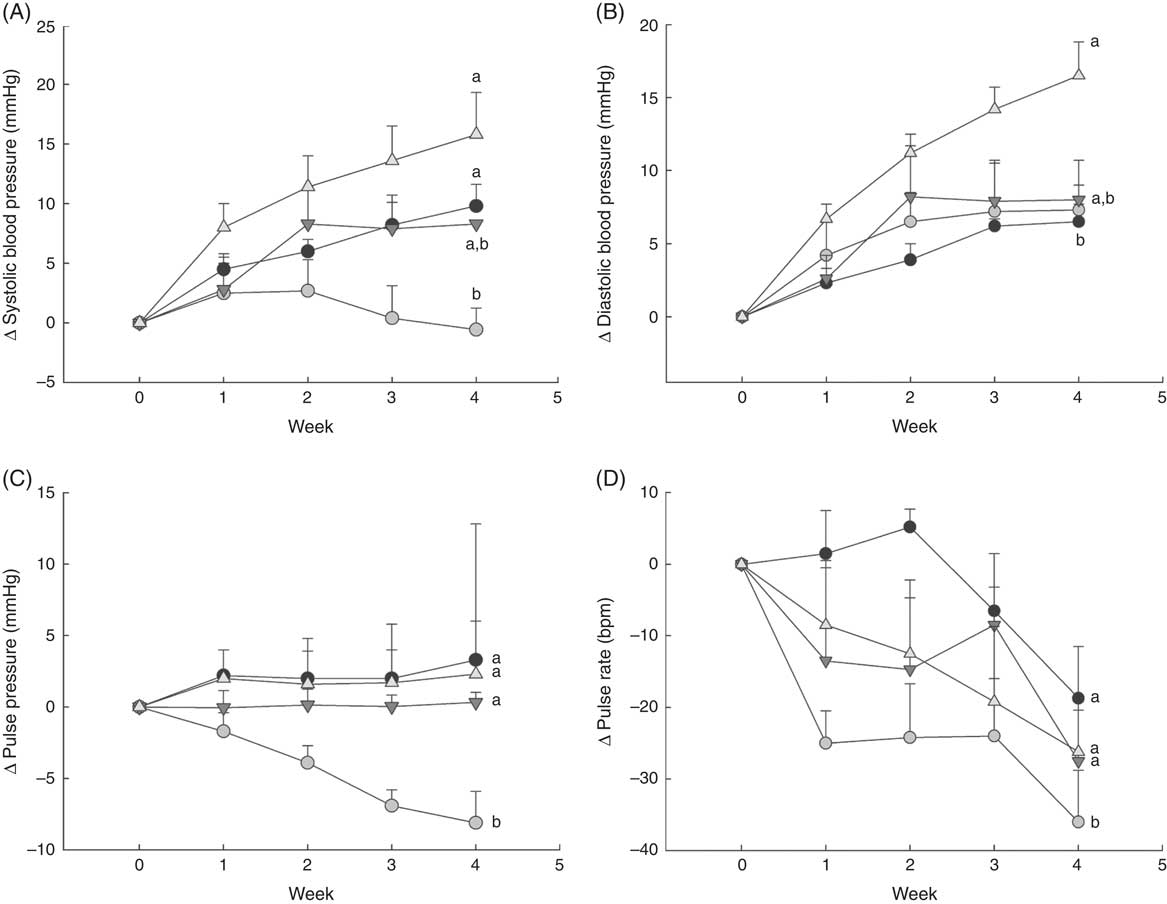
Fig. 1 Changes in blood pressure over 1 month in normal male rats fed diets with varying levels of 25-hydroxy vitamin D (25(OH)D), with achieved mean 25(OH)D plasma levels at the end of 1 month indicated for each group. Changes in (A) systolic blood pressure, (B) diastolic blood pressure, (C) pulse pressure and (D) pulse rate are shown. Values are expressed as change (Δ) from baseline (values corrected for each rat before feeding test diets) with means (n 6–8 rats/group) and standard deviations. a,bUnlike letters were significantly different at P<0·05 in Tukey’s test after one-way ANOVA. ![]() , 30 nmol/l Plasma;
, 30 nmol/l Plasma; ![]() , 43 nmol/l 25(OH)D;
, 43 nmol/l 25(OH)D; ![]() , 108 nmol/l;
, 108 nmol/l; ![]() , 561 nmol/l.
, 561 nmol/l.
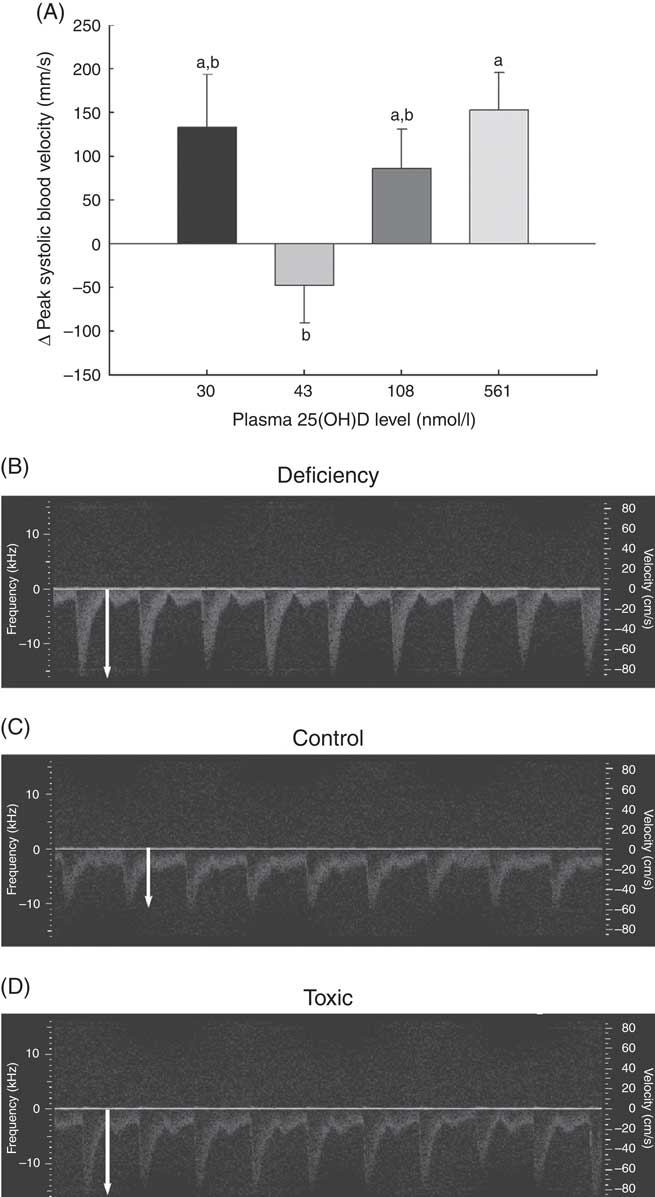
Fig. 2 Changes in vascular function over 1 month in normal male rats fed diets with varying levels of 25-hydroxy vitamin D (25(OH)D) detected using high-resolution ultrasound of the carotid artery, with achieved mean 25(OH)D plasma levels at the end of 1 month indicated for each group. Quantitative results for (A) peak carotid systolic blood velocity through the carotid artery is shown as mean values and standard deviations; n 16 rats/group, with mean plasma 25(OH)D levels indicated for each treatment group. a,bUnlike letters were significantly different at P≤0·05 in Tukey’s test after one-way ANOVA. Representative pulsed wave Doppler sonograms of the carotid artery are also provided to show representative velocity (y-axis) and profile of flow over time of each pulse from (B) vitamin D deficiency group (C) control RDA group and (D) vitamin D toxicity group. White arrows indicate the magnitude of peak blood velocity.
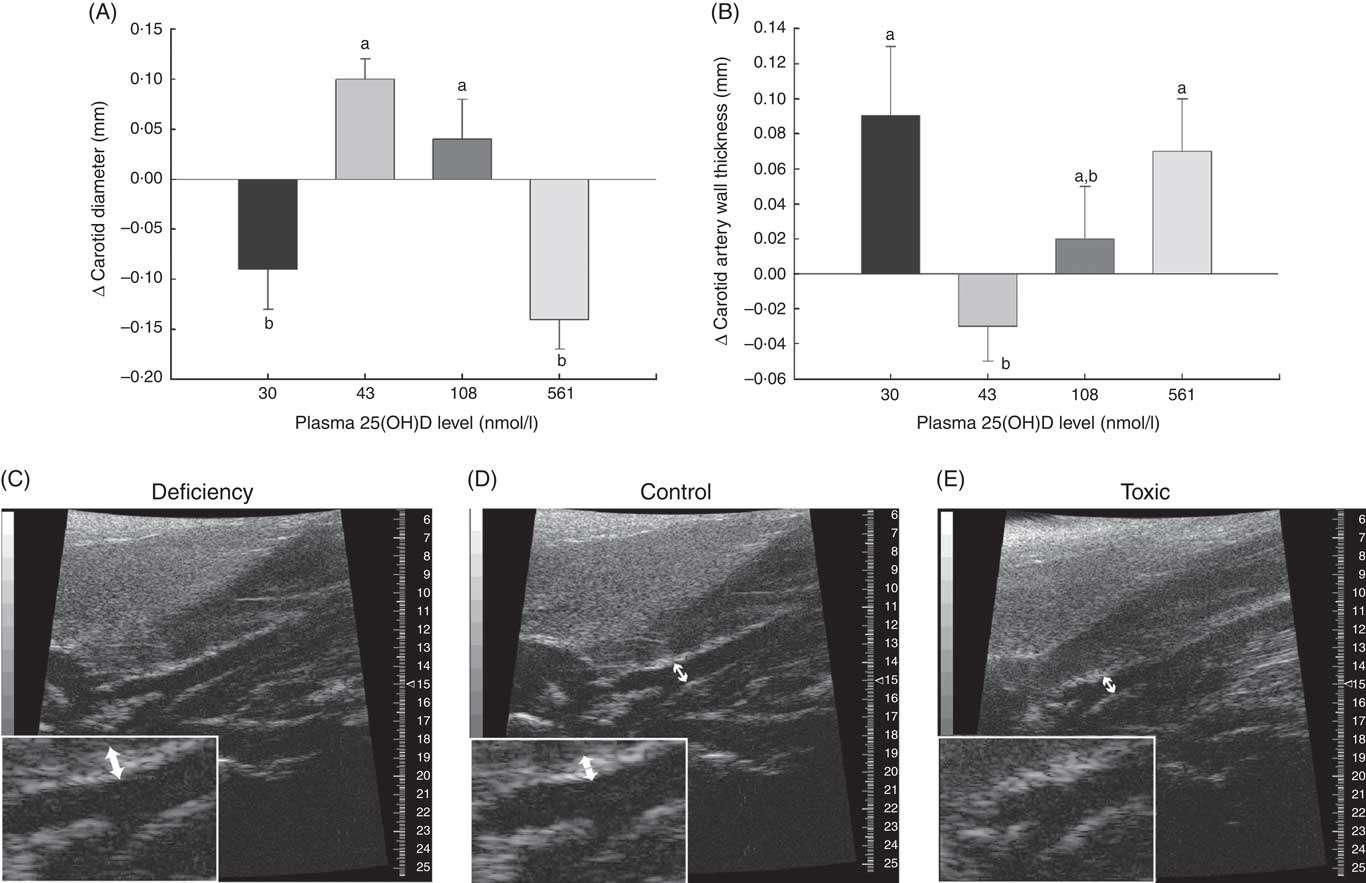
Fig. 3 Changes in carotid artery parameters over 1 month in normal male rats fed diets with varying levels of 25-hydroxy vitamin D (25(OH)D) detected using high-resolution ultrasound of the carotid artery, with achieved mean 25(OH)D plasma levels at the end of 1 month indicated for each group. Quantitative analyses of B-mode ultrasound are shown for (A) carotid artery luminal diameter changes and (B) carotid artery wall thickness. Values are means (n 16 rats/group) and standard deviations; n 16 rats/group with mean plasma 25(OH)D levels indicated for each treatment group. a,bUnlike letters were significantly different at P≤0·05 in Tukey’s test after one-way ANOVA. Representative B-mode sonograms of the carotid artery at the point of bifurcation are also provided to show (C) increased carotid artery wall thickness (indicated by thicker white border at blood vessel wall) in vitamin D deficiency, (D) a normal-looking carotid artery from a rat from the control (RDA) group and (E) decreased carotid artery luminal diameter in vitamin D toxicity. For both wall thickness and carotid artery lumen, these changes are most evident in the enlarged inset for each sonogram. Arrows indicate the point where measurements were taken just before the carotid bifurcation.
Table 2 Rat baseline information (Mean values and standard deviations; n 64 rats for body and ultrasound measurements; n 29 rats for blood pressure measurements)
Table 3 Vitamin D (cholecalciferol) dosage groups and daily consumption that resulted in the indicated plasma calcium, phosphate and 25-hydroxy vitamin D (25(OH)D) levels in rats after 4 weeks of feeding test diets. Baseline 25(OH)D levels (blood obtained immediately before start of 4-week test diet feeding) were determined in a representative sub-sample of rats from all treatment groups (n 10 rats total) and found to be 35(8) nmol/l (Mean values and standard deviations with the range of values observed for 25(OH)D levels indicated below)
a,b,c Mean values with unlike superscript letters were significantly different at P<0·05 in Tukey’s test after one-way ANOVA; n 16 rats/group. No significant differences detected among groups for plasma Ca or phosphate.
After 4 weeks of feeding test diets with different doses of cholecalciferol, no signs of overt toxicity or deficiency were detected in rats. There were also no significant differences in rat body mass gain or organ weights among treatment groups after 4 weeks of test diets (Table 4). Although kidney weight appeared to increase in the group with a plasma 25(OH)D level of 561 nmol/l compared with the control group with a level of 43 nmol/l (P=0·07), it did not achieve statistical significance. Cardiac function end points examined were end-systolic and end-diastolic volumes, stroke volume, cardiac output, ejection fraction, pulse rate and ventricular free wall thickness (Table 5). After 4 weeks of test diets, cardiac function did not differ significantly among treatment groups (Table 5).
Table 4 Body and organ weights after 4 weeks of feeding test diets, with achieved mean 25(OH)D plasma levels indicatedFootnote * (Mean values and standard deviations and treatment differences tested using Tukey’s test after one-way ANOVA; n 16 rats/group)
BW, body weight.
* No significant differences detected among groups for any of the above body weight change or organ weight, although P=0·07 for overall ANOVA for kidney weight.
Table 5 Cardiac function after 4 weeks of diet, with achieved mean 25-hydroxy vitamin D (25(OH)D) plasma levels indicated (Mean values and standard deviations; n 16 rats/group)
LV, left ventricle.
* P values are from one-way ANOVA and show no significant differences among treatment groups.
As expected, there was a steady increase to about 10 mmHg higher in systolic blood pressure by 4 weeks in rats fed the deficiency diet, whereas the control group with 43 nmol/l plasma 25(OH)D had systolic blood pressure that remained constant or fell slightly (Fig. 1(A)). Rats fed the highest cholecalciferol diet (toxic group; with 561 nmol/l plasma 25(OH)D level) had an even larger increase in systolic blood pressure of about 15 mmHg, which was significantly different from the control group (Fig. 1(A)). In fact, systolic blood pressure appeared to start increasing as early as the 1st week of feeding this highest-dose cholecalciferol diet (Fig. 1(A)). Moreover, there was a trend, albeit non-significant (P=0·06), for increasing systolic blood pressure (approximately 10 mmHg) in the group receiving the equivalent to the human NOAEL dose (plasma 25(OH)D level was 108 nmol/l; Fig. 1(A)). In contrast, diastolic blood pressure was unaffected by vitamin D deficiency or by feeding NOAEL (Fig. 1(B)). However, diastolic blood pressure was significantly higher than all other treatment groups in the highest (toxic dose) cholecalciferol diet group that had mean 25(OH)D plasma of 561 nmol/l (Fig. 1(B)). Pulse pressure fell steadily over 4 weeks of test diets and was lowest in the control group with 43 nmol/l plasma 25(OH)D (P=0·04) compared with all other treatment groups. No differences among other treatment groups were detected for pulse pressure (Fig. 1(C)). Pulse rate also fell over the 4 weeks of feeding test diets in all groups, but was again lowest in the control group and was significantly different from all other treatment groups (P=0·04). Again, no differences were detected among other treatment groups for pulse rate (Fig. 1(D)).
A potential measure of arterial stiffness is peak systolic velocity of blood flowing through the carotid artery detected using Doppler ultrasound. Peak systolic blood velocity was significantly increased in the toxic cholecalciferol group (at 561 nmol/l plasma 25(OH)D) compared with the control group with 43 nmol/l plasma 25(OH)D at 4 weeks (Fig. 2(A)). The peak systolic blood velocity in the carotid was similarly elevated in the deficiency group, but was not significantly different from the control group (Fig. 2(A)). Sample Doppler sonograms show the high peak systolic velocity through the carotid with each pulse in the deficiency and toxicity group compared with the control group (Fig. 2(B–D)). Despite the higher velocity, similar flow profiles with sharp peaks indicated that laminar flow through the carotid arteries was maintained in all rats from all treatment groups (Fig. 2(B–D)). Additional measures of arterial stiffness and elasticity were explored to support the observation of increased carotid blood velocity in both vitamin D deficiency and toxicity. The percentage distension of the carotid artery diameter with each pulse did not change significantly in rats with differing vitamin D levels (Table 6). However, the distension of the carotid with each pulse does not provide a complete picture of stresses mediating the distension and arterial wall properties( Reference Turk, Pretnar-Oblak and Zupan 42 ). Measures that account for differences in pressure mediating this distension with each pulse, namely the β-index of arterial stiffness and the elasticity modulus (Ep), are superior to percentage distension( Reference Turk, Pretnar-Oblak and Zupan 42 ). In this study, both Ep and β showed a similar pattern of change as that observed with peak systolic carotid blood velocity, lending confidence to the observation of arterial stiffness in both deficiency and toxicity (compare Fig. 2(A) with Table 6). Specifically, after 4 weeks of test diets, all treatment groups showed significantly elevated carotid β-index compared with the control group, confirming increased arterial stiffness in both deficiency and toxicity (Table 6). Using B-mode ultrasonography of the carotid artery, luminal diameter was significantly smaller in rats from both the deficiency and toxicity groups compared with the control group, whereas the NOAEL group was no different (Fig. 3(A)). Carotid artery wall thickness was significantly increased in these same groups (deficiency and toxicity) compared with the control group, whereas the NOAEL group was again unaffected (Fig. 3(B)). Representative B-mode sonograms of the rat carotid arteries from deficiency, control and toxic groups are shown (Fig. 3(C–E)).
Table 6 Indicators of arterial stiffness after 4 weeks of diet, with achieved mean 25-hydroxy vitamin D (25(OH)D) plasma levels indicated (Mean values and standard deviations; n 10–12 rats/group for % distension; n 4 rats/group for carotid β-index and elastic modulus (Ep))
a,b,c Mean values with unlike superscript letters were significantly different at P<0·05 in pairwise non-parametric Dwass–Steel–Critchlow–Fligner tests.
* P values are from one-way ANOVA for carotid artery distension or Kruskall–Wallis tests for β and Ep.
Discussion
The most important finding of the current study is that both vitamin D deficiency (mean plasma 25(OH)D level of 30 nmol/l in this group) and toxicity (plasma 25(OH)D level of 561 nmol/l) cause increased systolic blood pressure after 4 weeks of feeding test diets in normal male rats. These data provide support for a U-shaped dose–response curve for the impact of vitamin D on this critical health outcome (systolic blood pressure) and confirms previous human epidemiological studies that suggest similar non-linear shapes for cardiovascular health( Reference Sundersingh, Plum and DeLuca 30 – Reference Dror, Giveon and Hoshen 32 , Reference Wang, Pencina and Booth 34 ). It is possible that inconsistencies in previous studies in finding an association between vitamin D levels and blood pressure are explained by erroneous use of linear fits to data or assuming that higher vitamin D levels can only decrease blood pressure( Reference Scragg, Slow and Stewart 19 , Reference Catena, Cosma and Camozzi 43 ). However, findings from this study show that time is also a factor in determining plasma vitamin D levels, taking up to 3 months for plasma vitamin D levels to fall, and thus may confound confirmation of this relationship. Previous studies in humans report highly variable responses in oral vitamin D bioavailability, some of which may be because of this delayed effect on plasma 25(OH)D levels. In the current study, blood pressure was lowest and within the desired range for optimal cardiovascular health only in the control group with a mean plasma level of 43 nmol/l 25(OH)D. Moreover, vitamin D toxicity also increased diastolic blood pressure in the absence of hypercalcaemia. The increased blood pressure in both vitamin D deficiency and toxicity was accompanied by increased peak systolic blood velocity through the carotid artery along with decreased luminal diameter and increased wall thickness, consistent with increased arterial stiffness. More concerning was the fact that systolic blood pressure showed a trend for increase in the group fed the equivalent to the human NOAEL dose of 0·25mg/d vitamin D accompanied by a convincing increase in carotid arterial stiffness based on additional measures. The magnitude of increase in β-index of arterial stiffness in the current study (3–4-fold increase) was similar to that reported for spontaneously hypertensive rats compared with controls( Reference Lindesay, Ragonnet and Chimenti 44 ). Accompanied by a 10 mmHg increase in systolic blood pressure, this suggests that the NOAEL dose may be enough to put an otherwise normal animal into the pre-hypertensive category or to push a pre-hypertensive individual into overt hypertension( 45 ).
In humans, vitamin D deficiency is associated with stimulation of the renin–angiotensin–aldosterone system (RAAS)( Reference Kota, Kota and Jammula 46 ). Vitamin D metabolites were reported to be inversely related to circulating renin( Reference Tomaschitz, Pilz and Ritz 47 ), and supplementation with cholecalciferol suppressed RAAS activity( Reference Carrara, Bernini and Bacca 48 ). In animal studies, 1,25-dihydroxy vitamin D (the active form of vitamin D) has been reported to down-regulate renin expression( Reference Li, Qiao and Uskokovic 49 ), whereas other studies report an increase in plasma renin activity( Reference Atchison, Hardin and Beierwaltes 50 ), both independent of plasma parathyroid hormone or Ca levels. Furthermore, renin expression is highly elevated in vitamin D receptor (VDR)-null mice or deficient rats and is causally linked to systemic hypertension, cardiac hypertrophy and heart failure( Reference Xiang, Kong and Chen 51 – Reference Tare, Emmett and Coleman 53 ). Thus, our findings of increased systolic blood pressure in rats fed diets lacking vitamin D are consistent with the majority of human and rodent studies. Increased RAAS activity not only causes vasoconstriction but also causes inflammation. Chronic inflammation is well known to cause arterial stiffness and wall thickening( Reference Nagata-Sakurai, Inaba and Goto 54 ), leading directly to increases in systolic blood pressure( Reference O’Rourke, Staessen and Vlachopoulos 26 ). In humans deficient in vitamin D, there are reported associations between higher neoptrin and high-sensitivity C-reactive protein with arterial stiffness and poor cardiovascular outcomes( Reference Christakos, Dhawan and Verstuyf 5 , Reference Pilz, Marz and Wellnitz 15 , Reference Murr, Pilz and Grammer 55 ). Our findings of increased peak carotid systolic blood velocity and carotid artery wall thickness are consistent not only with the aforementioned human studies but also with rodent studies reporting vascular dysfunction in vitamin D deficiency( Reference Al Mheid, Patel and Murrow 28 , Reference Xiang, Kong and Chen 51 , Reference Li, Kong and Wei 56 ). However, our study failed to detect any impairment in cardiac function in vitamin D deficiency, which disagrees with previous studies in VDR-knockout mice( Reference Christakos, Dhawan and Verstuyf 5 , Reference Xiang, Kong and Chen 51 ). The effects of developmental and prolonged, complete lack of vitamin D effect are likely reasons why cardiac effects were observed in knockout mice, but not in the current study. However, on the basis of magnitude of blood pressure change we observed, it is likely that impaired cardiac function would have become detectable if we had continued our study beyond 4 weeks in rats or if we had used a model for sensitive populations for CVD rather than a normal rat model. Although RAAS activity and inflammation were not examined in the current study, we do know that the vitamin D deficiency group in our study was normocalcaemic. This result confirms a recent report that vitamin D deficiency causes hypertension in rats independent of plasma Ca levels( Reference Sundersingh, Plum and DeLuca 30 ). Thus, future studies should focus on links between RAAS and inflammation to blood pressure rather than plasma Ca levels in vitamin D deficiency.
Hypercalcaemia, hypercalciuria and hyperphosphatemia are thought to be the first adverse effects with vitamin D toxicity, leading to Ca deposition in soft tissues that has been linked with CVD in both humans and animal models( Reference Christakos, Dhawan and Verstuyf 5 , Reference Holick 2 , Reference Price, Faus and Williamson 57 – Reference Holick, Binkley and Bischoff-Ferrari 59 ). Vascular calcification is reported as the direct link to elevated systolic blood pressure and arterial stiffness in end-stage kidney failure( Reference Blacher, Guerin and Pannier 60 , Reference Cecelja and Chowienczyk 61 ). Calcification in the heart was linked to altered cardiac function via ventricular stiffness leading to decreased end-diastolic volume and stroke volume( Reference Bodyak, Ayus and Achinger 62 , Reference Mancuso, Rahman and Hershey 63 ), but cardiac function was unaffected in the current study in any treatment group. The discrepancy may again be related to the duration of the study, with a longer time in vitamin D toxicity likely to cause functional cardiac changes. Taken together, in the current study, the observed increased systolic, diastolic blood pressure, increased peak carotid systolic blood velocity and thickened carotid artery wall in the vitamin D toxicity group would be consistent with a similar vascular calcification process. Paradoxically, however, plasma Ca and phosphate remained unchanged and within the normal range in the vitamin D toxicity group. Although it is possible that rats may manifest hypercalcaemia at different vitamin D toxicities than humans, support for similarities between the two species comes from two human studies. One recent study in adult Spaniards reported that <4 % of those with hypervitaminosis D (>160 nmol/l 25(OH)D in that study) exhibited hypercalcaemia( Reference Pérez-Barrios, Hernández-Álvarez and Blanco-Navarro 36 ) and another reported hypercalcaemia only when 25(OH)D plasma level exceeded 643 nmol/l( Reference Bischoff-Ferrari, Willett and Wong 12 ). Furthermore, a previous rat study reported normocalcaemia with levels as high as 1090 nmol/l( Reference Jones 64 ). In the current study, only the highest 25(OH)D level of 561 nmol/l was in a range where hypercalcaemia may be expected, but was not observed. Increasingly, vascular calcification is thought to occur through an active process resembling osteogenesis rather than a passive process( Reference Jono, Nishizawa and Shioi 65 ), and this process is modulated by vitamin D levels( Reference Watson, Bostrom and Ravindranath 66 – Reference Callegari, Coons and Ricks 68 ). Thus, future studies must clarify the relationship between circulating Ca/phosphate levels to soft tissue calcification processes. However, it is clear that hypercalcaemia cannot be used as an indicator to predict adverse vascular and blood pressure changes in vitamin D toxicity in a rat model.
There is controversy regarding the recommended safe level of vitamin D in humans and questions whether animal studies can be used to extrapolate to humans. The findings of the current study in rats showed that carotid peak carotid systolic blood velocity and systolic blood pressure both show a biphasic shape to the dose–response curve. The optimal plasma 25(OH)D in this study was 43 nmol/l, a level considered to be inadequate by current IOM recommendations( 3 ). However, this optimal level from our study agrees well with a report from the Framingham Offspring Study estimating increased cardiovascular risk in humans at plasma 25(OH)D levels between 37·5 and 75 nmol/l( Reference Wang, Pencina and Booth 34 ). As preventive therapy for reducing cancer risk, intake of up to 1mg vitamin D/d (plasma 25(OH)D level of 100–150 nmol/l) is reported to be safe in humans, with no observable toxicity( Reference Garland, French and Baggerly 69 ). However, it is important to note that blood pressure and indicators of arterial stiffness were not included in this latter cancer study. Although our results clearly support vitamin D supplementation to maintain cardiovascular health, caution needs to be taken to ensure that plasma 25(OH)D levels do not increase above a certain point where cardiovascular risk increases again. We cannot determine the upper threshold for adverse cardiovascular effect of vitamin D from the current study, thus future animal studies should be directed to examine more doses within the range of equivalent to human doses between 0·015 and 0·25mg/d. Moreover, the current method of examining vitamin D toxicity, currently based solely on hypercalcaemia, needs to be replaced by a better indicator of vitamin D cardiovascular toxicity. On the basis of the results of this study, increased blood pressure and arterial stiffness may be better, more sensitive indicators of vitamin D toxicity than hypercalcaemia.
Surprisingly, in this study, a 1-month treatment with a diet lacking any source of vitamin D (vegetarian and no added cholecalciferol) failed to significantly decrease plasma 25(OH)D levels from a pre-test diet level of 35 (sd 8) (random sub-sample from all groups pre-treatment, n 10 rats total) to 30 (sd 11) nmol/l. Rat plasma 25(OH)D level after 1 month of feeding a diet lacking cholecalciferol did produce blood levels that would be categorised as at the threshold of deficient in humans (<30 nmol/l by current IOM standards)( 3 ). However, the levels at baseline (pre-treatment) and at 1 month in the control group fed the equivalent to RDA produced blood levels that would also be categorised as inadequate in humans (currently 30–49 nmol/l)( 3 ). Although rats are reported to show approximately 5-fold lower oral bioavailability for vitamin D supplements compared with humans( Reference Knutson, LeVan and Valliere 70 , Reference Borel, Caillaud and Cano 71 ), the controlled conditions of a laboratory experiment would minimise variability compared with that reported for bioavailability in humans. Low bioavailability in rats is consistent with the low blood levels observed for rats fed the equivalent to human RDA in the current study. Whether thresholds for adverse effects are also different is not known. To begin to address this question, we analysed preliminary data from a separate, subsequent experiment performed in our laboratory with a 3-month dietary treatment with the same vegetarian diet lacking any cholecalciferol. With this longer treatment, 25(OH)D plasma levels fell significantly to 10 (sd 5) nmol/l in rats (n 6) fed a deficient diet (unpublished). Although species differences in vitamin D requirements may still limit our interpretation, clearly there is a time factor that may confound our ability to determine a relationship between 25(OH)D levels at a single time point and adverse effects. It is critical to note that despite an insignificant drop in plasma 25(OH)D levels in the 0 cholecalciferol diet group after 1 month in the current study, we still observed significant negative effects on blood pressure and arterial stiffness. This indicates a dissociation and lag in time between changes to plasma 25(OH)D levels and adverse cardiovascular changes. In other words, adverse cardiovascular changes may precede a detectable drop in plasma 25(OH)D.
Limitations
Although a potential limitation of the current study is that it was conducted in rats, our results show that rats exhibit cardiovascular and calcaemia responses similar to humans with different vitamin D statuses. A second limitation of the current study is the short duration of vitamin D manipulation at only 1 month. However, as clear adverse blood pressure and arterial stiffness effects were observed with this period of treatment and as it took longer than 1 month for plasma vitamin D levels to fall, this limitation allowed us to detect dissociation between these two processes.
Perspectives
In summary, this study clearly shows that both vitamin D deficiency and toxicity are potential concerns for cardiovascular health. Increasing systolic blood pressure and arterial stiffness in this study with both toxicity and deficiency suggests that the dose–response curve between vitamin D and cardiovascular health is U-shaped, but this is confounded by a time lag we detected in plasma levels and dissociation from adverse cardiovascular effect. If the relationship between plasma levels and adverse cardiovascular effect can be confirmed to be U-shaped, then both lower and upper thresholds for optimal health need to be delineated. Optimal cardiovascular health was observed in the current study when plasma 25(OH)D was at 43 nmol/l in normal male rats. Importantly, the use of hypercalcaemia to determine the upper limit for vitamin D is not recommended based on this study. Determining the mechanism(s) linking both vitamin D deficiency and toxicity to adverse cardiovascular changes is needed.
Acknowledgements
This research was funded by the Vitamin Settlement Fund of the Western College of Veterinary Medicine and by Canadian Foundation for Innovation. N. Z. M., S. J. K. and K. B. were the recipients of scholarships from the Canadian Institute for Health Research (CIHR), CIHR THRUST and Merck-Merial Summer Scholarship, respectively.
N. Z. M. was the primary person who conducted animal experiments, data analysis and manuscript writing. S. J. K. and K. B. assisted with the animal experiments and a few data analyses. J. S. helped with ultrasound theory and ultrasound data handling. H. A. V. assisted with study design, consulted on nutrition matters, helped with data review and helped edit the manuscript. L. P. W. was the principal investigator who held research funds, supervised personnel on the project, assisted with study design and had primary responsibility for the final content of the manuscript.
None of the authors have any conflicts of interest to declare.


