


Introduction
In particle technology, a fundamental understanding of distributed particle characteristics is essential to develop efficient optimization strategies for processes based on particle–particle interactions. For particle sizes below 10  ${\rm \mu}$m, there are numerous established characterization methods that can determine particle characteristics integrally or in a distributed manner (Bagheri et al., Reference Bagheri, Bonadonna, Manzella and Vonlanthen2015). Besides methods like laser diffraction or the measurement of settling velocity, which are based on model assumptions, for example, considering all particles to be perfect spheres, there are methods based on 2D images like optical microscopy, scanning electron microscopy (SEM), or dynamic image analysis (DIA). With the latter, it is even possible to determine the particle morphology for particle sizes above 100
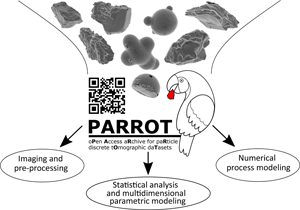
  ${\rm \mu}$m by capturing multiple shadow images under random rotation angles (Macho et al., Reference Macho, Kabát, Gabrišová, Peciar, Juriga, Fekete, Galbavá, Blaško and Peciar2019). Although these methods are able to generate distributions of various particle characteristics in 2D, it is not possible to transfer them to 3D without significant stereological bias in case of nonspherical particles (Erdoğan et al., Reference Erdoğan, Garboczi and Fowler2007; Kahl et al., Reference Kahl, Dilissen, Hidas, Garrido, López-Sánchez-Vizcaíno and Román-Alpiste2017). Real 3D particle data is needed. In the following sections we would like to briefly motivate why the database solution shown here (Fig. 1) is a benefit in dealing with such 3D data.

Fig. 1. Logo from https://parrot.tu-freiberg.de.
3D Characterization of Irregularly Shaped Particles
As the 3D representation of an irregularly shaped soda-lime glass particle shows (Fig. 2, center), a full 3D description of the particle shape cannot be derived from sectional or projection images of 2D microscopy, especially when taking into account that in practice these are not available for each particle simultaneously from different perspectives. Only 3D characterization methods enable to capture multiple particle-discrete characteristics of the 3D particle geometry (Ueda et al., Reference Ueda, Oki and Koyanaka2018), providing the opportunity to analyze distributions of characteristics on integral and particle-discrete level and to connect them with each other to learn more about the multidimensional interaction of particle characteristics. In this context, particle-discrete means that each particle is described by a vector of characteristics consisting of directly measurable volume pixel (voxel) information, like surface and volume, which are both influenced by the so-called partial volume effect (Soret et al., Reference Soret, Bacharach and Buvat2007), and further characteristics derived from this, like various descriptors of size (for example, longest axis, spherical equivalent diameter) and shape (for example, aggregated descriptors as sphericity or functional descriptors as spherical harmonics).

Fig. 2. Possible strategies for the characterization of particle systems shown by the example of a soda-lime glass particle. A visualization of the full 3D description is shown in the middle. Via sectioning or projection measurements 2D data of the particle is obtained (left). Alternatively, 2D microscopy provides top views of the particle, depending on its orientation (right).
Besides destructive 3D methods like serial sectioning (Zhong et al., Reference Zhong, Burke, Withers, Zhang, Zhou, Burnett, Liu, Lyon and Gibbon2019), a possible nondestructive 3D characterization method is X-ray microtomography (micro-CT) which is able to capture structural and textural details on the microscale. Here, a series of 2D projection images is used to generate a full 3D representation, a so-called reconstruction, of the sample volume within the field of view (FOV). Micro-CT and setups with additional optical magnification, so-called X-ray microscopes (XRM), have become established laboratory methods in engineering sciences over the last two decades (Stock, Reference Stock2008; Maire & Withers, Reference Maire and Withers2014). The related application for particle characterization originally comes from the field of geology (Carlson & Denison, Reference Carlson and Denison1992; Cnudde & Boone, Reference Cnudde and Boone2013) but is increasingly used for the analysis of particulate and porous materials in mechanical process engineering (Leißner et al., Reference Leißner, Diener, Löwer, Ditscherlein, Krüger, Kwade and Peuker2020). Depending on the selected particle system, a reasonable analysis often requires a multiscale approach, for example, for composite particles and/or particles the sizes of which cover various length scales (Ditscherlein et al., Reference Ditscherlein, Furat, de Langlard, de Souza e Silva, Sygusch, Rudolph, Leißner, Schmidt and Peuker2020a). In this pilot study, however, we restrict ourselves to single-phase particle systems with a relatively narrow particle size distribution, for which the analysis can be performed without the correlation of measurements on multiple length scales.
Working Areas for Particle-Discrete Image Data
The acquisition and usage of such data is driven by different objectives (Schlüter et al., Reference Schlüter, Sheppard, Brown and Wildenschild2014; Bagheri & Bonadonna, Reference Bagheri and Bonadonna2016; Cepuritis et al., Reference Cepuritis, Garboczi, Jacobsen and Snyder2017). In this section, we introduce, as an example, a grouping of working areas from a particle technology perspective into five nondisjoint categories and showcase how these working areas can synergize by using a particle-discrete database. The grouping considered in the present paper consists of (i) a sample preparation strategy, followed by (ii) image acquisition, (iii) image processing, (iv) stochastic modeling of image data, including their simulation to generate virtual image data, so-called digital twins, and (v) numerical process modeling. We believe that close collaborations between various research groups across disciplines regarding their particle-discrete datasets is an important requirement to use synergy effects in all five working areas (i)–(v) mentioned above. In particular, we believe that the development of a multidisciplinary database is an important prerequisite for many future research activities.
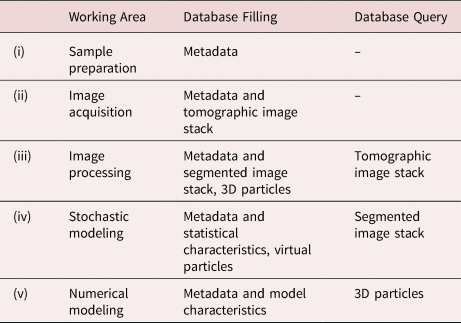
Table 1 summarizes some aspects of data exchange between the working areas (i)–(v) within this database, distinguishing between write accesses (database filling) and read accesses (database query). More precisely, the PARROT database will contain metadata on sample preparation procedures (working area (i)) which can depend on the particle system under consideration (including, for example, dry dispersion or extraction only to avoid fragmentation) and the required analysis volume (ideally matching the FOV of the measurement) (Ditscherlein et al., Reference Ditscherlein, Furat, de Langlard, de Souza e Silva, Sygusch, Rudolph, Leißner, Schmidt and Peuker2020a, Reference Ditscherlein, Leißner and Peuker2020b). In addition, the metadata of the image acquisition (working area (ii)) can provide indications of possible artifacts (Boas & Fleischmann, Reference Boas and Fleischmann2012) in the subsequent image processing of the image stack which is uploaded to an external archive (OpARA) and linked via a digital object identifier (DOI) to the PARROT database. For a quantitative analysis of this kind of data (working area (iii)), image processing steps have to be performed, for example, the automated extraction of objects of interest which are, in the context of the present paper, individual particles (Beucher & Meyer, Reference Beucher, Meyer and Dougherty1993; Burger & Burge, Reference Burger and Burge2016; Westhoff et al., Reference Westhoff, Finegan, Shearing and Schmidt2017; Ditscherlein et al., Reference Ditscherlein, Furat, de Langlard, de Souza e Silva, Sygusch, Rudolph, Leißner, Schmidt and Peuker2020a). The resulting segmented version of tomographic image data is also uploaded to OpARA and linked via DOI to the PARROT database. Note that image segmentation using conventional image processing algorithms can be a nontrivial task, which often requires careful calibration of algorithms. This issue can be avoided using methods from machine learning (for example, convolutional neural networks) which have proven their usefulness for image processing tasks in numerous applications (Furat et al., Reference Furat, Leißner, Ditscherlein, Šedivý, Weber, Bachmann, Gutzmer, Peuker and Schmidt2018, Reference Furat, Wang, Neumann, Petrich, Weber, Krill III and Schmidt2019b; Jiang et al., Reference Jiang, Li, Yang, Mu, Wei, Yu, Pianetta, Zhao, Cloetens, Lin and Liu2020; Furat et al., Reference Furat, Finegan, Diercks, Usseglio-Viretta, Smith and Schmidt2021a). However, in order to train such methods for image segmentation tasks, pairs of raw data and segmented data are required, where the latter can be difficult to obtain. The PARROT database provides for each tomogram the corresponding segmented 3D image which amounts to thousands of segmented slices. Since recent neural networks can already be trained with just a few slices (Çiçek et al., Reference Çiçek, Abdulkadir, Lienkamp, Brox and Ronneberger2016; Furat et al., Reference Furat, Finegan, Diercks, Usseglio-Viretta, Smith and Schmidt2021a), users of machine learning methods can access an adequate amount of data to train and test their models.
Table 1. Working Areas with Corresponding Examples for Database Filling and Query.
From segmented image data, individual particles can be extracted for the computation of particle characteristics which describe their size, shape, and texture (Burger & Burge, Reference Burger and Burge2016; Furat et al., Reference Furat, Leißner, Ditscherlein, Šedivý, Weber, Bachmann, Gutzmer, Peuker and Schmidt2018), see Appendix A-2 of the Supplementary Material. Such particle-discrete vectors of characteristics will be made available within the PARROT database for modeling purposes (working area (iv)). To begin with, particle systems can be efficiently characterized by modeling the distribution of individual particle characteristics using univariate parametric probability distributions (Johnson et al., Reference Johnson, Kotz and Balakrishnan1994, Reference Johnson, Kotz and Balakrishnan1995). Moreover, the particle-discrete vectors of characteristics allow for the modeling of multivariate distributions which capture the correlation structure of considered characteristics (Ditscherlein et al., Reference Ditscherlein, Furat, de Langlard, de Souza e Silva, Sygusch, Rudolph, Leißner, Schmidt and Peuker2020a; Furat et al., Reference Furat, Leißner, Bachmann, Gutzmer, Peuker and Schmidt2019a), see Appendix A-2 of the Supplementary Material. Besides this, the segmented tomographic image data can be used to calibrate stochastic geometry models. They can be utilized to generate virtual particle systems, so-called digital twins (Prifling et al., Reference Prifling, Westhoff, Schmidt, Markötter, Manke, Knoblauch and Schmidt2019; Furat et al., Reference Furat, Petrich, Finegan, Diercks, Usseglio-Viretta, Smith and Schmidt2021b), which will be made available within the PARROT database in the future. Finally, both segmented and virtual 3D particles within the database can be used for numerical modeling (working area (v)) to compute process-related particle characteristics, like, for example, their settling velocity (Trunk et al., Reference Trunk, Marquardt, Thäter, Nirschl and Krause2018), see Appendix A-3 of the Supplementary Material. Here, both, the immersed boundary method (Uhlmann, Reference Uhlmann2005) and the lattice Boltzmann method (Trunk et al., Reference Trunk, Weckerle, Hafen, Thäter, Nirschl and Krause2021) can be utilized to finally assign these additional characteristics to the corresponding particles within the PARROT database—thus, enabling the analysis of structure–property relationships (Stenzel et al., Reference Stenzel, Pecho, Holzer, Neumann and Schmidt2017; Neumann et al., Reference Neumann, Stenzel, Willot, Holzer and Schmidt2020; Prifling et al., Reference Prifling, Röding, Townsend, Neumann and Schmidt2021). With the combination of working areas (i)–(v), a holistic approach to the investigation of such 3D data is provided, from acquisition of image data through their processing and analysis to modeling. Furthermore, the workflow is fully reproducible as all data is made available in open access.
Some Practical Use Cases
Designing type, structure and content of a database is a crucial step and can be done in two ways. The first one is to focus on the data to create a system that can manage it optimally. Relevant key parameters are storage space, minimum redundancies, and retrieval times. The second approach is to focus on the users and the needs for their daily workflows. Users have specific ideas regarding their requirements for the database—so-called use cases (for example, “analysis of particles resulting from a specific comminution process,” “surface characterization of dolomite particles with a minimum voxel volume of 10,000,” etc.). Taking these use cases into account, the data handling becomes intuitive in a certain way. This will be called the user-driven approach. In reality, both approaches go hand in hand and have to be balanced as well as possible. Of course, daily work shows that the working areas presented in the previous section cannot be considered completely independent of each other. Often methods from different working areas are required for the analysis of such image data of particle systems. In the following, we will consider three practical use cases which utilize methods from the introduced working areas and deal, on the basis of a common data source, with different tasks: Acquisition and pre-processing, statistical analysis and multivariate parametric modeling, and numerical process modeling. Note that the use cases illustrate possible applications of the database from the view of particle technology. Nonetheless, applications of further scientific fields such as geoscience, materials science, or biology that could benefit from such a database are conceivable. For reasons of space, the use cases are only briefly introduced in this paper. A detailed discussion can be found in Appendix A of the Supplementary Material.
Acquisition, Preprocessing, and Analysis of 3D Image Data
The acquisition and analysis of 3D particle-discrete data is the key to obtain valid results regarding the distribution of particle descriptors, especially in the case of irregularly shaped particles. The analysis of such particle systems is described several times in the literature (Cnudde & Boone, Reference Cnudde and Boone2013). The combination of experimental process engineering with digital computer-based methods helps to predict the behavior of process sequences and their results (Dong et al., Reference Dong, Zou, Yang, Yu and Roach2009; Lin et al., Reference Lin, Miller, Videla and Mejia2010; Yu et al., Reference Yu, Tao, Ma and He2018). For example, in cake-forming filtration (Ruth et al., Reference Ruth, Montillon and Montonna1933), the correlation of (measured distributed) particle size and shape characteristics with (measured distributed) descriptors of the 3D morphology of the pore space in the filter cake provides information that can be used to predict process behavior (for example, filter cake dewatering and washing). Querying the database allows users to generate artificial cake structures. These synthetic structures can be used for a large number of simulations, which in turn must be validated by individual experiments. Thus, it is not a replacement of the old methodology, but a significant extension. The case study presented in Appendix A-1 of the Supplementary Material is intended to show how the first step toward this approach is taken using the PARROT database.
Statistical Analysis and Multivariate Parametric Modeling of 3D Image Data
Tomographic image data can provide detailed insight into the 3D microstructure of materials (Maire & Withers, Reference Maire and Withers2014) like, for example, for investigating the active and pore phase of cathode materials (Prifling et al., Reference Prifling, Westhoff, Schmidt, Markötter, Manke, Knoblauch and Schmidt2019) or the grain boundary network of polycrystalline materials (Furat et al., Reference Furat, Finegan, Diercks, Usseglio-Viretta, Smith and Schmidt2021a). However, in order to quantitatively investigate tomographic image data, alternative (parametric) representations of this data have to be derived which are easier to interpret. With respect to image data of particle systems, a common approach is the characterization via particle size distributions. This can be done by fitting parametric probability distributions to particle sizes (i.e., volume-equivalent spherical diameters) computed for segmented particles (Handl et al., Reference Handl, Torbahn, Spettl, Schmidt and Kwade2017; Ditscherlein et al., Reference Ditscherlein, Leißner and Peuker2020b). However, since tomographic image data gives access to (possibly thousands of) particle-discrete vectors of characteristics, a more informative and efficient approach is to parametrically model the distribution of characteristics in order to describe the particle system. Note that modeling each considered characteristic individually using univariate parametric distributions does not adequately describe the information yielded by the vectors of characteristics. More precisely, univariate distributions do not provide any information on whether and how particle characteristics are correlated with each other (for example, if larger particles are more spherically shaped, etc.). Therefore, we deploy multivariate parametric distributions for modeling the joint distribution of characteristics—thus, capturing the correlation between characteristics (Furat et al., Reference Furat, Leißner, Bachmann, Gutzmer, Peuker and Schmidt2019a, Reference Furat, Finegan, Diercks, Usseglio-Viretta, Smith and Schmidt2021a; Ditscherlein et al., Reference Ditscherlein, Furat, de Langlard, de Souza e Silva, Sygusch, Rudolph, Leißner, Schmidt and Peuker2020a). Then, the considered particle system can be described by just a few model parameters. To illustrate this, we give a possible application of the PARROT database in Appendix A-2 of the Supplementary Material, where we use particle-discrete (vectorial) data to fit multivariate probability distributions to pairs of characteristics which efficiently characterize systems of particles.
Numerical Process Modeling Based on 3D Image Data
Numerical process modeling is a useful tool to investigate processes or parts of them, which are not easily accessible for measurement devices or require costly equipment for examination (Champion et al., Reference Champion, Katare and Mitragotri2007; Kashiwaya et al., Reference Kashiwaya, Noumachi, Hiroyoshi, Ito and Tsunekawa2012). In the literature, many methods and approaches for the simulation of particle behavior have been proposed (Zhu et al., Reference Zhu, Zhou, Yang and Yu2008). To keep the required amount of computations at a reasonable level, usually some assumptions and simplifications, especially concerning geometrical particle characteristics, have to be made. However, with increasing computational power, simulations can depict more and more aspects of reality. The declining need for simplifications also leads to a growing need for data. For instance, in particle simulations, it is now possible to describe the real surface of a particle instead of using a spherical approximation. This, however, requires detailed 3D particle datasets with a reasonably exact surface description and an efficient surface representation, which is compatible with currently available simulation software. Users of the PARROT database can download numerous systems of particles as input for numerical simulations by variation of their search-query parameters, see Appendix A-3 of the Supplementary Material. For example, this enables the correlation of geometrical properties of the particle system (for example, multivariate distribution of size/shape characteristics) with physical properties, see Stenzel et al. (Reference Stenzel, Pecho, Holzer, Neumann and Schmidt2017) and Neumann et al. (Reference Neumann, Stenzel, Willot, Holzer and Schmidt2020).
Graphical User Interface
We believe that particle-discrete data is only valuable in combination with metadata which specifies the imaged material, the measurement settings and the performed image processing steps. As such, these should all be provided within the PARROT database and usable as search criteria. The user should be guided through the search and download processes to understand the data in sufficient detail, because otherwise the risk of downloading inappropriate or incomplete data is high. For this reason, the PARROT database is equipped with a web-based graphical user interface (GUI). Input filters can be selected by the user in order to subsequently obtain information on the filtered particle systems and the relevant raw image data. The data corresponding to the search results can be downloaded in a compressed format or, in the case of raw image data, is linked to an external database. Preview images in 2D and 3D illustrate the search results and give a first impression of the data. A short manual explains important terms and provides additional information and is provided on the PARROT website https://parrot.tu-freiberg.de.
Outline
The rest of this paper is structured as follows. In section “Materials and Methods,” we introduce some basic methods and give a short overview of the particle systems considered in this paper. In section “Results and Discussion,” we explain some components of the database system and the GUI. This infrastructure is used to query data for the introduced three practical examples of use cases, which are discussed in detail in Appendix A of the Supplementary Material. Section “Conclusion and Outlook” concludes, providing possible guidance for optimizing and maintaining the database as well as scalability beyond the scope of this pilot study.
Note that in this study, we measured six different particle systems of various shapes, from spherical (soda-lime glass particles) to sphere-like (aluminum oxide, dolomite, limestone, and quartz) and clearly nonspherical ones (mica), appropriate examples of particles can be found in Appendix B of the Supplementary Material. We imported the segmented particle-discrete data and related characteristics into the PARROT database. Using the database allows users to filter and query these datasets with respect to distributed characteristics according to specific criteria and, if necessary, match them with corresponding other measurement data. Since the database allows free access worldwide, this is also possible for interested parties who do not yet possess the necessary measurement equipment.
Materials and Methods
Description of Particle Systems
All six particle systems investigated in this study have practical relevance for numerous scientific questions regarding size and shape distributions of particles, their arrangement in the bulk (for example, packed particle bed comminution) and the resulting pore network for fluid flow in filtration experiments. Further information about the characteristics of these particle systems is given in Table 2, whereas examples of SEM images are shown in Figure 3.
Table 2. Characteristics of the Six Particle Systems Considered in This Study.


Fig. 3. SEM images of the particle systems considered in this study. The scale bar refers to all systems.
Tomographic Measurements Using X-Ray Microscopy
The X-ray microscope (type Xradia VERSA 510 from ZEISS) used in this study has a two step magnification. X-ray photons are generated in a polychromatic source and projected as a cone beam onto a scintillator screen. This geometrically magnified image is transformed within a scintillating material into photons of visual light (VIS) according to the incoming intensity and energy regime of the X-ray photons, magnified a second time by VIS optical lenses (in this study, we use a magnification factor of four), and projected on a CCD flat panel detector. One tomographic measurement consists of a series of projection images captured over an angular range of at least 180° (in this study 360°), which is mathematically reconstructed into a 3D representative, the so-called tomogram (Buzug, Reference Buzug2008). Artifacts and measurement errors related to tomography will not be discussed here. Interested readers are referred to the literature (Davis & Elliott, Reference Davis and Elliott2006; Boas & Fleischmann, Reference Boas and Fleischmann2012). All relevant acquisition parameters can be found in Appendix E of the Supplementary Material.
The starting point for the measurement is to use a well-dispersed particle sample that has to be embedded into a low X-ray attenuating matrix to avoid undesirable motion during the exposure process in the tomography system. Here, the main focus is on a statistically representative sample with sufficiently large space between individual particles to support the image segmentation workflow (Ditscherlein et al., Reference Ditscherlein, Leißner and Peuker2020b, Reference Ditscherlein, Leißner and Peuker2020c).
Image Segmentation Strategy
To present an example of workflow in an engineering application, we limited ourselves to a simple image segmentation problem using single-threshold binarization with ImageJ (Rueden et al., Reference Rueden, Schindelin, Hiner, DeZonia, Walter, Arena and Eliceiri2017), described in detail in Appendix C of the Supplementary Material. This strategy works well for nearly spherical particles which are homogeneously distributed within the sample volume. Since this is not always the case in reality, we discover two error causing effects which are well known from image processing: (i) There are particles which are touching each other although they are not physically connected. In this case, the segmentation step (watershed) is not able to separate the particles from each other because of the limited voxel resolution that significantly increases the so-called partial volume effect (PVE; Soret et al., Reference Soret, Bacharach and Buvat2007), that is, they are under-segmented. This is the dominant effect, since it affects at least two or more particles in each case. (ii) There are particles which are clearly nonspherical and elongated in one (fibers) or two spatial dimensions (plates). Many conventional segmentation algorithms work similarly in all spatial directions and thus lead to an undesirable artificial splitting along the longest particle dimension, so-called over-segmentation which can be avoided, for example, by utilizing neural networks for segmenting (Ronneberger et al., Reference Ronneberger, Fischer and Brox2015; He et al., Reference He, Gkioxari, Dollár and Girshick2017) or post-processing (Furat et al., Reference Furat, Leißner, Ditscherlein, Šedivý, Weber, Bachmann, Gutzmer, Peuker and Schmidt2018). However, this is a minor effect since it affects only one particle in each case (which is then erroneously decomposed into a certain number of fragments). Since both, over- and under-segmentation, alter the particle size and shape significantly, such datasets must not be imported into the database. For the initial datasets in the PARROT database, this was realized by manual sorting to provide reliable datasets. Applied to a very large number of samples with a significantly larger number of particles beyond this pilot study, this procedure needs to be replaced by an automatism that is reliable and offers a possibility to evaluate the quality of an automatic segmentation in order to compare different procedures if necessary. Examples of correctly segmented and discarded particles can be found in Appendix B, whereas the implementation of the segmentation algorithm is given in Appendix D of the Supplementary Material. In particular, the example of mica shows that it is not always obvious to decide which image regions belong to an individual particle. Furthermore, in the case of layered minerals, which can delaminate already during sample preparation, particle segmentation can be difficult and not straightforward. This is the reason why it is absolutely necessary to know the particle system's specialities (metadata) to understand possible unexpected effects when dealing with the data.
Relational Database
Overcome the Large Table Approach
When dealing with datasets, a common approach is utilizing a list/table of values (Fig. 4a). This makes sense as long as all data is part of the same aggregation level (Fig. 4b). If, in contrast, there is data which exists at higher level (meta-level $\rightarrow$metadata), for example, measurement parameters that are constant for a large number of measurement points (redundant data), the consistency of the database can be compromised. The more parameters are added, the larger this table will get. Searching inside this structure will quickly become confusing and ineffective. In addition, the later addition of new parameters to existing datasets using this structure can only be done with great difficulty. To create a valid database for a large number of particles, which has been the aim in the design of the PARROT database, such redundancies have to be reduced and consistency has to be improved. One way to this was proposed in 1970 as “A relational model of data for large shared data banks” (Codd, Reference Codd1970), today generally referred to as relational database.

Fig. 4. (a) Different levels of aggregation (b) causes lots of redundancies in a one-table-solution which can be overcome by (c) a relational database approach including the connection (a so-called join) with proper key indices.
Database Structure
A relational database compensates for inconsistencies and redundancies by structuring the data according to their aggregation level (see Fig. 4b) and, optimally, within functional groups (Codd, Reference Codd1982; Paredaens et al., Reference Paredaens, De Bra, Gyssens and van Gucht1989). For example, all data related to an experiment are inserted into a separate experiments table, which is much smaller than the particle table containing particle-discrete data for all particles. On the next aggregation level, there may be data regarding reconstruction and measurement settings or aggregated particle characteristics. This structuring can be done in several steps and is called normalization. A connection between tables is established by so-called key-columns. Every table has a primary key column which has a unique value for every row and can be inserted as a foreign key into another table to establish the relation between both, a so-called join. Joins can be used to link data according to the set theory known from mathematics, for example, datasets belonging to tables A and B at the same time (inner join) or datasets, which only belong to table A but not necessarily to B (left join), etc. This enables us to connect the PARROT database with other relational databases, which contain, for example, results from a laser diffraction measurement of the same particle system, assuming that there are corresponding matching unique keys in both databases. Figure 5 shows the structure of the PARROT database including tables for data and metadata. External connections and automated functionalities are described in the lower left legend. The database itself is embedded in an overall structure that provides all necessary software for database manipulation. This structure is referred to as database management system (DBMS). Besides storing and retrieving data, the system includes an appropriate security environment. For the PARROT database, we chose MariaDB (Wood, Reference Wood2018), a widely used community-developed fork of the well-known MySQL DBMS. Its lean design makes it easy to set up for smaller projects, but it is still fully equipped to potentially upscale the DBMS in terms of load and storage. For this pilot study, we use a virtual Windows server with internet access, 1 TB hard disk for the DBMS and the file system, 4 GB RAM and a two core CPU at 2.4 GHz.

Fig. 5. Structure of the relational database: Starting with (a) the tomographic data that is (b) stored within an online repository and (c) divided into particle-discrete datasets that are (d) stored in a local file system. After import, the database contains (e) primary data and (f) related metadata.
The Importance of Metadata
Not knowing the related metadata to our datasets is like knowing the alphabetic letters without their syntax, context, and interconnection. For our case, this means: How is data to be interpreted? Which data types and ranges of values are present? Is the actual data in a raw format or has processing already been performed? In the sense of a holistic view, metadata is essential in order to be able to use findings for specific process optimization. In this context, metadata consists of parameters regarding experiment (pressure, volume flow), measurement (acceleration voltage, exposure time), image analysis (segmentation algorithm) or modeling (model type, basic assumptions). To ensure valid metadata, acquisition should be done automatically whenever possible, for example by using automated extraction from equipment log-files. The integrity and consistency of this type of data is essential for successful data analysis. Within the PARROT database, the import is realized by automated importing routines that are adapted to tab-separated text files suitable to serve as a possible candidate for future interface creation. Since interface implementation is often non-trivial and very device-specific, this general method was chosen as the starting point for the pilot study. Note that the currently available metadata does not claim to be complete. For the pilot study, we have selected the most relevant ones for us at the moment. However, the structure allows further criteria to be added without difficulty.
Storage Partitioning
Grouped by memory size, the database holds three general types of data. The first type consists of alphanumeric characters in binary format physically stored within the database, typically allocating only a very small amount of disk space—in our case for 6.000 particles approx. 3 MB. The second type concerns ASCII-files containing particle-discrete data obtained from segmented voxelized image data. The required disk space for the initial dataset of 6.000 particles is approx. 40 GB. This data does not need to be indexed but has to be quickly accessible for compression and downloading. It is thus stored within a local file-system and linked to the database. Provided database-internal special data types, so-called Binary Large Objects (BLOB), would unnecessarily expand the database structure and behave rather unfavorably with regard to efficient resource management by the DBMS. The third type concerns the raw tomography data, consisting of the reconstructed single channel TIFF stacks (for binning 2 with  $1024\times 1024$ pixel) and their segmented counterparts. The required disk space for one particle system in compressed format is approx. 2 GB (in total, 12 GB for all six examples). Here, it would also be possible to store the files in the local file system. With regard to scaling the application and high-performance data access, an external solution was preferred. Note that TU Dresden together with TU Bergakademie Freiberg provide an open access repository and archive (OpARA) for storing scientific datasets for a worldwide access via digital object identifier (DOI), which allows linking this external storage via the DOI primary key to the related dataset. Another advantage of this method is that individual datasets can also be directly referenced in the context of scientific publications. The backup of the data is guaranteed by the storage management system of TU Bergakademie Freiberg.
Data Access
Under the assumption of a web-based data access, there are two general design strategies for building the GUI. The data would also be accessible via text input, but this would raise the barrier to widespread use. A GUI should give an intuitive way for selecting and retrieving the data. One way would be to design separate web-pages for each use-case. This approach would get users to their destination, that is, the downloading of filtered data, in the fastest way. However, if important filter substeps are skipped, there is a risk of unintentional virtual mixing of particle-discrete data from different measurements, which mostly makes no sense either in image analysis or in modeling from the application point of view. The second approach is to “guide” all users along the same steps: (i) pre-filtering related to material, measurement, and characteristic, (ii) selecting the particle system; (iii) selecting the related tomographic dataset, and (iv) downloading selected data and metadata. Note that steps (i)–(iv) are all accompanied by a deliberate filtering of the data. This means that in each subsequent step, only the data which match the selected filter criterion are displayed. The filter selection is cached in each step and automatically saved as a text file in the compressed (ZIP-format) download folder, so that it can also be reconstructed afterwards how the filter result was obtained, that is, also by other users who did not query the data themselves.
Results and Discussion
The use cases already introduced in the section “Some practical use cases” are embedded into three different research projects with the following titles: (i) Development of process models based on 3D information about the multiphase processes in the pore space of a filter cake (funded by DFG, project number: PE 1160/23-1), (ii) Stochastic modeling of multidimensional particle properties with parametric copulas for the investigation of microstructure effects on the fractionation of fine particle systems (funded by DFG through project Z2 of SPP 2045, project number: SCHM 997/27-2), (iii) Two-scale approach for the simulation of multidimensional fractionation of fine particles (funded by DFG through project Z4 of SPP 2045, project number: KR 4259/8-2). For a detailed discussion of all three use cases, the interested reader is referred to Appendix A of the Supplementary Material.
The database itself has been developed in project Z1 of SPP 2045 (project number: PE 1160/22-2) which, in conjunction with projects Z2 and Z4 mentioned above, represents the central part of the SPP 2045 (DFG project number: 313858373) dealing with multidimensional and correlative characterization of particle systems. Further information regarding SPP 2045, including detailed project descriptions, is available online via https://tu-freiberg.de/fakult4/mvtat/SPP2045.
Design of the Database System
Due to the broad scope of the topic, not all components of the database can be explained in detail. Since the complete source code of the GUI and the database structure are available in open access, only the most important points will be discussed here.
Data Management
The workflow from gathering data, their analysis, modeling, simulation, and visualization is referred to as data management (Gray et al., Reference Gray, Liu, Nieto-Santisteban, Szalay, DeWitt and Heber2005). Perhaps one of the most important aspects that completes this process is data sharing. Only when this is possible, that is, when the documentation and provision of metadata has progressed to the point where other workgroups can use the data without difficulty, has the potential been fully exploited. We believe that our approach in implementing the PARROT database is a first step toward reaching this goal on a small scale. It combines fast data access with reasonable storage management and is thus suitable for scientific institutions which do not have sufficient investment funds at their disposal. Open access is an important point in this context. The storage in an online repository (in our case OpARA) only represents an outsourcing of the resources in a broader sense; provided with metadata, an additional added value is generated here, which also benefits the scientific community.
The goal of this pilot study was to develop a working system without requiring a major investment of money or personal resources. We use the noncommercial standard Windows programming environment, called the .NET framework. Within this framework, we use Microsoft Visual Studio with ASP.NET as a programming development environment. The provided model-view-controller architecture (MVC; Leff & Rayfield, Reference Leff and Rayfield2001) allows a simple set-up of the system. An important aspect in this regard is the language support for querying the database. In most cases, the structured query language (SQL) is used to communicate with the database. Just as in human languages, there are many ways to use this language. Complicated query structures can sometimes produce the same results as simply formulated ones. For an efficient way of using this language, we use a common tool for object-relational mapping (ORM), called Dapper. This architecture allows easy linking of the input from the web interface to the database, is highly performant and secure against unintentional database manipulation (injections).
Performance
Normally, the performance of a database system is monitored by tools of the DBMS under real conditions during operation. To give an example of such a performance analysis, certain tests with high load were simulated by creating duplicates of the original data in the pilot system.
As a performance measure, we use an SQL query which selects datasets based on distinct bounds specified by the user. As can be seen in Figure 6, querying approximately 7 million particles with unique voxel volume out of a total of 10 million lasts approximately 6 s. The query time of the DBMS itself is therefore in all likelihood not a problem even with very extensive operations. Much more important is the interaction of the DBMS, web server and storage, see section “Maintenance and scalability”.

Fig. 6. Performance test using SQL query time as a speed measure over artificially generated discrete particle datasets. Note that unique particle volumes from the total dataset are queried (initially: approx. 6,000 maximum: 10 million particles).
Maintenance and Scalability
Maintenance is part of the administrative activities that are mandatory for a database system in order to guarantee stability and performance (Mullins, Reference Mullins2002). In the specific example of the PARROT database, this mainly includes the monitoring of database parameters. For example, the load caused by several concurrent database accesses is checked. Since all the individual components (web server, database, storage) interact in a complex way here, it is difficult to predict the real behavior in detail. The administrator must, therefore, statistically evaluate database accesses and optimally balance resources. The system is equipped in such a way that no problems are seen here for the initial phase. It is important that suitable limit values are set in the monitoring tool to alert of bottlenecks in advance, so that the system can be adjusted accordingly at an early stage. Since the system is located on a virtual server, resources can be added quickly after the shortest downtime and can thus be optimally adapted to the actual requirements.
The used database management system (MariaDB; Tongkaw & Tongkaw, Reference Tongkaw and Tongkaw2016) can be scaled up in data volume, query intensity, and performance by distributing it over a computing cluster, which is commonly known as a “Max Scale” approach (Zaslavskiy et al., Reference Zaslavskiy, Kaluzhniy, Berlenko, Kinyaev, Krinkin and Turenko2016). The bottleneck here is rather the web server, which has to handle the parallel accesses. Since no query intensities comparable to other widely used web applications are to be expected in the present case, this is seen as less critical. However, the system should always have enough resources available and, if possible, be designed so that it never runs at full load. As discussed above, this monitoring also falls within the scope of the administrative activities in the pilot phase.
To optimize data and metadata entry for very large datasets, the data import described above would need to be done automatically from a central location. Typically, this is realized by so-called data collectors. These software tools are executed by the server, usually at fixed time intervals, to check whether there is new data in the file system. If this is the case, the corresponding files are read out and imported into the database with corresponding SQL statements, or file paths are linked.
Finally, it is important to emphasize that the general design of the system is critical at this point too. Is there an expert panel that monitors the submission of new datasets or are there mechanisms that automatically check user uploads? How and according to which criteria this can be done is a large complex of topics that cannot be dealt with in the present paper.
Conclusion and Outlook
A complete three-dimensional discrete description of particulate systems is the basis for a wide range of applications from traditional engineering through comprehensive image analysis and microstructure modeling to process modeling. Networking at the data-level exploits synergies and promotes the exchange of experience. As this study shows, this can be implemented most efficiently by using a relational particle database. Thus, all three use cases presented briefly in this paper and detailed in Appendix A of the Supplementary Material give the possibility to download data according to their requirements. Guided by a simple online web-based graphical user interface, basic understanding of particulate systems is supported, which minimizes potential content errors, like unintentional virtual mixing of different particulate systems.
Note again that this study is not a software package or program library, but rather proposal for a solution that has emerged from the networked work of our research group. In the next step of the project, further particle systems will be added. Moreover, the aim is to make high-resolution image data of individual particles available. Cross-linking between other research groups would also be conceivable to increase the available measurement time, for example, particle systems could be exchanged and scanned during potential equipment standby times. In order to implement this as efficiently as possible and also to be able to comply with the growing demands on the system, the infrastructure and administration would have to be transferred to a superior research institution like the National Research Data Infrastructure (NFDI), funded by the German Research Foundation (DFG).
The authors look forward to a lively use of the PARROT database (https://parrot.tu-freiberg.de) and would be grateful for suggestions for improvement and user feedback.
Data availability
The PARROT database is accessible via https://parrot.tu-freiberg.de. The complete source code is published in the github repository https://github.com/ps-igel/OPD under the GNU General Public License v3.0. Complete raw data (reconstructed and segmented TIFF stacks) of all particle systems considered in this study is available by open access via the OpARA online repository of TU Dresden and TU Bergakademie Freiberg via http://dx.doi.org/10.25532/OPARA-104 (dolomite), -105 ( ${\rm Al}_{2}{\rm O}_{3}$), -106 (quartz), -107 (mica), -108 (limestone), and -109 (soda-lime glass). All data is explicitly intended for free use and should help to provide a good starting point for the investigation of similar systems. The authors hope for a vivid exchange of experiences in the future.
Supplementary material
To view supplementary material for this article, please visit https://doi.org/10.1017/S143192762101391X.
Acknowledgments
The authors thank the German Research Foundation (DFG) for supporting this study as part of the Priority Program SPP 2045 (DFG project number: 313858373), which is dealing with highly specific multidimensional separation of technical ultra-fine particle systems with particle sizes below 10  ${\rm {\rm \mu}}$m, for supporting the filtration project regarding the development of process models based on 3D information about the multiphase processes in the pore space of a filter cake (PE 1160/23-1), and for funding of the micro-CT device (INST 267/129-1). Furthermore, we would like to thank Ralf Schünemann as well as the colleagues from the Computer Center of TU Bergakademie Freiberg and the OpARA-team at TU Dresden for their valuable support, Henry Lehmann for his guidance in 3D data processing, Lisa Ditscherlein for providing the SEM images, and Thomas Buchwald for carefully reading the manuscript.


 Open access