


Fortification is the addition of one or more nutrients to foods( 1 , 2 ), under levels established by the regulatory agency of each country( 2 ). In Brazil, according to the National Agency for Sanitary Vigilance, each 100 g or 100 ml of product ready for consumption must meet, respectively, a minimum level of 30 % or 15 % of the Recommended Daily Intake of a nutrient( 3 ).
When fortification is established by public policies or programmes, it is designated as ‘mandatory’ and should be implemented from epidemiological studies that corroborate the existence of risk population group(s) for a number of physiological and socio-economic reasons( 2 – 4 ). ‘Voluntary’ fortification (‘market-driven’ or ‘discretionary’), in turn, is performed voluntarily; that is, private companies are allowed, but not required, to add nutrients to foods( 4 – 6 ). This mode is expanding and has evolved over time( 1 , Reference Sacco and Tarasuk 7 – 9 ), usually within regulatory limits( 1 ).
The increased consumption of foods with voluntary fortification has attracted the interest of researchers( 5 ), who are outlining ways to investigate how population levels of exposure to vitamins and minerals can be changed in the context of voluntary fortification. Part of these efforts has led to the demarcation of Tolerable Upper Intake Levels for micronutrients and related substances( 5 , 6 ); to raised evidence on long-latency subclinical deficiencies of micronutrients on the aetiology of chronic non-communicable diseases( 10 – Reference Dangour, Whitehouse and Rafferty 12 ), rather than the causal paradigm of nutritional disorders( 10 ); and to models based on ‘risk assessment’.
Such models predict the attributable fraction for voluntary fortification in population levels of micronutrient intakes through the comparison of distribution curves( 5 – Reference Sacco and Tarasuk 7 , Reference Flynn, Moreiras and Stehle 13 – Reference Dufour, Wetzler and Touvier 16 ). The generated results – the potential benefits and drawbacks caused by such type of fortification – are not consensual in the literature and have incited wide discussion( Reference Joyce, Hannon and Kiely 17 , Reference Hannon, Kiely and Flynn 18 ). Legal measures concerning the advertising of foods have entered into this discussion as well, since voluntary fortification often occurs in processed and ultra-processed foods and has been characterized as a sophisticated sales strategy( Reference Monteiro and Castro 19 , Reference Nestle and Ludwig 20 ), the effect of which is little known.
Thus, it becomes essential to answer a series of controversial and unexplored issues and to support a voluntary fortification based on scientific information( 6 , 10 ). The lack of publications, mostly in developing countries, reinforces the need to investigate the consumption patterns of foods with voluntary fortification of vitamins and minerals (FVFVM). To provide a starting point, the present study aimed to estimate the prevalence of FVFVM consumption according to demographic, socio-economic and health characteristics in the adult population of Pelotas, Brazil.
Methods
Between February and June 2012, we carried out a cross-sectional population-based study in the urban zone of Pelotas, a southern Brazilian city populated by 328 000 inhabitants. The study was designed by a ‘consortium’ of students and professors, who developed their projects jointly. The study included individuals of both sexes, aged ≥10 years old, and excluded institutionalized individuals or those unable to answer interview questions.
The sample size for the present project was based on the following parameters: a 72 % prevalence of FVFVM (estimated in a pilot study); an acceptable error of 3·0 percentage points at 95 % confidence level; a design effect of 2·0; and an increase of 10 % to compensate for losses and refusals. Thus, the expected sample size (≥20 years old) totalled 1885 individuals. To comply with the biggest required sample size (3712 individuals), we calculated a total of 1560 households considering an average of 2·38 people per household.
We conducted a random and systematic selection procedure to provide a multistage sampling, using data from the ‘Census 2010’ provided by the Brazilian Institute of Geography and Statistics. From 488 census tracts in the city, we selected 130 tracts to identify the households to be visited. In all selected census tracts, we performed a new count of households and then a proportional correction to the growth of households since ‘Census 2010’. The households were classified according to occupancy status (residential, commercial or vacant). Only residential households were eligible. After this step, an average of twelve households per tract were selected.
For comparison reasons( 9 , 21 ), foods classified as ‘source of’ or ‘fortified with’ vitamins and/or minerals, by Brazilian legislation, were considered as ‘FVFVM’. We selected FVFVM in two stages. Previously, we excluded fresh foods; foods regulated by the Brazilian Standard of Food Marketing for Children, Babyhood and Childcare Related Products( 22 ); and compulsorily fortified foods( 23 ). In the first stage, from July 2011 to January 2012, all remaining (eligible) foods were checked in a monitoring survey conducted by the lead author through periodic visits to the six major supermarket chains of Pelotas, in order to collect FVFVM according to technical standards( 3 ).
In the second stage, we referred to the section ‘Analysis of Personal Food Consumption in south Brazil’ from the latest Family Budget Survey 2008–09 (POF 2009–09)( 24 ) to select which FVFVM obtained in the monitoring survey would be integrated into the study. Two kinds of foods (with only one brand of FVFVM, despite the wide number of available products) and one kind of food (not mentioned in POF 2008–09) were excluded. Then, those that showed a prevalence of consumption greater than 5 %( 5 ) according to POF 2008–09 were selected. To minimize the number of FVFVM excluded, those showing similarities to the selected foods were merged. To simplify the process of choosing, foods were combined into four groups: ‘bread/sweet biscuit’, ‘milk/flavoured milk’, ‘juice’ and ‘yoghurt’. Figure 1 shows a flowchart illustrating the process of composition of the final groups.
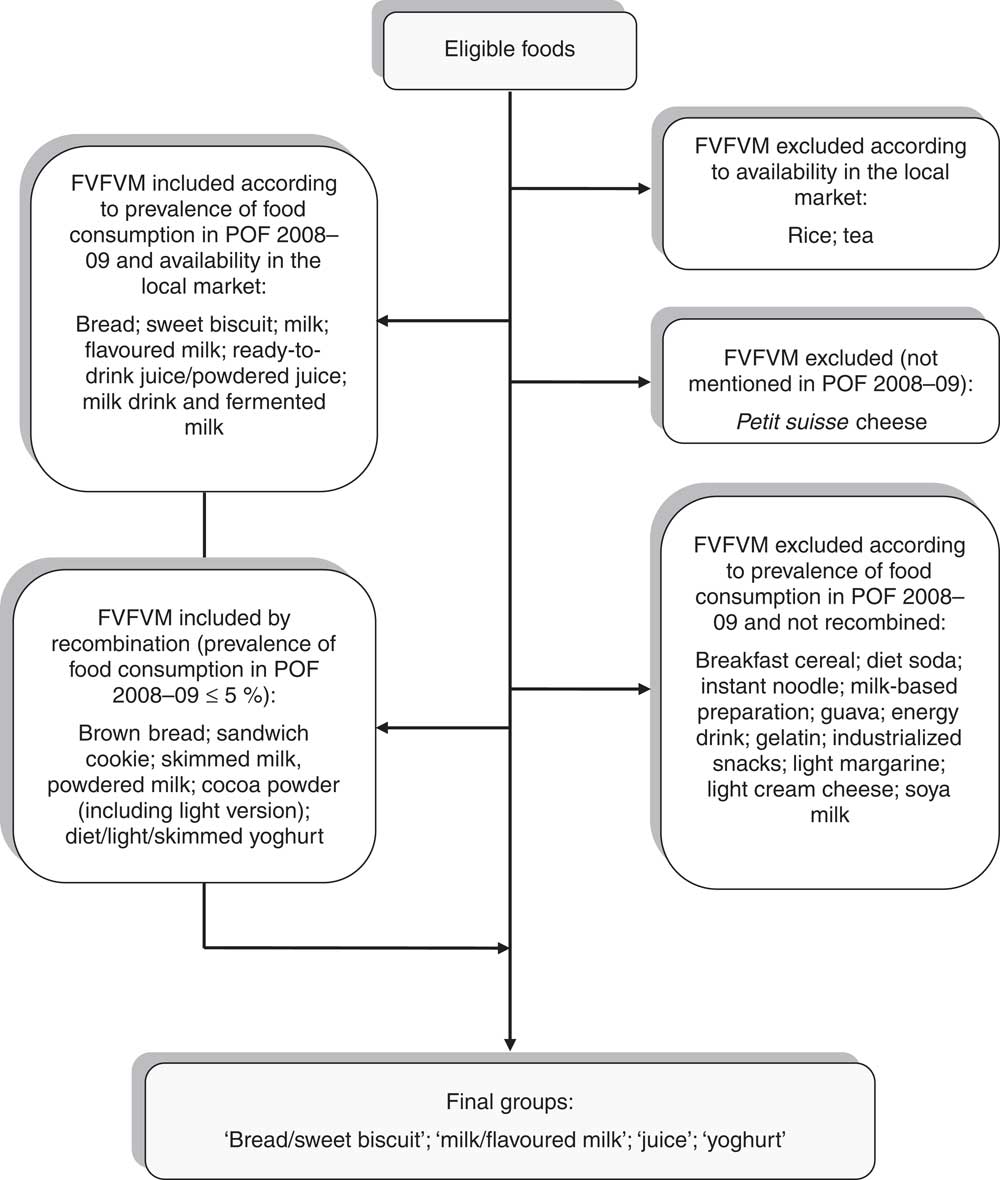
Fig. 1 Composition of the food groups investigated. Pelotas, Brazil, 2012 (FVFVM, foods with voluntary fortification of vitamins and minerals; POF 2009–09, Family Budget Survey 2008–09)
The questionnaire was pre-tested for comprehensibility and ease of completion. For each food group, a filter question about the consumption in the reference period was included with three response alternatives (‘yes’; ‘no’; ‘I do not know/I do not remember’). In the case of an affirmative answer, the questionnaire went on to research the FVFVM consumption, when a second instrument – a catalogue with photographs of fortified and non-fortified foods randomly arranged – was presented to the participant. The ‘bread/sweet biscuit’ group contained forty-eight photos in the ratio 25:23 (1·09), i.e. twenty-five photos of FVFVM and twenty-three photos of non-fortified foods. In the ‘milk/flavoured milk’ group there were sixty-one photos in the ratio 37:24 (1·54). The ‘juice’ group contained forty-seven photos in the ratio 32:15 (2·13), while the ‘yoghurt’ group totalled thirty photos in the ratio 18:12 (1·50).
Before presenting the photographic catalogue, the participant was asked to ‘point to’ photos corresponding to the consumed foods. A number in the footer of each photo pointed to was recorded by the interviewer. The decoding of these numbers, accessible only to the authors, allowed identifying foods with and without fortification. Participants who reported consumption of one or more FVFVM belonging to any food group, within a week prior to the interview date, were positive for the outcome ‘FVFVM consumption’. Participants who reported impaired visual acuity, could not answer precisely, reported difficulty recalling and reported consumption of non-catalogued foods had their answers classified with a code for each situation.
We investigated the following characteristics of participants: sex, age (in complete years), self-perceived skin colour (according to the Brazilian Institute of Geography and Statistics classification; the categories ‘yellow’ and ‘indigenous’ were merged into ‘others’), current marital status (married/with partner; single/without partner; separated; widowed), schooling (in complete years), household income (according to the Brazilian Institute of Geography and Statistics concept) and self-rated health (excellent; very good; good; regular; bad). In the hierarchical model, demographic variables (gender, skin colour and age) and socio-economic variables (marital status, schooling and family income) were used in the first level of determination. In the second level, self-rated health was used.
All data were collected by trained interviewers using a netbook (Samsung C&T Corporation Bldg, Seocho-Gu Seoul, South Korea). The database was created using the Pendragon Forms 6·0 software. Amplitude and consistency checks were conducted to search for errors during the fieldwork. Quality control was conducted by revisits to nearly 10 % of participants, randomly selected. For that purpose we applied a reduced questionnaire to identify possible errors or false answers and, thereafter, to evaluate the agreement and repeatability.
Statistical analyses were performed with the Stata 12·0 statistical software package according to the sampling design and a hierarchical model, as previously mentioned. Prevalence of dichotomized ‘FVFVM consumption’ and the 95 % confidence interval were calculated. Multinomial logistic regression was used to estimate prevalence ratios (PR) and their 95 % confidence intervals as the measure effect between ‘number of consumed FVFVM’ (in quartiles) and independent variables, by a specific command for PR. Wald tests for heterogeneity and for linear trend were applied to assess differences between groups. All tests were two-tailed, with a significance level of 5 %.
The study was conducted according to the guidelines laid down in the Declaration of Helsinki and all procedures involving human subjects were approved by the Research Ethics Committee of the Faculty of Medicine of the Federal University of Pelotas. Written informed consent was obtained from all participants.
Results
Among the 1722 households selected, we identified 3379 adults who met the inclusion criteria. The final sample comprised 1555 households and 2925 respondents interviewed between February and June 2012. The ‘non-respondents’ were, on average, 45·8 (sd 17·4) years old, ranging between 20 and 88 years, constituting 13·4 % of the sample (454 individuals), with a large proportion of men (56·4 %).
The quality control was applied to 285 participants (9·7 % of the sample) and two questions about education were repeated: ‘be able to read and write’ (‘yes’; ‘no’; ‘I can only sign my name’) and ‘schooling’ (in complete years). The agreement in ‘schooling’ was considered ‘good’ (κ = 0·83). The intra-class correlation coefficient was 0·03, and the design effect was 1·73 for the dichotomous outcome.
We identified and excluded from analysis eight participants with blindness or severe impairment of visual acuity, and fifty-seven who could not answer precisely or were unable to report or reported difficulty recalling, at some point in the interview, which group(s) or product(s) they had consumed. The excluded participants differed from those who were included in terms of age (40 % were ≥60 years), marital status (20 % were widowed), schooling (33·8 % with a maximum of four complete years and 12·3 % with twelve complete years or more) and self-rated health (49·2 % rated their health as regular or bad). Table 1 describes the analysed sample (2860 participants) – with an average age of 45·5 (sd 16·5) years, ranging between 20 and 95 years – and the prevalence of dichotomized FVFVM consumption.
Table 1 Sample description and prevalence of FVFVM consumption according to demographic, socio-economic and health variables (n 2860). Pelotas, Brazil, 2012
FVFVM, foods with voluntary fortification of vitamins and minerals.
Family income was the variable with the largest number of missing values (n 65), equivalent to 3·25 %. The other variables had at most four values missing.
Figure 2 shows the distribution of FVFVM consumption in each food group. It was observed that 88·7 % of participants answered affirmatively to the filter question for the group ‘bread/sweet biscuit’. Among these, FVFVM consumption was observed in 28·7 (95 % CI 26·3, 31·1) % and there were mentions of one FVFVM up to a maximum of five products. The prevalence of consumption in the group ‘milk/flavoured milk’ was 52·1 %, of whom 41·5 (95 % CI 38·5, 44·1) % consumed FVFVM, varying from one to five products. Of the participants 50·3 % reported consumption in the group ‘juice’, of whom 70·7 (95 % CI 67·6, 73·8) % consumed FVFVM, but the amplitude was higher, ranging from one to eight products. In the group ‘yoghurt’, 32·6 % of participants reported consumption of such food, of whom 32·1 (95 % CI 28·8, 35·4) % consumed FVFVM, ranging from one to three products.
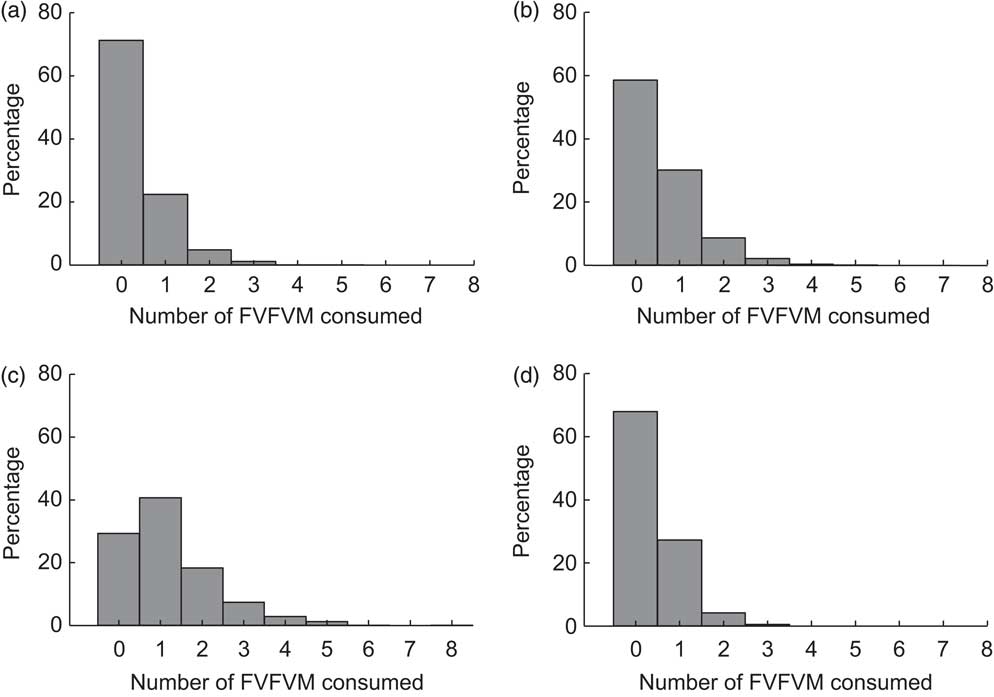
Fig. 2 Distribution of FVFVM consumption for each food group investigated: (a) ‘bread/sweet biscuit’; (b) ‘milk/flavoured milk’; (c) ‘juice’; (d) ‘yoghurt’. Pelotas, Brazil, 2012 (FVFVM, foods with voluntary fortification of vitamins and minerals)
Throughout the interview, 73·8 (95 % CI 71·7, 75·9) % of the participants reported consumption of one FVFVM at least. This distribution exhibited a median of two and a maximum of fifteen FVFVM and was inflated by the ‘juice’ group. In all food groups, more non-fortified foods were selected by the participants; considering the opposite ratios found among the reported foods with or without fortification, the ratio was 0·45 in the ‘bread/sweet biscuit’ group, 0·51 in the ‘milk/flavoured milk’ group, 0·88 in the ‘juice’ group and 0·42 in the ‘yoghurt’ group.
The results for FVFVM consumption in quartiles are summarized in Tables 2 and 3. After adjustment, the difference between the sexes was marked in the fourth quartile, where women were 1·63 times more likely to have higher FVFVM consumption than men. The association with skin colour was observed only in the fourth quartile of the adjusted analysis, where participants of black skin colour showed almost two times higher prevalence of FVFVM consumption than white participants. In both crude and adjusted analyses, the differences among age groups increased progressively from quartile 1 to quartile 4 of consumption, with a maximum gradient in the age group of 20–29 years compared with the reference group of ≥60 years. Concerning marital status, there was strong association in the adjusted analysis only for quartile 3, where the single participants were less likely to consume FVFVM compared with the reference group of widowed.
Table 2 Crude multinomial analysis of FVFVM consumption according to hierarchical model (n 2860). Pelotas, Brazil, 2012
FVFVM, foods with voluntary fortification of vitamins and minerals; PR, prevalence ratio.
The first quartile (0 FVFVM) is the base outcome and was omitted.
*Wald test for heterogeneity.
†Wald test for linear trend.
Table 3 Adjusted multinomial analysis of FVFVM consumption according to hierarchical model (n 2860). Pelotas, Brazil, 2012
FVFVM, foods with voluntary fortification of vitamins and minerals; PR, prevalence ratio.
The first quartile (0 FVFVM) is the base outcome and was omitted.
*Wald test for heterogeneity.
†Wald test for linear trend.
The schooling variable was not associated after adjustment, except for the fourth quartile, where participants with better education (nine complete years or more) were almost two times more likely to present greater FVFVM consumption than the reference group (up to four complete years). The association observed for both household income and self-rated health in the crude analysis was maintained in the adjusted analysis only until the third quartile, where participants with higher family incomes (compared with lower) and who perceived their health positively (compared with ‘bad’) were more likely to present a higher FVFVM consumption.
Table 4 shows the rank of added micronutrients and their respective fortification levels, based on the total of FVFVM reported (consumed) by participants and summarized as median and interquartile range. Vitamin C leads the rank with 3131 references to products that contain this vitamin, followed by Fe (2225) and thiamin (2046). The list ends with biotin (596), vitamin E (409) and Zn (371). Iodine, Mn and P represented an insignificant total amount of references (<1 % of the sample) and were omitted.
Table 4 Rank of vitamins and minerals added and their fortification levels according to FVFVM consumed. Pelotas, Brazil, 2012
FVFVM, foods with voluntary fortification of vitamins and minerals; FL, fortification level.
Iodine, Mn and P represented an insignificant amount of references (<1 % of the sample) and were omitted.
Discussion
Most associations, reported by studies using heterogeneous methodologies, were analysed at different levels of FVFVM consumption and corroborated in the present study. The methodological rigour and data collection, continued for long enough to identify seasonal effects( 5 ), stand out as the main advantages of the present study. Given that respondents tend to present a better remembrance of their frequency of consumption when presented with a short list of specific items( 5 ), the focus on four food groups allowed the minimization of ‘recall bias’. In addition, the photographic catalogue allowed us to circumvent the difficulty in assessing FVFVM consumption by conventional methods( 6 , Reference Hirvonen, Kara and Korkalo 8 ) and this strategy does not seem to influence the responses, since the rates found among foods with and without fortification were contrary to the rates established for this instrument.
Due to exclusion of other FVFVM in the study, the overall prevalence of FVFVM consumption should be taken as an underestimated measure and the outcome ‘number of FVFVM’, divided into quartiles, as a limited measure for intensity of consumption; larger or smaller portions can be ingested, regardless the number and type of FVFVM reported.
Considering that foods have expanded from goods produced and traded in an essentially local level to a global level( Reference Nishida, Shetty and Uauy 25 ), the present results probably demonstrate a similar phenomenon to that in countries where fortification is allowed. However, the results reflect some aspects of the local production and trade, and the extrapolation of findings to other populations should be done with caution. Newer versions of FVFVM, with different combinations of micronutrients, are routinely introduced on the market. As a result, the nutritional composition of these products can easily become out of date( 5 , 6 , 10 , Reference Joyce, Hannon and Kiely 17 ). Changes in regulatory framework may also affect the composition and nutritional bioavailability of FVFVM, impeding extemporaneous comparisons( 5 ).
Regarding the food groups, we found similarities with a Finnish study. Its authors used an FFQ of 48 h and a shopping diary of 5 d, identifying FVFVM by barcode. The groups ‘yoghurt’ and ‘juice’ figured in the rank of food groups with the highest amount of FVFVM consumed( Reference Hirvonen, Kara and Korkalo 8 ). These groups also emerged in other studies, along with the groups ‘milk’( Reference Hannon, Kiely and Flynn 18 ), ‘bread’( Reference Joyce, Hannon and Kiely 17 ) and ‘sweet biscuit’( Reference Wagner, Blauensteiner and Schmid 26 ).
In Belgium, it was observed that 66·7 % of the population consumed soya-based products fortified with Ca daily or almost daily. Assessing daily consumption of these products through a self-administered FFQ for two consecutive days, a more frequent consumption in women than in men and a higher average intake in the younger age group were found( Reference Vandevijvere, De Vriese and Huybrechts 27 ). In the Finnish study already mentioned, younger participants showed higher FVFVM consumption( Reference Hirvonen, Kara and Korkalo 8 ). Although the foods surveyed in Belgium are recommended in their guidelines, and the trade of FVFVM in Finland has been allowed in the same year of data collection, the findings of these and other studies( Reference Joyce, Hannon and Kiely 17 , Reference Jezewska-Zychowicz, Babicz-Zielinska and Laskowski 28 ) align with the results of the present study, with a higher probability of FVFVM consumption in women and young adults.
Participants with white skin colour were less likely to consume FVFVM, the opposite of the authors’ hypothesis. Although most studies do not indicate a large difference among categories of marital status for FVFVM consumption, there are still few studies in the literature exploring this kind of association. The findings for single participants suggest that such differences could be better investigated using other approaches in larger samples.
In Ireland, adults with diets and lifestyles considered more healthy presented a higher FVFVM consumption, which was considered a marker of best dietary patterns( Reference Joyce, Hannon and Kiely 17 ). In Finland, there was an opposite direction, indicating a weak or absent association for most factors related to lifestyle, such as physical activity, not smoking, use of dietary supplements and low alcohol consumption( Reference Hirvonen, Kara and Korkalo 8 ). In Canada, an association with low micronutrient intake, low dietary quality and an inverse association for fruit and vegetable intake has been demonstrated( Reference Sacco and Tarasuk 29 ), although the last finding is not consistent in the literature( Reference Hirvonen, Kara and Korkalo 8 , Reference Joyce, Hannon and Kiely 17 ).
It is worth mentioning that the consumption of powdered or ‘ready-to-drink’ juices, examined in the present study, was related to higher average consumption of sugar in POF 2008–09( 24 ). The consumption of ‘sandwich cookie’, included in the group ‘bread/sweet biscuit’, was pointed out as one of the most important markers of an unhealthy diet, associated with reduced intakes of micronutrients and high energy consumption, particularly from saturated fat and sugar( 24 ). Thus, voluntary fortification could stimulate the consumption of these products( 1 ), rather than better food choices( Reference Sacco and Tarasuk 29 ).
In the Finnish study, schooling was not an independent determinant, although the authors concluded that in larger samples such a variable may present a positive association( Reference Hirvonen, Kara and Korkalo 8 ). In the present study, the change of effect observed for schooling over the quartiles suggest that this relationship may be true for individuals who consume more FVFVM( Reference Joyce, Hannon and Kiely 17 ). So, it seems not possible to rule out that food selection is partly mediated by fortification itself, and partly by other attributes, such as availability and access( 1 , Reference Hirvonen, Kara and Korkalo 8 , Reference Joyce, Hannon and Kiely 17 ).
In the present study, the variable that summarizes general health showed a strong association with FVFVM consumption, especially in the group who perceived their health as ‘excellent’. In a Polish study, there was no statistically significant correlation between subjective evaluation of health status and FVFVM consumption( Reference Jezewska-Zychowicz, Babicz-Zielinska and Laskowski 28 ). It should be emphasized that due to simultaneous collection of variables, the results in the two studies do not necessarily reflect a causal relationship.
Although there is a growing body of evidence about the positive effects of mandatory fortification for certain micronutrients, some researchers consider it premature to extrapolate these inferences for voluntary fortification( 6 ). Such prudence is based on a potential sub- and over-fortification( 5 , Reference Sacco and Tarasuk 7 ), or an imbalance in the metabolism of other nutrients( 2 ). Hence, there are proposals requesting the voluntary fortification – as well as the mandatory fortification – to be scientifically justified, periodically reviewed and monitored by criteria that limit the indiscriminate addition of nutrients to foods( 1 , 6 , 21 , 30 ). As the consumption pattern of these foods cannot be controlled, both mandatory and voluntary fortification should have a careful formulation( 5 ).
There are also ethical implications involving the regulation of voluntary fortification( Reference Sacco and Tarasuk 7 , Reference Nestle and Ludwig 20 ). Allegations employed in FVFVM for marketing purposes( 4 , 5 , Reference Flynn, Moreiras and Stehle 13 ) convey indirectly the message that these foods contribute substantially to the ‘welfare’ of individuals who consume them( 4 , 6 , Reference Jezewska-Zychowicz, Babicz-Zielinska and Laskowski 28 ). Since there is a common concern among consumers that typical diets are unlikely to provide adequate amounts of vitamins and minerals( 10 ), the claims cannot induce a misinterpretation about the nutritional value of foods( 2 ).
The importance of micronutrients on functional capacity and longevity, with a potential impact on reducing health costs, has made food fortification a strategy widely adopted for prevention and control of nutritional deficiencies( 4 , 6 , 31 ). In Brazil, the high prevalence of inadequate micronutrient intakes reaches all major regions and reflects the low quality of the Brazilian diet, provoking a greater susceptibility to nutritional deficits( 24 ). However, the way voluntary fortification is being employed does not meet the precautionary principle discussed in the main guidelines, and many FVFVM do not offer a nutritional equivalence compared with natural sources, a critical issue in the prevailing context of replacement of traditional foods for processed and ultra-processed food products( 1 , 24 ). Furthermore, it was observed that several products are fortified with Fe, folic acid and vitamin A. The first two micronutrients are both targets of Brazilian mandatory fortification, whereas the third is a target of supplementation. This implies a superposition of initiatives, requiring a regulatory review established between government and industry.
The present study is the first population-based cross-sectional one that provides an overview about the topic in Brazil. It brings aids to generate hypotheses and prompt larger and more complex studies. Most of the consumed FVFVM contain a potential and substantial contribution to the average daily micronutrient intake of individuals. The groups with higher socio-economic level were evidenced as the most likely to consume FVFVM, emphasizing the need to investigate to what extent these groups may have been benefited or not by this additional exposure of micronutrients. Moreover, the observed prevalence of FVFVM consumption, occurring concurrently with the decline in consumption of unprocessed and minimally processed foods, triggers a warning sign to primary prevention. If the market expansion of FVFVM continues, this practice could also accelerate the time trends of dietary patterns, increasing unfavourable outcomes for health as a consequence.
Acknowledgements
Sources of funding: The study was supported by the Coordination of Improvement of Higher Education Personnel (CAPES) and the Foundation for Research Support from Rio Grande do Sul (FAPERGS). CAPES and FAPERGS had no role in the design, analysis or writing of this article. Conflicts of interest: The authors declare no potential conflicts of interest. Author contributions: A.C.L.C. participated in all phases of the study, including design, fieldwork, data analysis and writing. R.d.V.Z. and D.P.G. collaborated in the design, data analysis and critical review of the manuscript. All authors approved the final version. Acknowledgements: The authors are grateful to CAPES and FAPERGS for funding the study.


