


The Mediterranean diet (MD) is recognised not only as a healthy prudent dietary pattern but also as a cultural model(Reference Willett, Sacks and Trichopoulou1). Since Ancel Keys(Reference Keys, Menotti and Karvonen2) defined this dietary pattern in the early 1960s, several epidemiological studies have suggested that the MD is protective against several chronic diseases(Reference Serra-Majem, Roman and Estruch3).
Currently, the MD is more or less a theoretical reference pattern descriptive of the diet that existed in the 1960s in some regions along the Mediterranean coast. Evidence exists that the pattern has been preserved to some extent in a few Mediterranean regions(Reference Ferro-Luzzi and Sette4–Reference Balanza, García-Lorda and Pérez-Rodrigo7).
The commonly agreed upon components of the MD include an abundant intake of plant foods (fruit, vegetables, various forms of cereals (unrefined in the past)), legumes, nuts and seeds; olive oil (as a main source of fat); a low-to-moderate intake of dairy products (mostly in the form of cheese or yoghurt), low-to-moderate consumption of poultry and eggs; a moderately high intake of fish, a low intake of meat and processed meat products; and a moderate intake of wine during meals(Reference Willett, Sacks and Trichopoulou1).
Spain is a major producer and exporter of typical Mediterranean products (FAO) and therefore the population’s departure from a traditional dietary pattern has not only nutritional consequences, but also a large economic impact.
The purpose of the present study was to analyse the population trends of adherence to the MD in Spain and in its various geographical and political regions since 1987, using Household Consumption Surveys (HCS).
Materials and methods
The sample comprised a Household Consumption (HC) data set, which consisted of 2500 households in 1987 and increased to 6200 in 2005, following a stratified random selection recorded daily food product purchases(8). Consumption data were obtained from consumer families across the different Spanish regions (autonomous communities, AC), using continuous HCS, administered by the Spanish Ministry of Agriculture, Fisheries and Food (MAPA)(8). Food purchase information from each of the households sampled was collected over 1–2 weeks. Data pertain to daily food availability in households only and information on the quantities of meals eaten outside the household is lacking. The HCS were administered by three different companies over the past two decades.
The estimated daily food availability (g/person per d) reflects estimated per capita food intake in the HC data set. Intake was based on the amount of food purchased. The availability of energy (kJ (kcal)/person per d) was calculated by using the MAPA food composition tables(9). Individual food availability was estimated assuming that there was an equal distribution of food among all members of the household.
To measure adherence to the Mediterranean eating pattern, a variation of the Mediterranean Adequacy Index (MAI) defined by Alberti-Fidanza et al.(Reference Alberti-Fidanza, Fidanza and Chiuchiu6) was used. The MAI was calculated as a quotient, by dividing the energy provided by typical Mediterranean food items (i.e. cereals, fruit, vegetables, legumes, potatoes, olive oil, wine, beer, nuts and seeds, fish and olives) by the energy provided by non-traditional Mediterranean foods (i.e. meat, eggs, milk, margarine and animal fat, other vegetable oils, sugars, pastries, sauces, soft drinks and other alcoholic beverages)(Reference Alberti-Fidanza, Fidanza and Chiuchiu6–9). A high MAI score indicates greater adherence to the MD pattern.
Statistical analysis of the data was carried out using the SAS statistical software package version 9·1 (SAS Institute, Cary, NC, USA). The significance of the MAI trend from 1987 to 2005 was evaluated using a regression model including a quadratic time component. The longitudinal correlation was assessed as an autoregressive residual. Missing data for some months during the years 1992–1993 and 1996–1997 were predicted using the regression model by incorporating the AC as random effects into the model. In the trend analysis, four periods of 4 or 5 years each were considered according to their observed MAI trends, and to minimise inter-annual variability in the data. Linear trends were assessed for each period using the Wald F test. Prediction means of MAI were calculated for each AC for each period and compared with the national period mean using a t test. The level of statistical significance was set to 0·05 for time trends and 0·1 for comparison of specific AC means.
Results
An analysis of the household food consumption data showed a significant overall decrease in the MAI from 1987 to 2005 (P = 0·001) and therefore in the MD pattern adherence in Spanish households. This indicates that the energy contribution of Mediterranean and non-Mediterranean products has been progressively approaching equality during the past two decades.
Further analysis through the curve trend (Fig. 1) made it possible to identify four periods. From 1987 to 1991 there was a significant negative general trend for all AC during this period (P < 0·001). From 1992 to 1997 there was still a significant negative trend (P < 0·001) though less sharp than during the previous period. From 1998 to 2001 the trend is not significant (P = 0·15), which might be described as stabilisation, while the period between 2002 and 2005 presents a significant positive trend (P = 0·002), indicating some recovery of the pattern.
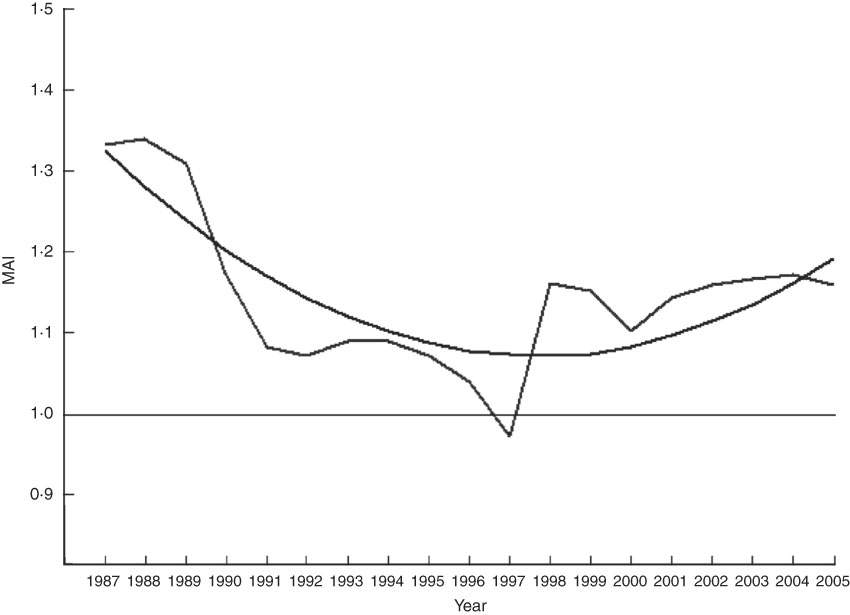
Fig. 1 Evaluation of the Mediterranean Adequacy Index (MAI) during the period 1987–2005 (Source: Ministry of Agriculture, Fisheries and Food(8); ![]() , observed;
, observed; ![]() , model)
, model)
The comparison of the MAI between households in the Spanish AC allows the study of MD adherence by geographical area (Fig. 2 and Table 1). Figure 2 shows the MAI average for each AC over the whole period that was studied. The differences between the various AC can be easily observed by the colour gradient on the map, which is the result of the comparison of the AC means against the national overall period means. The MAI was observed to be significantly higher than the period national mean in all periods in some Mediterranean AC, such as Andalusia, and significantly lower in other AC, such as Castile-Leon. In general, the AC adhering with an MAI average superior to the Spanish national average were the following regions of the Mediterranean area: Andalusia, Catalonia, Murcia and the Balearic Islands. On the other hand, some of the AC located in the centre of Spain (Castile-Leon and La Rioja) showed lower averages than the national values.

Fig. 2 Household Mediterranean Adequacy Index averages by autonomous community in relation to the Spanish national average during the period 1987–2005 (significantly inferior (![]() ) or significantly superior (
) or significantly superior (![]() ), P < 0·1; superior (
), P < 0·1; superior (![]() ) or inferior (
) or inferior (![]() ), 0·1 < P < 0·5;
), 0·1 < P < 0·5; ![]() , no difference; Source: Ministry of Agriculture, Fisheries and Food(8))
, no difference; Source: Ministry of Agriculture, Fisheries and Food(8))
Table 1 Estimated Mediterranean Adequacy Index averages of apparent intake by AC in Spanish households during the period 1987–2005

AC, autonomous community.
Source: Ministry of Agriculture, Fisheries and Food(8).
During 1987–1991, the regional differences were more extreme. The central and northern AC, such as Madrid, the Basque country and Castile-Leon, had shifted furthest away from the reference pattern. On the other hand, the southern AC, such as Andalusia and Murcia, had higher MAI values (Fig. 3).

Fig. 3 Evolution of household Mediterranean Adequacy Index averages by autonomous community in relation to the Spanish national average during the periods 1987–1991, 1992–1997, 1998–2001 and 2002–2005 (significantly inferior (![]() ) or significantly superior (
) or significantly superior (![]() ), P < 0·1); superior (
), P < 0·1); superior (![]() ) or inferior (
) or inferior (![]() ), 0·1 < P < 0·5;
), 0·1 < P < 0·5; ![]() , no difference; Source: Ministry of Agriculture, Fisheries and Food(8))
, no difference; Source: Ministry of Agriculture, Fisheries and Food(8))
From 1992 to 1997 the differences among the AC were small; therefore, there were no significant differences compared with the national average. This pattern appeared again in the next period between 1998 and 2001 (Fig. 3).
Finally, from 2002 to 2005 the differences among the AC had increased. Andalusia, Catalonia, Cantabria and Navarre had significantly greater MD adherence than the national period mean. On the other hand, Galicia, Canary Islands, Valencia, La Rioja and Castile-La Mancha shifted away from the Spanish average (Fig. 3).
Discussion
The data examined in the present study allow an understanding of the patterns of food availability in Spanish households over an 18-year period and across different Spanish regions. Long-term trends can be ascertained consistently between years because of the systematic use of a similar methodology. However, the fact that the company administering the surveys has changed over the years may have affected the accuracy of the data, but likely not to a significant enough degree to change the observed trends.
In order to assess how close the Spanish diet was to the reference MD, a dietary pattern index was applied. It summarised the complexity of the dietary pattern and thus the interactive effects of dietary exposure factors(Reference Bach-Faig, Serra-Majem and Carrasco11). Although the MAI needs to be validated and has several limitations, it effectively measures the trends in food availability(Reference Bach-Faig, Serra-Majem and Carrasco11, Reference Aranceta-Bartrina and Serra-Majem12). There is debate about the building of the MAI, such as the placement of seed oils in the numerator(Reference Balanza, García-Lorda and Pérez-Rodrigo7). Such a diet estimation process is further complicated by the fact that the MD is not only about a list of food items, but also about their proportions.
The methodological limitations of the HCS(Reference Serra-Majem13) as well as other study limitations should be considered when interpreting the results. First, despite the use of the term ‘food consumption’, the HCS measures the quantities of food purchased by the households. Any loss due to preparation and waste due to spoilage or leftovers are not accounted for. Thus, the amounts of food purchased or food availability will be generally greater than the amounts consumed, and the degree of this difference depends on the food considered. In addition, the consumption of foods such as fats, oils and sugar could be underestimated because these foods are also part of other prepared foods such as complex dishes and sauces. Despite these limitations, it has been shown that the amount of food purchased, as documented by food consumption surveys, reasonably corresponds to that consumed(Reference Becker14). Although, compared to the HCS, lower consumption values were reported by availability data (estimated through the Data Food Networking national household budget surveys(Reference Moreiras, Cuadrado and Lillo15)) except for alcoholic beverages, fruit and vegetables (the purchased amount and the consumed amount being very different), there were few differences observed. Second, some adjustments had to be made in the present study to classify the energy provided by food items with heterogeneous composition such as commercial pastries. In addition, some fairly new products (e.g. pre-prepared dishes and sauces), which could not be included as MAI components due to their unclassified and diverse origin, were not really consumed in the 1980s, but their consumption in the past years has increased exponentially(Reference Varela-Moreiras, Ávila-Torres and Cuadrado-Vives16).
The use of households as the sample unit does not allow food consumption evaluation by sex or age, and only reflects a general distribution of household members’ intake. Information on out-of-home food consumption is another factor that could lead to underestimation of the daily intake. However, because it has been shown that the type of food eaten by a given household at home does not differ significantly from the food that household consumes when eating out(Reference Naska, Fouskakis and Oikonomou17), our ability to identify a household’s dietary patterns accurately should not have been gravely affected. A study using the same data set found that a higher socio-economic level was linked to a higher consumption of non-MD products (such as dairy, meat and meat products), fish, beverages and a lower consumption of pre-cooked products(Reference Varela-Moreiras, Ávila-Torres and Cuadrado-Vives16). Additional information on the effects of various factors on food consumption in this household data set has been published elsewhere(Reference Laajimi, Gracia and Albisu18).
Progressive deviation from the predominant dietary pattern in Spain until the end of the 1990s, reflected by a decreasing trend in the MAI value, has been also noted in previous studies(Reference Graciani, Rodríguez and Banegas5, Reference Fuentes10, Reference Gracia and Albisu19). In the first studied period (1987–1991), there seemed to be a sharp decrease, followed by a moderate decrease (1992–1997) in the MAI. This points to the fact that Mediterranean and non-Mediterranean products have been providing progressively similar amounts of energy to the diet of the households that we studied. However, from the end of the 1990s and later, the MAI has been experiencing a stabilisation (1998–2001) and most recently, a slight recovery (2002–2005).
It must be taken into account that the MD of the 1980s had already diverted from the initially identified MD of the 1960s(Reference Keys, Menotti and Karvonen2), when some MAI values were around 2·74, and even higher in the South and in rural areas of Spain(Reference Pérez-Rodrigo and Ruiz-Vadillo20). Garcia-Closas et al.(Reference Garcia-Closas, Berenguer and Gonzalez21) have identified similar changing trends in the Spanish diet, when evaluating the evolution of dietary patterns in the last half century, using several different food availability measurement tools(Reference Garcia-Closas, Berenguer and Gonzalez21). The Spanish nutrition transition characterized by a fall in the availability of carbohydrates and an increase in the availability of fats has been estimated to have occurred from the 1960s to the 1980s(Reference Moreiras, Cabrera and Varela22). These macronutrient changes were mainly a result of a significant increase in economic expenditure and consumption of animal food products such as meat and dairy, as well as a decrease in the consumption of cereals, potatoes and legumes(Reference Laajimi, Gracia and Albisu18, Reference Varela23). Nevertheless, a favourable rise in consumption of fruit(Reference Serra-Majem, Ribas and Tresserras24), an increase in fish intake, with a concomitant decline in wine and sugar intake,(Reference Moreno, Sarria and Popkin25) have also been observed.
Balanza et al.(Reference Balanza, García-Lorda and Pérez-Rodrigo7) reported an imbalance in the diet trends in Mediterranean countries, using the MAI, likely due to a rise in the availability of refined and fat-rich complex (multi-ingredient) products(Reference Balanza, García-Lorda and Pérez-Rodrigo7). Others have also concluded that value-added products seem to be replacing staple foods and fresh products(Reference Aranceta-Bartrina and Serra-Majem12, Reference Regmi, Ballenger and Putnam26). At the same time, the MAPA food availability data we examined reveal that there is a consumption trend towards more complex products, and a recovery in the purchase of Mediterranean products, such as olive oil, fresh fruit, nuts and quality wines, which had continually decreased in the 1980s and the early 1990s(Reference Fuentes-Bol and Ramos27). Since fruit and olive oil, on the one hand, and other sources of fats, milk and sweets on the other, have a high contribution to the MAI, the change in their consumption could have contributed to the observed slight recovery in the MAI in the last two study periods. Moreover, Varela-Moreiras et al.(Reference Varela-Moreiras, Ávila-Torres and Cuadrado-Vives16) performed an analysis of the data set of the present study, from 2000 to 2006, and noted a slight improvement in some aspects of the dietary pattern. In the present analysis, the consumption of milk and eggs decreased, whereas fruit and fish increased, although the consumption of non-alcoholic beverages, and as mentioned previously, sauces and pre-cooked meals, also increased(Reference Varela-Moreiras, Ávila-Torres and Cuadrado-Vives16).
The food availability data show the important geographical variations in food consumption in the different Spanish regions(8, Reference Laajimi, Gracia and Albisu18). Some similarities in food composition were observed in several areas: Northern area (Asturias, Galicia and Cantabria) had a high intake of milk, fish, sugar and cereals; the Mediterranean area (Catalonia, Balearic Islands, Valencia and Murcia) had a high consumption of rice, fruit (citrus) and low intake of milk, eggs and sugar. Finally, along the Ebro river (Navarre, Aragon and La Rioja), the consumption of eggs, meat, vegetables and fruit was quite high(Reference Moreiras, Cuadrado and Lillo15, Reference Laajimi, Gracia and Albisu18). The differences in fat consumption have also been previously documented(Reference Moreiras, Cabrera and Varela22): olive oil consumption is higher in the South (Andalusia and the Mediterranean coast) and lower in some parts of the North (Castille-Leon and Galicia).
Given the pattern that was observed in the different regions, some general conclusions could be made. As a whole, the AC of the Mediterranean basin are those that exhibit greater adherence to the MD, while the more interior regions show lower adherence. Climate-related availability as well as cultural differences may all explain this observation. The above-noted pattern seems to apply to the distribution of macronutrients as well: Balearic Islands were among the highest in the MAI and had the most balanced macronutrient distribution, whereas Castile-Leon had the lowest MAI with the most unbalanced macronutrient consumption(Reference Fuentes-Bol and Ramos27).
Spain, like other Mediterranean countries, has experienced a Westernisation of dietary habits, losing part of its dietary idiosyncrasies(Reference Trichopoulou28) and experiencing an increased contribution of animal products and sugars to overall intake(Reference Popkin and Gordon-Larsen29). When the MAI was applied to the FAO’s food balance sheet data in three European areas (Northern, Eastern and Southern or Mediterranean), from the 1960s to the end of the century, the average MAI score decreased significantly by 1·91 units in Southern European countries(Reference Balanza, García-Lorda and Pérez-Rodrigo7). Using the same FAO database, the MAI in Spain was 3·35 during the period 1961–1965 and 1·19 during the period 2000–2003(Reference da Silva, Bach-Faig and Raidó Quintana30). Mediterranean countries such as Greece, which had the greatest adherence in the 1960s, experienced the greatest decreases in MAI values(Reference da Silva, Bach-Faig and Raidó Quintana30). Others have similarly attributed the distancing from the MD to the increase in energy available from the non-Mediterranean food group(Reference da Silva, Bach-Faig and Raidó Quintana30, Reference Chen and Marques-Vidal31).
The Spanish nutrition transition was quite rapid when compared with that of Northern European countries likely due to the political situation in Spain: it was not until after 1975 that Spain underwent a rapid transition towards democracy and joined the European Union(Reference Moreno, Sarria and Popkin25). During the 20th century Spain experienced important socio-economic and socio-cultural transformations that have led to changes in food demand(Reference Regmi, Ballenger and Putnam26). Examples of such factors are increasing incomes, rapid urbanisation and technical improvements in the food industry(Reference Alexandratos32). The trends observed in the present study are not surprising within the context of globalisation, which is progressively homogenizing the food habits in Europe(Reference Alexandratos32). Our world is continuously influenced by an array of commercial, economic, regulatory, technological and communication forces, all affected by improved transportation, the disappearance of commercial borders and an increase in individual purchasing power(Reference Gracia and Albisu19, Reference Byrd-Bredbenner, Lagiou and Trichopoulou33). It is thought that the incorporation of women into the work force was an important factor in accelerating dietary change and shifts in the organisation of family life and home meals. The reduction of household size (increase in the number of families with only one or two children) and age distribution shifts have had a similar influence(Reference Cruz34). In Spain, a growing demographic group with high birth rates is the immigrants, and they not only bring new food cultures, but also generate new food demands(Reference Vidal-Ibáñez and Ngo de la Cruz35).
A couple of other factors exerting an influence are the increase in food consumed away from home(8, Reference Aranceta36) and the Westernisation of cooking habits and food patterns(Reference Rodríguez-Artalejo, Banegas and Graciani37). Leisure activities have also undergone changes, increasing leisure time at the expense of time dedicated to buying and/or preparing food. As a result of these factors, current food availability has never been as abundant and varied as it is today. On the other hand, especially in the recent decade, an increasing consumer interest in and concern about health and nutrition has also been shaping dietary patterns. Thus, some of the above-mentioned factors are shifting the Spanish dietary pattern to convenience(Reference Gracia and Albisu19) and a more Westernised pattern, while others maintain some traditional Mediterranean influences.
It has been suggested that the deterioration of the traditional dietary pattern may have adverse effects on health in the future(Reference Helsing38). It has been shown that there are significant negative correlations between MAI values and mortality from diabetes, CVD and IHD when applied to a Portuguese population sample(Reference Rodrigues, Caraher and Trichopoulou39).
These trends and current knowledge highlight the need to monitor dietary pattern changes and develop well-structured community measures to preserve the best of the Spanish traditional dietary pattern, with its well-known health benefits(Reference Sofi, Cesari and Abbate40). Such measures could contribute to mitigating the adverse effects of the recent unfavourable dietary trends(Reference Alexandratos32). As the social transformations that may be contributing to these trends are likely here to stay, it is important to understand the dietary pattern changes and use them in developing adaptation strategies; the key should be to try to make them compatible with the lifestyles of modern societies(Reference Garcia-Closas, Berenguer and Gonzalez21). Special attention has to be paid to children and young people who are rapidly abandoning the MD(Reference Fernández San Juan41–Reference Baldini, Pasqui and Bordoni43).
In conclusion, a progressive deviation from the traditional diet was noted in Spain from the 1980s to the end of the 1990s, followed by stabilisation and recent slight recovery. In addition, the present study notes a higher adherence in the Mediterranean regions of Spain, compared with the more inland regions. The results suggest that agricultural and health agencies should take active measures to maintain and increase efforts of promoting the MD among citizens, especially children and youth.
Acknowledgements
The present study was funded by the Mediterranean Diet Foundation, the Spanish Ministry of Agriculture and the Barcelona City Council. The authors declare that they have no conflicts of interest. L.S.-M. and A.B.-F. designed the study; A.B.-F. planned, designed and supervised the data analysis, coordinated the research among the different institutions and wrote the manuscript; C.F.-B. and D.R. provided the data and gave the references to data collection; J.L.C. carried out the statistical analysis; I.F.B. carried out the data analysis, contributed to the editing process and did the English corrections; E.C. contributed to the data representation and writing of the methods and results; B.R. and D.G. contributed to the discussion and revision of the manuscript; D.G. helped with English corrections as well. All co-authors read and approved the final manuscript. The study was conducted for the Second Strategic Report of the Mediterranean Diet Surveillance System in collaboration with: 


