


Prediabetes is a state of neither normoglycaemia nor bona fide diabetes. It was defined as having an impaired fasting glucose, impaired glucose tolerance and/or raised HbA1c levels between 5·7 and 6·4 %(1). This condition has become an important public health concern, affecting one in three US adults and more than one billion people worldwide(2). Among the Chinese adult population, the estimated overall prevalence of prediabetes was 35·7 %(Reference Wang, Gao and Zhang3). In addition to the high-risk state for developing type 2 diabetes(Reference Tabak, Herder and Rathmann4), prediabetes is associated with an increased risk of CVD and mortality(Reference Huang, Cai and Mai5). Therefore, it is imperative to prevent this condition from onset and progression.
Dietary changes have attracted great attention as one of the most important alternative options to combat prediabetes(Reference Evert, Dennison and Gardner6). Honey is a food substance produced naturally by honeybees from the nectar of blossoms, from secretions of living parts of plants or from excretions of plant-sucking aphids(Reference Alvarez-Suarez, Gasparrini and Forbes-Hernandez7). In China, there are hundreds of thousands of honey brands with a variety of quality. Despite their diversity, honey varieties share many common nutrition characteristics(Reference Samarghandian, Farkhondeh and Samini8). They contain carbohydrates (mainly fructose and glucose), proteins, antioxidant enzymes, amino acids, minerals, trace elements, vitamins and phytochemicals such as phenolics and flavonoids(Reference Alvarez-Suarez, Gasparrini and Forbes-Hernandez7,Reference Bogdanov, Jurendic and Sieber9) . Ongoing and accumulating evidence has suggested beneficial effects of honey on improving insulin resistance, oxidative stress and inflammation(Reference Samarghandian, Farkhondeh and Samini8,Reference Meo, Al-Asiri and Mahesar10) . Moreover, honey has been shown to scavenge reactive oxygen species(Reference Beretta, Orioli and Facino11). Increased reactive oxygen species caused by metabolism of excessive glucose and/or NEFA has been identified as a contributor to β-cell dysfunction(Reference Rashid, Nor Aripin and Syed Mohideen12). Therefore, we hypothesised that dietary honey intake may lower the onset of prediabetes.
Several reviews with preclinical trials as well as randomised clinical trials have reported the hypoglycaemic effect of honey in animal models of diabetes or diabetic patients(Reference Ramli, Chin and Zarkasi13–Reference Meo, Ansari and Sattar15). However, no study has focused on the association between honey intake and prediabetes in the general population. On the other hand, compared with diabetes, prediabetes is an early and reversible condition of glucose metabolism disorders, so it can be managed by nutritional interventions(Reference Evert, Dennison and Gardner6). However, it is unclear how honey intake is associated with early glucose metabolism disorders.
Therefore, in the present study, based on data from the Tianjin Chronic Low-Grade Systemic Inflammation and Health Cohort Study, we investigated the association between dietary honey intake and the prevalence of prediabetes among Chinese adults.
Methods
Study population
The Tianjin Chronic Low-Grade Systemic Inflammation and Health Cohort Study has been previously described in detail(Reference Hu, Gu and Lu16,Reference Zhang, Fu and Zhang17) . The protocol of this study was approved by the Institutional Review Board of Tianjin Medical University (reference number: TMUhMEC 201430). Written informed consent was obtained from all participants.
This cross-sectional analysis used the baseline data of the Tianjin Chronic Low-Grade Systemic Inflammation and Health study between January 2015 and December 2016, when a diet questionnaire including honey intake was included in the study. During the study period, a total of 21 740 participants aged 20–90 years were recruited. We excluded those with missing questionnaire data (n 1479). Since CVD and cancer could result in important dietary changes(Reference Hu, Stampfer and Rimm18), participants with CVD (n 755) and cancer (n 130) were also excluded in the present study. Additionally, participants with diabetes (n 1095) were excluded from the analysis. The final study sample consisted of 18 281 participants (Fig. 1).

Fig. 1. Flow chart of participant selection.
Definition of prediabetes
Fasting plasma glucose (FPG) was measured using the glucose oxidase method. The standard 2-h postprandial plasma glucose test was performed using oral administration of 75 g anhydrous glucose solution. HbA1c was determined using the HPLC (HLC-723 GB; Tosoh). Prediabetes was defined as impaired fasting glucose (FPG concentration: 5·6–6·9 mmol/l), impaired glucose tolerance (2-h plasma glucose concentration: 7·8–11·0 mmol/l) or 5·7–6·4 % HbA1c levels(1).
Dietary assessment
Dietary intake was evaluated using a validated 100-item FFQ with a common unit or portion size for each food consumed in this study population(Reference Xia, Xiang and Gu19). The FFQ included seven possible categories ranged from ‘almost never’ to ‘≥2 times/d’ for foods (including honey) and eight possible categories ranged from ‘almost never’ to ‘≥4 cups/d’ for beverages. Total energy and nutrient intakes per day were calculated by multiplying the consumption frequency of each food item by specified portion size and energy or nutrient content per g as indicated in the Chinese Food Composition Table(Reference Yang20). The validity and reliability of the FFQ were assessed by comparing 4-d (three weekdays and one weekend day) weighted dietary records with data from two FFQ collected approximately 3 months apart in a subsample of 150 Tianjin Chronic Low-Grade Systemic Inflammation and Health participants. Spearman’s correlation coefficients between the weighted diet records and FFQ were 0·49 for total energy, 0·35–0·54 for nutrients (n-3 fatty acids, fat and carbohydrate) and 0·69 for honey. Spearman’s rank correlation coefficients between two FFQ were 0·68 for total energy, 0·62–0·79 for food group (fruits, vegetables and beverages) and 0·75 for honey. To account for potential confounding effect of overall diet, we used the FFQ data to derive a posteriori dietary patterns. Briefly, participants’ dietary patterns were identified by using factor analysis with varimax rotation. Three factors were retained based on the eigenvalues, scree plot test and factor interpretability. Factors were named descriptively as follows: sweet food pattern (factor 1), healthy pattern (factor 2) and animal food pattern (factor 3). Similar dietary patterns were observed in our previous study(Reference Xia, Xiang and Gu19). For each of the dietary patterns, a higher score indicates stricter adherence to that dietary pattern.
Participants were asked how often, on average, they had consumed honey over the previous month: almost never, <1 time/week, 1 time/week, 2–3 times/week, 4–6 times/week, 1 time/d and ≥2 times/d. Then, a common portion size derived from the latest validation study of the FFQ was specified. The common portion size (18 g for men and 15 g for women, respectively) roughly represented the 50th percentiles of the validation study data(Reference Willett21,Reference Hankin, Stram and Arakawa22) . Namely, the amount of honey each time consumed was 18 g for men and 15 g for women. Based on the frequency distribution of responses, the categories of honey consumption were divided into four groups: almost never, ≤3 times/week, 4–6 times/week and ≥1 time/d. In addition, data on the intake of health care products were obtained through a structured questionnaire survey.
Assessment of covariates
Data on the following covariates were collected through well-trained investigators: age (birthdate), sex, household income, occupation, education level, smoking status, alcohol drinking status and family and personal medical history. Physical activity (PA) was assessed using the Chinese version of the International Physical Activity Questionnaire(Reference Craig, Marshall and Sjostrom23). The total amount of weekly PA was expressed in metabolic equivalent × h/week. Anthropometric measurements (height, weight and waist circumference) were obtained by trained staff using standard protocols. BMI was calculated by dividing weight (kg) by the square of height (m).
Venous blood samples were collected in siliconised vacuum plastic tubes between 08.00 and 10.00 hours. Total cholesterol and TAG were measured by an enzymatic method, LDL-cholesterol was measured by the polyvinyl sulphuric acid precipitation method and HDL-cholesterol was measured by the chemical precipitation method using appropriate kits on a Cobas 8000 analyzer (Roche). Blood pressure (BP) was measured twice after a rest of 5 min in a seated position using the TM-2655 oscillometric device (A&D). The average of two readings of BP was recorded as the BP value. Hypertension was defined as systolic BP ≥ 140 mmHg and/or diastolic BP ≥ 90 mmHg or having a history of hypertension(Reference Chobanian, Bakris and Black24). Diabetes was defined as FPG ≥ 7·0 mmol/l or having a self-reported history of diabetes. Hyperlipidaemia was defined as total cholesterol ≥ 5·17 mmol/l, or TAG ≥ 1·7 mmol/l, or LDL-cholesterol≥ 3·37 mmol/l, or the use of antilipaemic medication(25).
Statistical analysis
The normality of distribution of continuous variables was assessed with the one-sample Kolmogorov–Smirnov test. To improve the normality of the data, we used natural log transformation for all the continuous variables in analyses. Continuous variables were expressed as geometric means and 95 % CI and categorical variables as percentages. Comparisons between groups were performed using ANCOVA for continuous variables and logistic regression analysis for categorical variables by adjusting for age and sex. Adjustment for multiple comparisons was conducted using Bonferroni’s correction. The OR and 95 % CI were estimated using logistic regression model, with the lowest category (almost never) as the reference. We ran three models that included an increasing number of covariates. Model 1 was adjusted for age (continuous: years) and sex (men or women). Model 2 was additionally adjusted for BMI (continuous: kg/m2). Model 3 (fully adjusted) was adjusted for the same variables as in model 2 and further for smoking status (categorical: current smoker, ex-smoker or non-smoker), alcohol drinking status (categorical: everyday drinker, sometime drinker, ex-drinker or non-drinker), education level (categorical: < or ≥ college graduate), occupation (categorical: managers, professionals and other), household income (categorical: ≤ or >10 000 Yuan), PA (continuous: metabolic equivalent × h/week), family history of disease (including CVD, hypertension, hyperlipidaemia and diabetes (each yes or no)), hypertension (yes or no), hyperlipidaemia (yes or no), total energy intake (continuous: kJ/d), sweet food pattern score (continuous), healthy pattern score (continuous) and animal food pattern score (continuous). To calculate the P for linear trend values, we assigned the categories of honey consumption (almost never: 1; ≤3 times/week: 2; 4–6 times/week: 3; ≥1 time/d: 4) as an ordinal variable. Possible interactions between honey consumption and age, sex, BMI, sweet food pattern score, vegetable pattern score, animal food pattern score and PA were examined using the likelihood ratio test.
In sensitivity analysis, because people with honey intake usually take some health care products which may affect blood glucose, we repeated the analyses by excluding individuals with the intake of health care products. Moreover, we performed sex-specific analyses. All statistical analyses were performed with SAS 9.3 version for Windows (SAS Institute Inc.). All tests were two-tailed and P < 0·05 was considered as statistically significant.
Results
Table 1 shows participant characteristics across honey consumption categories. Participants with higher honey consumption were older, were more likely to be women and had a lower BMI, waist circumference, TAG, systolic BP, diastolic BP, FPG and a higher HDL-cholesterol. They were also more likely to engage in PA, consumed more total energy, protein, carbohydrate, fat, vegetables and fruits and had higher sweet food pattern score, healthy pattern score and animal food pattern score. In addition, participants in higher honey intake categories were more likely to be non-smokers and non-drinkers but were less likely to be everyday drinkers, sometime drinkers, and to have a family history of diabetes. The proportion of higher education, managers and higher income had reverse U-shaped association across honey intake categories. The prevalence of hypertension and hyperlipidaemia was U-shaped association across honey intake categories.
Table 1. Age- and sex-adjusted characteristics of the participants according to categories of honey consumption (n 18 281)*
(Mean values and 95% confidence intervals; numbers; percentages)

WC, waist circumference; TC, total cholesterol; SBP, systolic blood pressure; DBP, diastolic blood pressure; FPG, fasting plasma glucose; PA, physical activity; MET, metabolic equivalent.
* Continuous variables are expressed as least square geometric mean values and 95 % CI, and categorical variables are expressed as percentages.
† ANCOVA or logistic regression analysis adjusted for age and sex where appropriate.
‡ To convert kcal to kJ, multiply by 4·184.
Table 2 presents participant characteristics by prediabetes status. Compared with participants without prediabetes, those with prediabetes tended to be older, were more likely to be men and had higher BMI, waist circumference, total cholesterol, TAG, LDL-cholesterol, systolic BP, diastolic BP, FPG and lower HDL-cholesterol. Those with prediabetes were more likely to be current smokers, everyday drinkers and sometime drinkers but were less likely to be non-drinkers. Furthermore, those with prediabetes were to be less educated, were less likely to be employed as managers and professionals and had a higher prevalence of hypertension, hyperlipidaemia and family history of diabetes. No statistical differences were observed in other variables between the two groups.
Table 2. Age- and sex-adjusted characteristics of the participants by prediabetes status (n 18 281)*
(Mean values and 95% confidence intervals; numbers; percentages)

WC, waist circumference; TC, total cholesterol; SBP, systolic blood pressure; DBP, diastolic blood pressure; FPG, fasting plasma glucose; PA, physical activity; MET, metabolic equivalent.
* Continuous variables are expressed as least square geometric mean values and 95 % CI, and categorical variables are expressed as percentages.
† ANCOVA or logistic regression analysis adjusted for age and sex where appropriate.
‡ To convert kcal to kJ, multiply by 4·184.
Adjusted associations between honey consumption and prediabetes are showed in Table 3. Age- and sex-adjusted OR of prediabetes across the categories of honey consumption were 1·00 (95 % CI reference) for almost never, 0·88 (95 % CI 0·81, 0·96) for ≤3 times/week, 0·72 (95 % CI 0·59, 0·88) for 4–6 times/week and 0·79 (95 % CI 0·68, 0·92) for ≥1 time/d (P for trend <0·0001). Age-, sex- and BMI-adjusted OR of prediabetes across the increasing categories of honey consumption were 1·00 (95 % CI reference), 0·91 (95 % CI 0·84, 0·99), 0·76 (95 % CI 0·62, 0·92) and 0·84 (95 % CI 0·72, 0·97) (P for trend = 0·001). After fully adjusting for covariates, the OR of prediabetes across the increasing categories of honey consumption were 1·00 (95 % CI reference), 0·94 (95 % CI 0·86, 1·02), 0·77 (95 % CI 0·63, 0·94) and 0·85 (95 % CI 0·73, 0·99) (P for trend <0·01). Furthermore, interactions between honey consumption and age (<40 and ≥40 years), sex, BMI (<24 and ≥24 kg/m2), sweet food pattern score, healthy pattern score, animal food pattern score and PA were not statistically significant (all P for interaction >0·10).
Table 3. Adjusted association between honey consumption and prediabetes (n 18 281)
(Odds ratios and 95 % confidence intervals; numbers)

* Obtained by using logistic regression model. The P for trend values were calculated by using the categories of honey consumption (almost never: 1; ≤3 times/week: 2; 4–6 times/week: 3; ≥1 time/d: 4) as an ordinal variable.
† Model 1, adjusted for age (continuous: years) and sex (men or women).
‡ Model 2, adjusted for age (continuous: years), sex (men or women) and BMI (continuous: kg/m2).
§ Model 3, further adjusted for smoking status (categorical: current smoker, ex-smoker or non-smoker), alcohol drinking status (categorical: everyday drinker, sometime drinker, ex-drinker or non-drinker), educational level (categorical: < or ≥ college graduate), occupation (categorical: managers, professionals and other), household income (categorical: ≤ or >10 000 Yuan), physical activity (continuous: metabolic equivalent × h/week), family history of disease (including CVD, hypertension, hyperlipidaemia and diabetes (each yes or no)), hypertension (yes or no), hyperlipidaemia (yes or no)), total energy intake (continuous: kJ/d), sweet food pattern score (continuous), healthy pattern score (continuous) and animal food pattern score (continuous). Sugar consumption was mainly included in the sweet food pattern.
In sensitivity analysis, similar results were observed when we excluded participants with the intake of health care products (data not shown). Moreover, the inverse association was consistent in subgroup defined by sex (Fig. 2).
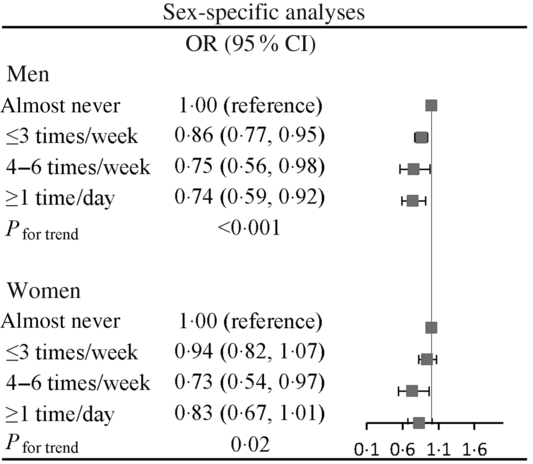
Fig. 2. Association of honey consumption with prediabetes stratified by sex. Adjusted for age, BMI, smoking status, alcohol drinking status, educational level, occupation, household income, physical activity, family history of disease (including CVD, hypertension, hyperlipidaemia and diabetes), hypertension, hyperlipidaemia, total energy intake, sweet food pattern score, healthy pattern score and animal food pattern score.
Discussion
In this large-scale study of adults, we found that honey consumption was inversely associated with the prevalence of prediabetes. The inverse association was persisted after extensive adjustments for confounding factors. Moreover, the results of the sensitivity analysis showed the robustness of these associations. To the best of our knowledge, it is the first population-based study to examine the association between honey consumption and prediabetes.
Two 8-week clinical trials among type 2 diabetes patients showed consumption of honey could increase HbA1c of patients, suggesting that honey should be consumed with caution in individuals with diabetes(Reference Sadeghi, Salehi and Kohanmoo26,Reference Bahrami, Ataie-Jafari and Hosseini27) . Another 4-week randomised controlled trial in seventy young healthy adults showed that 70 g honey intake raised FPG levels(Reference Majid, Younis and Naveed28). However, an experimental study showed that a low dose of honey (30 g) could be a valuable sugar substitute for type 2 diabetic patients(Reference Nazir, Samad and Haroon29). These inconsistent results might be due to different doses of honey intake in human studies. Furthermore, since type 2 diabetes is a severe progression of a disorder of glucose metabolism, the effect of honey intake on prediabetes is unclear. Our present study found the significant inverse association of honey intake with prediabetes. The findings are consistent with the results of animal studies suggesting the beneficial effect of honey on glycaemic control(Reference Chepulis and Starkey30,Reference Erejuwa, Sulaiman and Wahab31) . Future prospective studies or randomised control trials are needed to confirm the association between honey intake and prediabetes.
Honey is a mixture of many constituents, making it difficult to ascertain which component contributes to its hypoglycaemic effect. However, there were several possible mechanisms that could partly explain the inverse association between honey consumption and prediabetes. First, honey is a natural substance rich in fructose (21·0–43·5 %) and glucose(Reference Erejuwa, Sulaiman and Wahab32). There is compelling evidence suggesting that fructose in honey might contribute to the hypoglycaemic effect of honey(Reference Erejuwa, Sulaiman and Wahab32). The biological mechanisms might be that fructose and glucose could increase intestinal fructose absorption and stimulate insulin secretion via their synergistic effect in the gastrointestinal tract and pancreas. Second, honey is rich in various bioactive compounds including phenolics, flavonoids, vitamins and organic acids(Reference Meo, Al-Asiri and Mahesar10). These compounds have been known as effective antioxidants. Anti-oxidative properties of honey may reduce oxidative stress(Reference Ramli, Chin and Zarkasi13), which is one of the main mechanisms for developing prediabetes(Reference Evans, Maddux and Goldfine33). Moreover, animal studies suggested that the hypoglycaemic effect of honey might be attributed to its anti-oxidative effect on the pancreas(Reference Erejuwa, Sulaiman and Wahab34). Therefore, honey might have a protective role in prediabetes development via its anti-oxidative properties. Third, inflammation has been shown to play an important role in the pathogenesis of prediabetes(Reference Akash, Rehman and Chen35). Several animal studies showed that honey possesses a potent anti-inflammatory effect(Reference van den Berg, van den Worm and van Ufford36,Reference Ahmad, Khan and Mesaik37) . Finally, honey may increase insulin sensitivity, thereby improving insulin resistance(Reference Ramli, Chin and Zarkasi13). Studies have shown that insulin resistance is the main determinant of developing prediabetes(Reference Cai, Xia and Pan38).
The major strengths of this study include the large sample size and detailed data on potential confounders. Moreover, to our knowledge, this is the first report of an association between honey consumption and prediabetes in the general population. This study has some limitations. First, the cross-sectional nature of the present study cannot speak to a temporal association between honey and prediabetes. Therefore, a prospective study is needed to confirm the association. Second, in this study, we did not collect data on different types of honey. However, honey has varying components according to the environmental conditions and geographical location of the floral sources(Reference Meo, Al-Asiri and Mahesar10). Furthermore, there are hundreds of thousands of honey brands with totally different quality in China. However, information on honey brands was not available in the present study. Therefore, whether any types or brands of honey were more beneficial than others is not clear. Third, although FFQ has been widely used in nutritional epidemiological studies, this method has limitations, especially its reliance on participant self-report and memory. However, in this study, honey intake assessed by the FFQ has high correlation with 4-d weighted dietary records (Spearman’s correlation coefficient equals 0·69). Nevertheless, FFQ cannot accurately assess individual intake(Reference Willett21). Therefore, physiological research or study based on weighted diet records is more suitable for determining a cut-off point concerning the beneficial effect of honey on prediabetes. Finally, as with any observational study, we cannot address residual confounding in the present study(Reference Agoritsas, Merglen and Shah39). Therefore, further randomised controlled trials are required to confirm these findings.
Conclusions
In conclusion, this study was the first to show an inverse association between honey consumption and prediabetes in the general population. These results suggested that honey intake may be beneficial for the prevention and treatment of prediabetes. Further prospective studies are needed to confirm this finding.
Acknowledgments
The authors gratefully acknowledge all the people who have participated in this study.
This study was supported by grants from the National Natural Science Foundation of China (no. 81872611).
S. Z. and K. N. analysed data and wrote the paper. S. Z., S. K., Y. G., X. L., G. M., Q. Z., L. L., H. W., Y. W., T. Z., X. W., X. C., H. L., Y. L., X. W., S. S., X. W., M. Z., Q. J., K. S. and Z. S. conducted research. K. N. designed research and had primary responsibility for final content. All authors have read and approved the final manuscript.
There are no conflicts of interest.


