


Globally, the prevalence of obesity among adults has nearly quadrupled over the past four decades (NCD Risk Factor Collaboration, 2017). In 2017, 4.72 million deaths and 148 million disability-adjusted life years (DALYs) were attributable to high body mass index (BMI) (GBD 2017 Risk Factor Collaborators, 2018). Genetic components and unhealthy lifestyles undoubtedly play a key role in the development of obesity; however, the pathogenic mechanism has not yet been fully explained (Zhang et al., Reference Zhang, Sun and Wang2012). In recent years, with the continuous emergence of new technologies, the rapid development of omics research may help to obtain a detailed molecular view of the pathology of complex diseases.
Metabolomics is a powerful tool to investigate the relationships between serum metabolites and disease states. Recent advances have allowed for high-throughput targeted or untargeted exploration of the metabolite changes in body fluids and tissues that may reflect physiological dysfunction and mirror earlier stages of metabolism disorders. In recent years, metabolomics is increasingly used to explore the pathology of metabolic diseases like obesity (Kraus et al., Reference Kraus, Pieper, Huffman, Thompson, Kraus, Morey and Newgard2016; Moore et al., Reference Moore, Matthews, Sampson, Stolzenberg-Solomon, Zheng, Cai and Cross2014; Pietiläinen et al., Reference Pietiläinen, Sysi-Aho, Rissanen, Seppänen-Laakso, Yki-Järvinen, Kaprio and Orešič2007; Rauschert et al., Reference Rauschert, Uhl, Koletzko and Hellmuth2014). Aromatic amino acids (AAA) (Ho et al., Reference Ho, Larson, Ghorbani, Cheng, Chen, Keyes and Wang2016; Moore et al., Reference Moore, Matthews, Sampson, Stolzenberg-Solomon, Zheng, Cai and Cross2014; Short et al., Reference Short, Chadwick, Teague, Tullier, Wolbert, Coleman and Copeland2019), branched-chain amino acids (BCAA; Ho et al., Reference Ho, Larson, Ghorbani, Cheng, Chen, Keyes and Wang2016; Newgard et al., Reference Newgard, An, Bain, Muehlbauer, Stevens, Lien and Slentz2009; Short et al., Reference Short, Chadwick, Teague, Tullier, Wolbert, Coleman and Copeland2019), nonesterified fatty acids (Newgard et al., Reference Newgard, An, Bain, Muehlbauer, Stevens, Lien and Slentz2009; Zeng et al., Reference Zeng, Liang, Li, Wang, Wang, Chen and Wu2010), acylcarnitines (Mihalik et al., Reference Mihalik, Michaliszyn, de Las, Bacha, Lee, Chace and Arslanian2012) and phospholipids (Pietiläinen et al., Reference Pietiläinen, Sysi-Aho, Rissanen, Seppänen-Laakso, Yki-Järvinen, Kaprio and Orešič2007) were reported to be associated with obesity. These metabolites might indicate important biological processes or represent intermediate phenotypes linking genetic and environmental factors of obesity and its related diseases.
Twin studies are unique for identifying genetic and environmental determinants of human phenotypes or traits due to identical (monozygotic; MZ) or partly shared (dizygotic; DZ) genome backgrounds. Previous twin studies showed genetic factors explain 54–81% of the interindividual variation in BMI (Nan et al., Reference Nan, Guo, Warner, Fowler, Barrett, Boomsma and Zeegers2012; Zhou et al., Reference Zhou, Li, Lyu, Yu, Wang, Pang and Cao2015) while heritability for most serum metabolites ranged from 21% to 79% (Kettunen et al., Reference Kettunen, Tukiainen, Sarin, Ortega-Alonso, Tikkanen, Lyytikainen and Ripatti2012), demonstrating a genetic basis for individual differences in serum metabolite concentrations.
To the best of our knowledge, most of the evidence of metabolomic study on obesity has been from the European populations. Thus, using Chinese adult MZ twins, we aimed to identify obesity-related serum metabolites and potential metabolic pathways.
Methods
Study Population and Design
The Chinese National Twin Registry (CNTR) is one of the largest population-based twin registries in China. In 2013, a questionnaire survey, physical examinations and fasting blood sampling were conducted among 1147 adult twin pairs across 4 areas of China (Shandong, Jiangsu, Zhejiang and Sichuan). Furthermore, DNA was collected and whole-genome genotyping was conducted on 469 twins. The zygosity of these twins was determined by DNA analysis. The study has been described elsewhere in detail (Li et al., Reference Li, Gao, Yu, Lv, Cao, Zhan and Hu2013). All participants provided written informed consent. The Biomedical Ethics Committee at Peking University (Beijing, China) approved the study.
Metabolomics detection met the following inclusion criteria in this study: aged more than 18 years; reared-together twins; blood donors without histories of cardiovascular disease and cancer; DNA determined zygosity information. Thus, we finally included 439 twins containing 215 twin pairs for this analysis.
Obesity Measurements
Obesity measures collected in this study wereBMI, waist circumference (WC), waist-to-hip ratio (WHR) and percent body fat (%BF). Standing height and weight of twins was measured using a stadiometer (0.1 cm) and a digital balance (TANITA, Tokyo, Japan, 0.1 kg), respectively. BMI was calculated as weight in kilograms divided by height in meters squared. WC and hip circumference were measured twice using a nonstretchable tape. WC was measured at the umbilicus, while hip circumference was at the widest part of the buttocks and the mean values were used in the analyses. WHR was the ratio of WC and hip circumference. The %BF was measured by bioelectrical impedance (Body Composition Analyzer/Scale, TANITA).
Biochemical Measurements
Venous blood samples were drawn from the study subjects after a 12-hour fast. Serum total cholesterol (TC), triglycerides (TG), high-density lipoprotein cholesterol (HDL-C), low-density lipoprotein cholesterol (LDL-C), glucose (Glu) and serum insulin were measured in this sample, described in detail elsewhere (Liao et al., Reference Liao, Gao, Cao, Lv, Yu, Wang and Li2015). Insulin resistance was estimated according to homeostasis model assessment (HOMA-IR; HOMA-IR = [fasting glucose (mmol/l) × insulin (U/ml)]/22.5). To minimize the effects of assay variability, samples from each twin pair were analyzed using the same assay.
Untargeted Metabolomic Measurements
Sample preparation and analysis
High-resolution metabolomics profiling of MZ and DZ twins was completed using liquid chromatography with high-resolution mass spectrometry. All serum samples were analyzed with a 2777C Ultra (High)-Performance Liquid Chromatography (UPLC) system (Waters, Massachusetts, USA) connected to an SYNAPT G2 XS QTOF mass spectrometer (Waters, Massachusetts, USA) with electrospray ionization (ESI).
A quality control (QC) sample was made by mixing and blending equal volumes (20 μL) from each serum sample. QC was used to represent all the analytes encountered during analysis. For serum samples, 100 μL of the sample was mixed with 200 μL of methanol to precipitate protein. The mixture was then centrifuged at 14, 000 g for 10 min at 4°C. The supernatant was transferred into a 1.5 ml polypropylene tube for the following metabolic profiling experiment. In order to ensure system equilibrium, 10 pooled QC samples were injected at the beginning of the experiment. The QC samples were injected between every 10 samples to monitor system stability during the whole experiment. Metabolite features were detected with an SYNAPT-G2XS QTOF mass spectrometer in both positive and negative ion modes.
Data Processing and Identification of Metabolites
The raw tandem mass spectrometry datasets were processed using commercial software Progenesis QI 2.0 (Nonlinear Dynamics, Newcastle, UK), consisting of raw data import, selection of possible adducts, peak alignment, peak detection, deconvolution, dataset filtering and noise reduction. Intensities of each peak were recorded and a three-dimensional matrix containing arbitrarily assigned peak indices (retention time and m/z pairs), sample names (observations) and ion intensity information (variables) was generated. In order to obtain consistent results, the obtained matrix was further reduced by removing peaks with more than 80% missing values (ion intensity = 0). PCA was performed for outlier detection and batch effects evaluation using the preprocessed dataset. As a quality assurance strategy in metabolic profiling, all retained peaks were normalized to the QC sample using Robust Loess Signal Correction (R-LSC) based on the periodic analysis of a standard biological QC sample together with the real plasma samples. The relative standard deviations of the metabolic features were calculated across all QC samples, and those >30% were then removed. The untargeted metabolic analysis yielded 5580 features in the positive ion mode and 5634 features in the negative ion mode. Normalization by median was used as sample normalization and log transformation, and scaling by standard deviation was used as data normalization. Metabolites were confirmed by comparison of accurate mass m/z, retention time and ion intensity to online human metabolome databases (www.hmdb.ca, level 2 confirmation) or authentic reference standards (level 1 confirmation) and only these confirmed metabolites (76 features in the positive ion mode and 73 features in the negative ion mode) were used in the following analysis. Positive ESI and negative ESI data were analyzed and summarized separately.
Assessment of Covariates
We obtained covariates from questionnaire, including sociodemographic characteristics (age, sex, region and educational level) and lifestyle behaviors (tobacco smoking, alcohol drinking, diet and physical activity). Region was assessed by place of residence (Shandong, Zhejiang, Jiangsu, Sichuan provinces). Educational level was defined as illiterate, primary school graduated, secondary school graduated, high school graduated and above. Tobacco smoking was coded into three categories (never, former, current) according to participants’ responses to ‘Do you smoke?’. Alcohol drinking status was similarly defined depending on their responses to ‘Do you drink alcohol?’. Physical activity was measured as a quintile of weekly metabolic equivalent of tasks measured by a Chinese version of the International Physical Activity Questionnaire (Macfarlane et al., Reference Macfarlane, Chan and Cerin2011). Diet was measured by three variables: the frequency of having red meat in the past year, quintile of weekly fresh fruit (grams) consumption and quintile of weekly fresh vegetable (grams) consumption.
Statistical Analysis
Metabolomewide association study of obesity measures
Linear mixed models were implemented to explore the associations between metabolites and multiple obesity measures. We modeled each metabolite as a function of the log-transformed BMI, WC, WHR or %BF using linear mixed models adjusted for age, sex, zygosity, study sites, smoking, drinking, diet, physical activity, education and test batch as fixed effects, and potential correlation within twin pairs was accounted for by including a random intercept (Carlin et al., Reference Carlin, Gurrin, Sterne, Morley and Dwyer2005).
A sensitivity analysis was conducted by comparing the results with subjects without self-reported type 2 diabetes, or additionally adjusted for hypoglycemic/hypolipidemic drug use in recent months.
Second, to investigate whether these associations were confounded by genetic factors, we applied linear fixed models within MZ twin pairs adjusting for study sites, smoking, drinking, diet, physical activity, education and test batch. The within-twin-pair approach automatically takes into account shared genetic and environmental influences.
To better take the advantages of twins, we used an empirical Bayes-paired moderated t test to detect differential metabolites between obesity-discordant MZ twin pairs that were found in the above MZ twin-pair analysis. Discordant for obesity was defined as a BMI of 27 kg/m2 or higher in one twin while being less than 24 kg/m2 in their co-twin (ΔBMI > 3 kg/m2).
All analyses were implemented in R 3.1.2 and we set the threshold for statistical significance at a false discovery rate (FDR) q value of 0.05 or less, accounting for all metabolites.
Pearson correlations between metabolites with clinical biochemical indications
The correlations between metabolites and clinical variables were calculated using Pearson correlations both individually and by twin-pair among MZ twins. The logarithmic transformation was carried out to better conform to the normal distribution. In within-pair analysis, biochemical variables and metabolomics data were twin-normalized by taking the within-pair difference of the log2-transformed concentration values for each variable. The reported p value is the probability of getting a correlation as large as the observed value by random chance, when the true correlation is zero. All analyses were implemented in R 3.1.2 and the levels of significance are marked as p < .05.
Bioinformatics analysis
MetabolAnalyst 4.0 (http://www.metaboanalyst.ca/MetaboAnalyst/) was used to perform informatics analysis. MetaboAnalyst combines the results from powerful pathway enrichment analysis with the pathway topology analysis to discover the relevant pathways. The module of pathway analysis was based on the KEGG database. The p value and impact value threshold, as calculated via the analysis of pathway topology, were set to 0.05 and 0.1. Metabolite set enrichment analysis (MSEA) was performed based on Small Molecule Pathway Database (SMPDB, http://smpdb.ca/) using over-representation analysis (ORA) algorithms to identify biologically meaningful patterns significantly enriched in quantitative metabolomics.
All analyses described above were summarized in Figure 1.
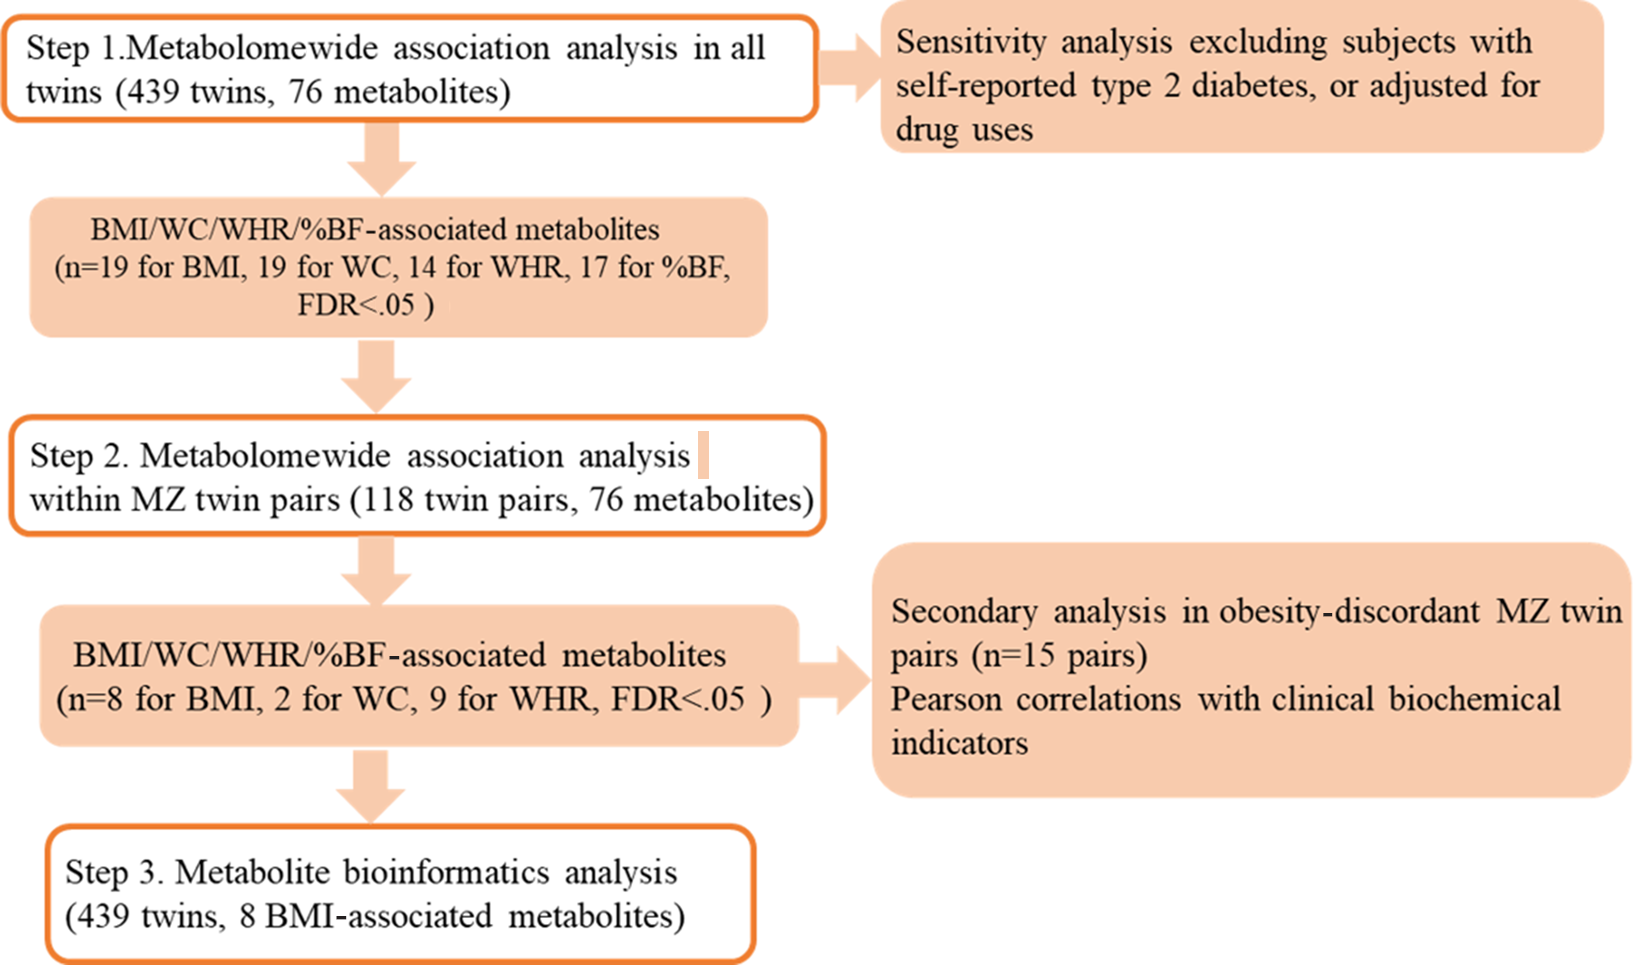
Fig. 1. Analyses framework of metabolomewide association analysis of obesity measures. Note: MZ = monozygotic; BMI = body mass index; WC = waist circumference; WHR = waist-to-hip ratio; %BF = percent body fat.
Results
The study participants collected 439 twins containing 215 twin pairs (118 MZ twin pairs), with an average age of 45.1 years (range 18.0–80.9 years, 66.5% were males and 54.9% MZ twins; Table 1).
Table 1. Characteristics of the 439 twins

Note: Current smokers: someone who smoked one or more cigarettes per day in the past half year; current regular drinkers: someone who drank more than 20 grams of ethanol per week in the past half year.
Metabolomewide Association Study of Obesity Measurements
We first regressed 76 metabolites identified in negative ion mode against obesity measures (BMI, WC, WHR, %BF) in all twins. We defined 69 associations that remained significant after FDR adjustment (Supplementary Table 1). The 69 associations were formed between 23 metabolites and obesity measures. Sensitivity analysis further adjusted for hypoglycemic or hypolipidemic drugs did not substantially change our results. When participants with type 2 diabetes were excluded, the associations of obesity measures with the hexoses and other metabolites remained significant (Supplementary Table 2a and b).
To assess whether any of the significant associations between the metabolites and obesity measures were confounded by genetic or shared environmental factors, we performed within-twin-pair comparisons using all 118 MZ twin pairs; 19 of the 69 associations remained significant after FDR adjustment, which was formed between 11 metabolites and the obesity measures (Table 2). Eight significant associations (L-phenylalanine, L-isoleucine, L-tyrosine, uric acid, N-methyl-D-aspartic [NMDA ]acid, C6H12O6, D-tryptophan and L-glutamine) remained in analysis with BMI, two significant associations (L-isoleucine and L-tyrosine) remained in analysis with WC and nine significant associations (L-tyrosine, NMDA acid, L-isoleucine, uric acid, L-phenylalanine, C6H12O6, PE(20:2(11Z,14Z)/0:0), PE(20:1(11Z)/0:0) and suberic acid) remained in analysis with WHR. These associations are independent of confounding by factors shared by the co-twins, and are rather due to unique environmental factors experienced by the individual twins.
Table 2. Significant metabolites with obesity measures in monozygotic within-twin-pair analysis

Note: RT_M/Z = retention time(min)_mass-to-charge ratio; BMI = body mass index; WC = waist circumference; WHR = waist to hip ratio. logFC is the log fold change of metabolite values that associates with the ratio of the higher phenotype value over the lower phenotype values. The regression analysis was using linear fixed model adjusting for smoking, drinking, diet, physical activity, education and test batch for each phenotype.
According to our definition of ‘discordant obesity’, only 15 pairs of MZ twins were found with this condition. The distribution of obesity measures and clinical blood biochemical indicators are presented in Supplementary Table 3. Besides obesity measures, the serum level of insulin was different between the two groups. Most of the metabolites were differential between obesity-discordant MZ twin pairs (Table 3).
Table 3. Differential metabolites in obesity-discordant monozygotic twin-pair analysis

Note: RT_M/Z = retention time(min)_mass-to-charge ratio; logFC is the log fold change of metabolite values that associates with the ratio of the higher phenotype value over the lower phenotype values. The analysis used an empirical Bayes-paired moderated t test adjusted for smoking, drinking and test batch.
In terms of the analysis in positive ion mode, we defined seven associations that remained significant after FDR adjustment (Supplementary Table 4). These associations were formed between three metabolites and obesity measures. Excluding participants with type 2 diabetes or further adjusting for hypoglycemic or hypolipidemic drugs did not substantially change our results (Supplementary Table 5a and b). Within-twin-pair linear regression and matched case control of obesity-discordant MZ twins did not identify any significant metabolites.
Table 4. Pearson correlations between 4 amino acids with clinical biochemical measurements in 241 monozygotic twins

Note: RT_M/Z:retention time(min)_mass-to-charge ratio; TC = total cholesterol; TG = triglycerides; HDL-C = high-density lipoprotein cholesterol; LDL-C = low-density lipoprotein cholesterol; HOMA-IR = homeostasis model assessment of insulin resistance. *C6H12O6, galactose/mannose/glucose; MZ indiv., Pearson correlations were calculated treating monozygotic twins as individuals; MZ pair, Pearson correlations were calculated treating monozygotic twins as pairs (115 pairs).
The bold type indicates the correlation was significant at p < .05.
Pearson Correlation between Metabolites with Clinical Biochemical Indications
The analyses showed positive correlations of L-phenylalanine, L-isoleucine and L-tyrosine with serum insulin, HbA1c, HOMA, TC, TG and LDL-C; whereas, L-glutamine showed negative correlations with the abovementioned biomarkers (Table 4). The correlation between L-isoleucine and TC was significant in MZ twin-pair analysis as well as C6H12O6 with HDL-C, LDL-C and Glu. Most of the correlations were weakened in the twin-pair analysis.
Metabolic Pathway Analysis and Biological Significance Interpretation
The result of pathway analysis is shown in Figure 2A and Supplementary Table 6, and 10 metabolic pathways were identified, which relates to the proportion of phenylalanine metabolism that is significantly perturbed, followed by tyrosine metabolism, valine, leucine and isoleucine biosynthesis and purine metabolism. Furthermore, in order to expand the understanding of metabolic pathway related to BMI, the module of enrichment analysis was used, which found six additional pathways, including catecholamine biosynthesis, thyroid hormone synthesis, nucleotide sugars metabolism, sphingolipid metabolism, galactose metabolism and lactose degradation significantly related to BMI (Figure 2B and Supplementary Table 7).

Fig. 2. The results of pathway analysis and enrichment analysis of the metabolomics data. Note: (A) Pathway analysis is based on Kyoto Encyclopedia of Genes and Genomes (KEGG). The color and size of each circle are based on p values (yellow: higher p values and red: lower p values) and pathway impact values (the larger the circle the higher the impact score) calculated from the topological analysis, respectively. Pathways were considered significantly enriched if p < .05, impact 0.1 and number of metabolite hits in the pathway >1. (B) Enrichment analysis is based on Small Molecule Pathway Database (SMPDB). The color of the bar indicates the p value. The length of the bar indicates the fold enrichment.
Discussion
The present metabolomewide association study based on serum blood samples identified several obesity-related metabolites using untargeted metabolomic measurements in a Chinese twin sample. Eleven metabolites were associated with BMI, WC and WHR after controlling for genetic and shared environmental factors. Bioinformatics analysis identified pathways such as phenylalanine metabolism, purine metabolism, valine, leucine and isoleucine biosynthesis were associated with obesity. Besides, isoleucine showed a significant positive correlation with TC in MZ twin-pair analysis.
We first identified metabolites that were significantly associated with different obesity measures in individual twins. Many of these obesity-associated metabolites were organic acids and derivatives followed by lipids/lipid-like molecules. BMI was associated with more metabolites than any of the other studied obesity measures (WC, WHR, %BF) in this study. We found that 80% of metabolites associated with WC was also associated with BMI, and nearly all the metabolites associating with %BF was also associated with BMI. Besides, all the metabolites associated with WHR were associated with both WC and BMI. These overlaps in the metabolites reflect known high correlations between the different obesity measures (Menke et al., Reference Menke, Muntner, Wildman, Reynolds and He2007).
L-phenylalanine, L-isoleucine, L-tyrosine, uric acid, NMDA acid, D-(+)-galactose, D-tryptophan remained positively associated with BMI while L-glutamine was negatively associated with BMI in within-twin-pair analysis. Further, the obesity-discordant MZ twin-pair analysis found significantly different levels in most metabolites between co-twins. It has been known for many years that isoleucine (Bogl et al., Reference Bogl, Kaye, Ramo, Kangas, Soininen, Hakkarainen and Pietilainen2016; Muniandy et al., Reference Muniandy, Velagapudi, Hakkarainen, Lundbom, Lundbom, Rissanen and Ollikainen2019; Vogelzangs et al., Reference Vogelzangs, van der Kallen, van Greevenbroek, van der Kolk, Jocken, Goossens and Arts2020), tyrosine (Ho et al., Reference Ho, Larson, Ghorbani, Cheng, Chen, Keyes and Wang2016; Muniandy et al., Reference Muniandy, Velagapudi, Hakkarainen, Lundbom, Lundbom, Rissanen and Ollikainen2019), phenylalanine (Bogl et al., Reference Bogl, Kaye, Ramo, Kangas, Soininen, Hakkarainen and Pietilainen2016; Ho et al., Reference Ho, Larson, Ghorbani, Cheng, Chen, Keyes and Wang2016; Newgard et al., Reference Newgard, An, Bain, Muehlbauer, Stevens, Lien and Slentz2009), tryptophan (Kim et al., Reference Kim, Park, Kim, Ham, Kim, Kwon and Lee2010) and glutamine (Chashmniam et al., Reference Chashmniam, Hashemi, Nobakht, Safari-Alighiarloo and Khamseh2020; Oberbach et al., Reference Oberbach, Bluher, Wirth, Till, Kovacs, Kullnick and von Bergen2011) were biomarkers for obesity, but the studies were mainly conducted in Caucasian populations or Nordic twin samples. We first confirmed these results in a Chinese population using an MZ co-twin study. Significant within-twin-pair associations between these metabolite levels and BMI point to unique environmental factors rather than the shared factors between co-twins as an underlying contributor.
It has been shown that oxidation during obesity blunts amino acid metabolism in adipose tissue, therefore resulting in the accumulation of the L-isoleucine in the bloodstream (Hanzu et al., Reference Hanzu, Vinaixa, Papageorgiou, Parrizas, Correig, Delgado and Gomis2014; Pietilainen et al., Reference Pietilainen, Naukkarinen, Rissanen, Saharinen, Ellonen, Keranen and Peltonen2008). In Pearson correlation analysis, L-isoleucine showed a significant positive correlation with TC in MZ twin-pair analysis. Both were risk factors for obesity and related type 2 diabetes (Wang et al., Reference Wang, Larson, Vasan, Cheng, Rhee, McCabe and Gerszten2011).
Phenylalanine metabolism has the highest impact score in our pathway analysis (Figure 1). High levels of phenylalanine and its downstream product, L-tyrosine, are observed in obese subjects of previous metabolomics studies in twins (Bogl et al., Reference Bogl, Kaye, Ramo, Kangas, Soininen, Hakkarainen and Pietilainen2016; Muniandy et al., Reference Muniandy, Velagapudi, Hakkarainen, Lundbom, Lundbom, Rissanen and Ollikainen2019). The liver is an important organ for phenylalanine metabolism, and phenylalanine metabolism has been proposed as a test of liver function (Lara et al., Reference Lara, Razquin, Jimenez, Vazquez, Gisbert and Pajares2000). Our findings in phenylalanine metabolism might indicate the involvement of liver dysfunction among obese individuals.
Further, enrichment analysis indicated that catecholamine biosynthesis, purine metabolism and sphingolipid metabolism might be involved in obesity development. Catecholamine functions as neurotransmitters and hormones within the body. Alterations in the sympathetic nervous system (SNS) effects on the metabolism have been implicated in the development and maintenance of obesity and insulin resistance (Da et al., Reference Da, Do, Li, Wang, Mouton and Hall2020; Li et al., Reference Li, Zhang, Man, Chiu, Lo, To and Keng2020). Experimental studies also found that activation of SNS may promote the development of hypertension in the rat model of obesity (Young et al., Reference Young, Daly, Uemura and Chaouloff1994). Results of these studies indicate the importance of SNS in regulating metabolic status in obesity. Uric acid in purine metabolism can induce oxidative stress, and activate NADPH oxidase and the renin–angiotensin system, which all play an important role in the pathophysiology of obesity and related metabolic dysregulation (Sautin et al., Reference Sautin, Nakagawa, Zharikov and Johnson2007; Zhang et al., Reference Zhang, Zhang, Wu and Chen2015). Sphingolipids are bioactive lipids involving in cellular signaling and regulatory functions (Hannun & Obeid, Reference Hannun and Obeid2008). Using an experimental model, Choi and Snider (Reference Choi and Snider2015) found that sphingolipid metabolism is significantly affected by dietary nutrient oversupply, and dysregulation of sphingolipids contributes to obesity-related cardiovascular disease. The bioactive lipids in sphingolipid metabolism may function as mediators between obesity and increased risk of metabolic dysfunction.
NMDA acid is a new obesity-related metabolite found in our study. NMDA acid is an amino acid derivative acting as a specific agonist at the NMDA receptor. A previous study has found that activation of NMDA receptors in the dorsal vagal complex lowers Glu production and may serve as a therapeutic target for diabetes and obesity (Lam et al., Reference Lam, Chari, Su, Cheung, Kokorovic, Yang and Lam2010). Experimental studies suggested that NMDA increased the levels of reactive oxygen species (ROS), cytosolic cytochrome c (cyto c) and 17-kDa caspase-3, but depolarized mitochondrial membrane potential, leading to cardiomyocyte apoptosis (Gao et al., Reference Gao, Xu, Pang, Zhang, Ding, Peng and Cao2007; Urushitani et al., Reference Urushitani, Nakamizo, Inoue, Sawada, Kihara, Honda and Shimohama2001). Combined with our results, this may be the pathologic mechanism of obesity-induced cardiovascular disease. However, further studies are warranted to elucidate precise mechanisms and understanding of the role of NMDA in obesity.
Using a twin design combined with an untargeted metabolomic study to better control for confounders, we observed different associations between adiposity and serum metabolite profile. However, several limitations need to be discussed. First, the cross-sectional study design limited the causal interpretation between metabolite profile and obesity traits. Another limitation of our study was the limited number of metabolites identified. Although we used an untargeted approach to assess thousands of metabolite features, only a small fraction can be identified.
In conclusion, obesity is associated with changes in the serum metabolome toward increased risk of metabolic dysfunction. Our findings verified the association of phenylalanine, isoleucine, tyrosine, uric acid and tryptophan with obesity traits in a Chinese twin population, controlling for genetic and shared environmental factors, and additionally identified the important role of NMDA acid. Differing environments within MZ twin pairs might produce epigenetic differences and result in the differing metabolite levels. Further cohort studies with a larger sample size and more diverse biological sample types are needed to replicate our findings.
Acknowledgments
We thank all study participants, research staffs and graduate students who were involved in this study.
Author contributions
CX L was mainly responsible for the design, analyses and drafting of the manuscript. LM L was the principle investigator of this study. WJ G contributed to the conception and design of the study, oversaw the consenting and participated in manuscript polishing. CW H, J L, T H, DJY S and SF W contributed to the conception and design of the study and interpreting the findings. CQ Y participated in data management and cleaning. BQ W contributed to the data analysis. ZC P, LM C, HW and XP W contributed to the implementation of the study. All authors contributed to the interpretation of results and intellectual content of the manuscript, and have read and approved the final manuscript.
Financial support
This study was supported by the Special Fund for Health Scientific Research in Public Welfare (201502006, 201002007), and the Key Project of Chinese Ministry of Education (310006).
Conflict of interest
None.
Ethical standards
This study was conducted in accordance with the Declaration of Helsinki.
Supplementary material
To view supplementary material for this article, please visit https://doi.org/10.1017/thg.2021.3.


