


The intestinal inflammatory diseases are still a major problem for public health, with an increased incidence and impact on life quality. These diseases, also known as inflammatory bowel disease (IBD), represent a group of disorders characterised by chronic inflammation of gastrointestinal tract( Reference Ueda, Kawakami and Kunii 1 , Reference Sanchez-Munoz, Dominguez-Lopez and Yamamoto-Furusho 2 ). The treatments are focused on the management of the inflammatory status which sometimes are inadequate. The identification of new and safety compounds for preventing or treating IBD is a clinical need in IBD therapy( Reference Sergent, Meurice and Toussaint 3 ). In the last years, the alternative strategies including plant-based remedies and microorganism are promising alternative therapy for IBD( Reference Cho, Shin and Noh 4 ).
Polyphenols are plant metabolites known and used mainly for their antioxidant, anti-inflammatory and anti-microbial properties, which could contribute to digestive health( Reference Romier, Van De Walle and During 5 ). Both in vitro and in vivo studies suggest that phenolic compounds, as natural alternative therapy, could alleviate the IBD symptoms. Most of the in vitro studies related to the anti-inflammatory effects of polyphenols have been performed using immune or non-intestinal cells( Reference Rahman, Biswas and Kirkham 6 , Reference García-Lafuente, Guillamón and Villares 7 ). In activated B cells, for example, polyphenols from coffee and cocoa exhibit anti-inflammatory activity by modulating the expression levels of various cytokines (IL-1, TNF-α, IL-6, IL-10)( Reference Rodríguez-Ramiro, Ramos and López-Oliva 8 ) and of NF-κ light-chain enhancer (NF-κB)( Reference Shimizu 9 ). Also, resveratrol and curcumin at 20 μm inhibit the release of TNF-α, IL-1β and IL-6 cytokines by peritoneal macrophages and stimulate the expression of IL-10( Reference Sharma, Chopra and Kulkarni 10 ). However, the effect of different polyphenols (flavones and flavanols) has been investigated for their inhibitory properties in intestinal cell lines including colon cells (Caco-2, HT29), breast cells and prostate cells( Reference Dai and Mumper 11 ). Pathways involved in the inflammatory response at intestinal level, particularly the mitogen-activated protein kinase (MAPK) pathway( Reference Dai and Mumper 11 ) and aryl hydrocarbon receptor (AhR), are modulated by polyphenols( Reference Stejskalova, Dvorak and Pavek 12 ). In vivo studies also demonstrated the beneficial effects of polyphenols in the management of colonic inflammation. For instance, apple polyphenols or bilberry anthocyanins administered to mice with dextran sulfate sodium-induced colitis reduced the expression of IL-1β, TNF-α, IL-6, IL-17, IL-22 and interferon-γ (IFN-γ) in colon samples( Reference Skyberg, Robison and Golden 13 , Reference Piberger, Oehme and Hofmann 14 ).
Wine-making by-products are an important alternative source of polyphenols (e.g. grape pomace (GP)) and other bioactive substances which are associated with health benefits in animal and humans( Reference Dos Santos, de Oliveira and Lopes 15 ). It was demonstrated that GP exhibits very high total phenolic content (including flavonoids and non-flavonoids, primarily anthocyanins, catechins, glycosylated flavonols, phenolic acids and stilbenes), due to the accumulation of these compounds in the fruit skin and seeds( Reference Dos Santos, de Oliveira and Lopes 15 ). A recent study demonstrated that phenolic extract from grape by-products protects Caco-2 cells against pro-oxidant-induced toxicity( Reference Wang, Mateos and Goya 16 ). Other studies demonstrated the potential of red wine pomace by-products as chemopreventive agents in colorectal cancer using HT-29 cells( Reference Del Pino-García, Rivero-Pérez and González-SanJosé 17 ). The red wine polyphenol extract and the pure molecules resveratrol and piceatannol showed similar anti-inflammatory effects in in vivo intestinal inflammation models (decrease of colitis severity and reduction of intestinal TNF-α secretion)( Reference Martín, Villegas and La Casa 18 , Reference Canali, Vignolini and Nobili 19 ). There are both in vitro and in vivo studies which demonstrated that active compounds from GP could modulate the microbiota composition, acting as prebiotics( Reference Freire, Adorno and Sakamoto 20 ). For instance, GP phenolic extract (1 mg/ml) induced in vitro a significant biomass increase of Lactobacillus acidophilus grown in liquid culture media( Reference Hervert-Hernández, Pintado and Rotger 21 ). A long-term treatment with GP could modulate selectively rat gut microbiome to a healthier phenotype( Reference Chacar, Itani and Hajal 22 ).
Probiotics has been another promising way investigated and exploited to reduce the severity of intestinal diseases. It was demonstrated that probiotic microorganisms confer therapeutic effects via mutual competitive interactions with the intestinal microflora. They also could modulate immunological parameters, intestinal permeability and bacterial translocation, by providing bioactive or regulatory metabolites( Reference de Vrese and Schrezenmeir 23 ). Studies with experimental animals and IBD patients pointed out the potential application of probiotics such as lactobacilli, bifidobacteria to prevent or treat colitis( Reference Dieleman, Goerres and Arends 24 – Reference Owczarek, Rodacki and Domagała-Rodacka 26 ). Data from in vitro studies showed that the treatment of intestinal epithelial cells with L. acidophilus resulted in induction of c-Fos and c-Jun proteins via extracellular signal-regulated kinase (Erk)1/2 activation( Reference Priyamvada, Anbazhagan and Kumar 27 ). In addition, probiotic bacteria could increase the anti-inflammatory response in epithelial cells by shuttling the transcription factor NF-κB out of the nucleus, which resulted in the attenuation of NF-κB-mediated inflammatory gene expression( Reference Priyamvada, Anbazhagan and Kumar 27 , Reference Ng, Hart and Kamm 28 ). A mixture of Lactobacillus sp. (L. plantarum, L. paracasei, L. acidophilus) was able to counteract the in vitro Escherichia coli and mycotoxin zearalenone pro-inflammatory-induced response by down-regulation of the inflammatory-related genes( Reference Taranu, Marin and Pistol 29 ).
Until now, few studies investigated the combined effect of pre- and probiotics in counteracting the intestinal inflammation, while many other reported their effect as individual treatments. However, the study of Palocz et al. Reference Palocz, Pászti-Gere and Galfi (30) reported the effect of a combined treatment between chlorogenic acid and Lactobacillus plantarum 2142 in reducing the lipopolysaccharide (LPS)-induced intestinal inflammation in porcine IPEC-J2 cells, while Dos Santos et al. Reference Dos Santos, de Oliveira and Lopes (15) described the protective effect of GP extract on the viability of L. acidophilus and L. rhamnosus.
Using genomic and proteomic array approaches and a well-established intestine-like in vitro model, the human adenocarcinoma colon cell line Caco-2 treated with LPS for the induction of intestinal inflammation, we evaluated in this study the effects of a combination of GP extract rich in polyphenols and a probiotic mixture of Lactobacillus sp. on several relevant inflammatory and in-depth cellular signalling-related molecules. The advantage of the genomic and proteomic array technology allows the investigation of a higher number of mediators (genes and proteins) compared with other simpler techniques. The profile expression of forty-four key genes and forty of their proteins involved in intestinal inflammatory response (eleven chemokines, twenty-three cytokines, ten adhesion molecules and another related inflammatory molecules) as well as twenty-one signalling (p38/c-Jun N-terminal kinase (JNK)/ERK MAPK, Akt, GSK) markers were concomitantly analysed. Other genes and proteins involved in inflammation were also investigated (NF-κB/RELA, Nrf2 nuclear receptor and AhR, Cyp1A1, Cyp1B1).
Methods
Preparation of grape pomace extract
GP was obtained from a local winery producer from Valea Calugareasca, as a dried material. The extraction of polyphenols from GP was performed using acetone 80 % solution (1 g GP/7 ml acetone solution). The obtained mixture was shaken for 24 h and centrifuged at 4000 rpm; the resultant extract was concentrated on an RVC 2-18 CDplus mini concentrator (Martin Christ Gefriertrocknungsanlagen GmbH). The total polyphenol concentration was determined using the Folin–Ciocalteu method and is expressed in mg/l of gallic acid equivalents (GAE). The phenolic extract was aliquoted and stored at –20°C until further analyses.
Determination of polyphenol concentration of grape pomace extract
HPLC-diode array detection (DAD)–MS method was used for measurement of polyphenol concentration in GP acetone extract. The composition in polyphenols was determined according to the methods of Dulf et al. Reference Dulf, Vodnar and Dulf (31) and Garcia et al. Reference Garcia, Coelho and Costa (32) with slight modifications. The retention times, the mass spectra of the individual compounds using standard compounds and the UV–vis spectra (from 200 to 600 nm) were used in these determinations. The catechins and anthocyanins were detected at 280 and 520 nm. Agilent ChemStation Software (Rev B.04.02 SP1) was used for data analysis. The composition in catechins and their derivatives was calculated as catechin equivalents (mg catechin/100 g dry weight substrate) (r 2 0·9985). The concentration of anthocyanins was determined using cyanidin chloride (Sigma) as external standard and were expressed as cyanidin equivalents (mg cyanidin/100 g dry weight substrate) (r 2 0·9951). The calculation of cyanidin equivalents was done using a calibration curve, as presented in the work of Dulf et al. ( Reference Dulf, Vodnar and Dulf 31 )
Bacterial strains and culture conditions
The Lactobacillus strains (Lb) L. rhamnosus (ID IBNA02), L. paracasei (ID 13239) and L. acidophilus (ID 11692) used in this study were kindly offered by Dr Olguta Dracea (Cornelli), from Cantacuzino NIRDMI (Bucharest, Romania). They were cultured in deMan, Rogosa and Sharpe medium (MRS broth; Sigma) at 37°C for 16 h. Lactobacillus cells were harvested by centrifugation (4000 rpm, at 4°C, 10 min) and the cell density was evaluated by measuring the absorbance at 600 nm. Then the harvested cells were washed with PBS and finally suspended in Caco-2 culture medium (minimum essential medium (MEM) without antibiotic) adjusted at a concentration of 1 × 10⁸ colony-forming units (CFU)/ml for each strain and added to the Caco-2 cells in a final concentration of 3 × 10⁸ CFU/ml total Lb.
Cell culture and treatments
Caco-2 intestinal cells (American Type Culture Collection) were cultured in MEM supplemented with 10 % fetal bovine serum, 1 % antibiotic (penicillin 100 IU/ml and streptomycin 50 μg/ml) and l-Glu and incubated at 37°C in a 5 % CO2 humidified atmosphere. The cells were cultured in twenty-four-multiwell plates (Costar), 2 × 10⁵ cells/well for 14 d, until their differentiation. The integrity of the monolayer was assessed daily by microscopic visualisation (V-T-2 microscope; Meiji Techno). For the induction of inflammatory condition, Caco-2 cells were treated with LPS 5 μg/ml for 4 h. After LPS treatment, cells were washed with antibiotic-free media and cultured in the presence of Lactobacillus sp. mixture (3 × 10⁸ CFU/ml total Lb) and GP extract (50 μg/ml GAE) for 24 h. Medium without antibiotics was used in the wells containing Lactobacillus sp. mixture. At the end of cell culture experiments, the supernatants were collected and stored at –80°C until next analyses. The cells cultured in duplicate were rinsed with sterile PBS, lysed and used for quantitative PCR (qPCR) analysis and for phospho-protein array and immunoblotting.
Cell viability assay
3-(4,5-Dimethylthiazol-2yl)-2,5-diphenyltetrazolium bromide (MTT) assay was used to assess cell viability in response to GP extract. Briefly, Caco-2 cells were seeded in ninety-six-well flat bottomed plates at a density of 5 × 10⁴ cells/100 μl and treated with different concentrations (0–100 μg/ml) of GP extract. After 24 h, the culture media was replaced and 10 μl of MTT reagent and culture medium was added to each well for another 4 h at 37°C. The absorbance was determined at a test wavelength of 450 nm using an ELISA micro-plate reader (TECAN Sunrise). All experiments were performed in three independent replicates.
Extraction of total RNA and complementary DNA synthesis
The Caco-2 cells were lysed with lysis buffer. Total RNA was extracted using Qiagen RNeasy mini kit (QIAGEN GmbH), according to the manufacturer’s recommendations. The total RNA isolated from each sample was further used to generate complementary DNA (cDNA) using M-MuLV reverse trascriptase kit (Thermo Fischer Scientific) according to the manufacturer’s protocol.
Complementary DNA quality
The successful reverse transcription of mRNA to cDNA as well as the absence of contamination with genomic DNA of samples was evaluated using GeneQuerry™ Human cDNA Evaluation kit (ScienCell), according to the manufacturer’s protocol. This reaction was performed for each sample, using 25 ng cDNA; the quantification of the whole cDNA added to the reaction was assessed by the analysis of the amplification curves of two reference genes, LDHA and PPIH, provided by the evaluation kit.
Quantitative PCR array
Two customised ninety-six-well plate arrays, GeneQuerry™ qPCR Array (Sciencell), were used to analyse the gene expression profiling of forty key genes involved in intestinal inflammatory response (online Supplementary File S1) and of seventeen signalling kinase mRNA (online Supplementary File S2). A mixture of 25 ng cDNA template, 10 μl SYBR Green qPCR Master Mix (Life Technologies) and nuclease-free water (to a final volume of 20 μl) was added to each well containing lyophilised primers, according to the manufacturer’s protocol. The cycling protocol used was described in Pistol et al. ( Reference Pistol, Braicu and Motiu 33 ). Two reference genes (LDHA and NONO) were selected from the panel of five genes, using Excel-based NormFinder software, and used for data normalisation. This selection was performed based on their constant expression in all samples and for improved normalisation of the results, according to Vandesompele et al. ( Reference Vandesompele, Kubista and Pfaffl 34 ). Results were expressed as relative fold change (Fc) compared with the untreated cells.
Quantitative PCR analysis of other signalling markers
To evaluate the gene expression of other markers involved in inflammation, nuclear receptors (NF-κB1, RELA, Nrf2) and the AhR pathway (AhR, Cyp1A1, Cyp1B1), the qPCR was performed in Rotor-Gene-Q (QIAGEN GmbH) machine using 25 ng cDNA, 12·5 μl SYBR Green qPCR Master Mix (Applied Biosystems) and 0·3 μm each of gene-specific primer. The nucleotide sequences of the primers used in these experiments are presented in online Supplementary File S3. The PCR cycling conditions were described in Pistol et al. ( Reference Pistol, Braicu and Motiu 33 ). Two reference genes, β-2 microglobulin and β-defensin (selected from a panel of four references genes, using NormFinder software), were used for data normalisation. This selection was performed based on their constant expression in all samples and for improved normalisation of the results, according to Vandesompele et al. ( Reference Vandesompele, Kubista and Pfaffl 34 ). The results were expressed as relative Fc compared with untreated cells.
Protein array analysis (inflammatory markers)
Release of inflammatory markers in the cell culture supernatants was detected using the Inflammation Human Membrane Antibody Array (Abcam), following the manufacturer’s instructions. Protein expressions were detected by enhanced chemiluminescence and signals were captured on a couple-charged device (CCD) camera (MicroChemi, DNR Bio-Imaging Systems). The forty markers tested in duplicate on the used array membranes are listed in online Supplementary File S4. ImageJ software (https://imagej.nih.gov/ij/) was used to quantify the signal from each spot in the array. After normalisation to positive control signal intensities, the relative expression levels were compared, analyte-by-analyte, between experimental groups.
Protein array analysis (signalling markers)
Human Phospho-MAPK Array kit (R&D Systems) was used to detect the relative levels of phosphorylation of MAPK, ERK1/2, JNK and p38 isoforms, according to the manufacturer’s protocol. An enhanced chemiluminescent chemi reagent and an ECL camera (MicroChemi, DNR Bio-Imaging Systems) were used to detect the signals that were quantified with the NIH ImageJ software (https://imagej.nih.gov/ij/). The twenty-six markers tested in duplicate on the used array membranes are listed in online Supplementary File S5.
Immunoblot analysis of RELA protein expression
The level of RELA protein expression was analysed using immunoblotting technique as described by Taranu et al. ( Reference Taranu, Gras and Pistol 35 ). The results were expressed as a ratio between the expression level of RELA and β-actin.
Statistical analysis
Result data are expressed as means with their standard errors of the mean. Differences among groups were tested using one-way ANOVA and the general linear model (GLM) procedure of the Minitab software (Minitab 17.0)( 36 ) followed by the Tukey test. Distribution of samples was a priori checked using the Kolmogorov–Smirnov test, which showed a normal distribution of these samples. Each cell series was considered an experimental unit. In addition, effect sizes were calculated for analysed genes as well as for equivalent proteins to validate the obtained significant results. The calculated (reported) effect sizes were: Cohen’s d S, Hedges’s g S, η 2 and ω 2. Statistical significance was declared at P <0·05; when P between 0·051 and 0·10 differences were considered as tendencies.
Results
Total polyphenol content and cytotoxicity of grape pomace extract
A total polyphenol content of 6710·9 mg GAE/l were found in GP extract used in the present study. HPLC-DAD–MS analysis showed that GP extract was rich in flavonoids (catehins, epicatechins and procyanidins), the highest concentration being observed for epicatechin (flavan-3-ol, 51·96 mg/100 g) and procyanidin dimer (22·79 mg/100 g). The concentration of polyphenols from GP extract is presented in the online Supplementary File S6.
Regarding the GP cytotoxicity, our results presented in Fig. 1 indicated that the highest concentrations of GP (75 and 100 μg/ml) determined a slightly increased number of viable cells after 24 h, but no significant differences were found when compared with controls (P >0·05). For further experiments, a non-cytotoxic concentration of 50 μg/ml GP extract was used, this concentration being the most appropriate to the level of control samples (4% over the untreated cells; Fig. 1).
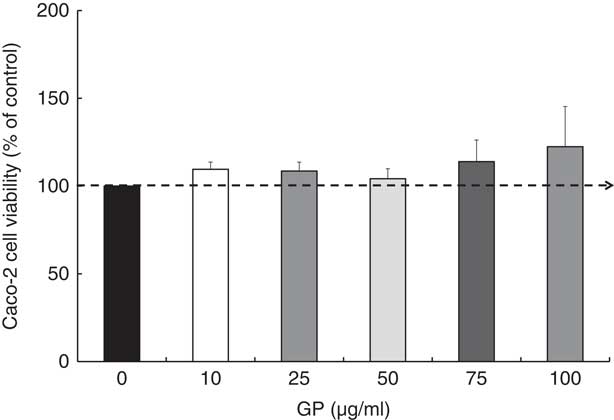
Fig. 1 Effect of grape pomace (GP) extract on cell viability in Caco-2 cells. Cell viability was determined using the 3-(4,5-dimethylthiazol-2yl)-2,5-diphenyltetrazolium bromide (MTT) assay at 24 h after incubation with GP extract. The results are representative of three independent experiments and are presented as percentage of control cells (0 μg/ml). Values are means, with standard errors represented by vertical bars.
Global view on the combined effect of grape pomace extract and lactobacilli mixture on functional cluster of biomarkers related to inflammation in lipopolysaccharide-treated Caco-2 cells (%)
Based on the analysis of PCR array results, six functional clusters of markers linked to inflammation were identified in Caco-2 cells: chemokines, cytokines, adhesion molecules, receptors of cytokine soluble forms, growth factors and matrix metalloproteinases inhibitors. The classification system described by Delves et al. ( Reference Delves, Martin and Burton 37 ) for chemokine and cytokine functional classes was used. As expected, results presented in Fig. 2(a) showed that the main effect of LPS treatment was the strong up-regulation of 86·3 % of the total analysed genes (22·7 % of chemokines, 42·5 % cytokines and 7·5 % other inflammatory genes). It down-regulated only 6·8 % of genes and had no effect on 6·9 % of genes in comparison with untreated cells. Reported to LPS, the simultaneous action of GP and Lb mix was decreasing the expression of 61·4 % of genes and only 15·9 % remained up-regulated compared with LPS (Fig. 2(a)). Protein array was used to complete the genomic results. At protein-level LPS, LPS + GP + Lb treatment produced similar effects with that observed for gene expressions (Fig. 2(b)).
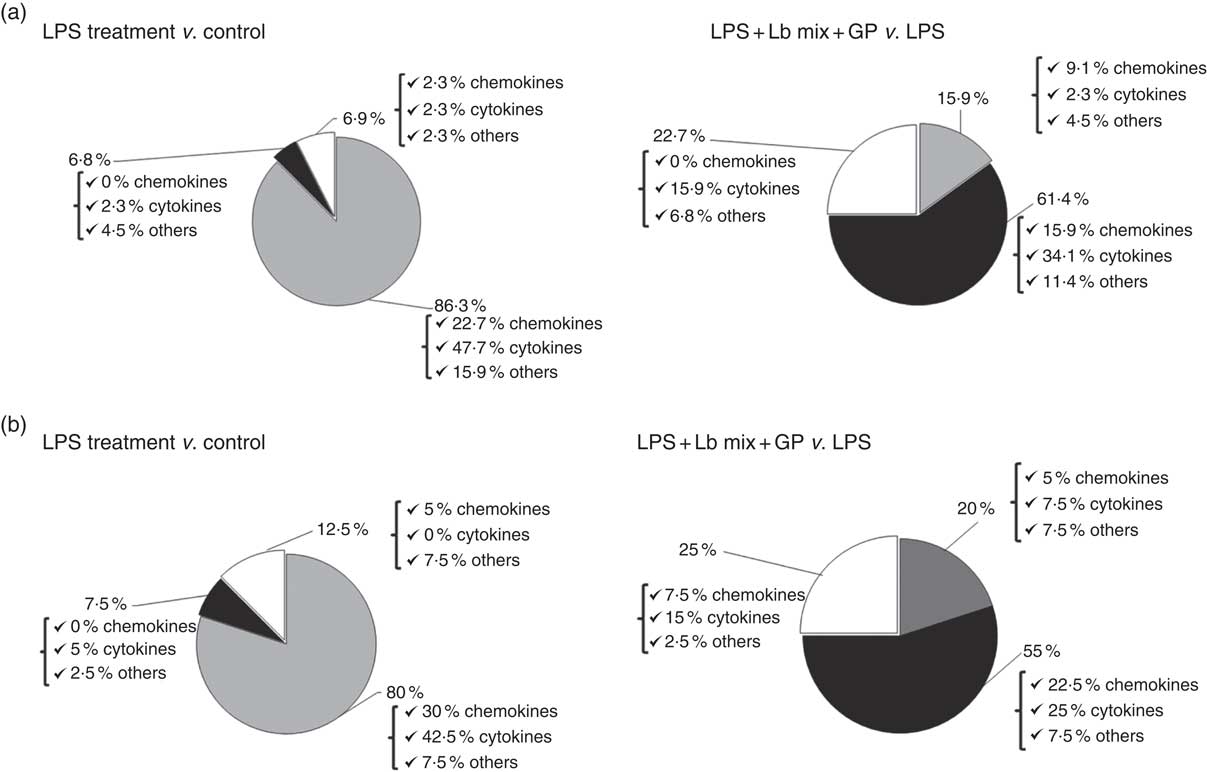
Fig. 2 Overview of combined effects of grape pomace (GP) and lactobacilli mixture (Lb mix) on the mRNA (a) and protein (b) expression of pro-inflammatory-related markers in human intestinal Caco-2 cells. Human intestinal Caco-2 cells were treated as follows: lipopolysaccharide (LPS) + GP + Lb mix = cells treated with LPS (5 μg/ml) for 4 h and GP (50 μg/ml) + Lb mix (1 x 10⁸ each Lb) for 24 h. The expression of inflammatory markers was achieved by quantitative PCR and protein arrays. After data analysis, the obtained results were expressed as percentage of control untreated cells (for LPS-treated cells) and of LPS-stimulated cells (for LPS + GP + Lb mix treatment). ![]() , Up-regulated (%);
, Up-regulated (%); ![]() , down-regulated (%);
, down-regulated (%); ![]() , no effect (%).
, no effect (%).
Global view on the combined effect of grape pomace extract and lactobacilli mixture on functional cluster of signalling markers in lipopolysaccharide-treated Caco-2 cells (%)
An up-regulation of 81 % of signalling kinase genes was induced by LPS in Caco-2 cells by comparison with controls (28·7 % MAPK, 19 % Akt/p70S6K/mTOR kinases and 33·3 % other kinases) as shown in Fig. 3(a). The addition of GP + Lb synbiotic treatment to the LPS-treated cells led to the down-regulation of 52·4 % genes coding for these kinases (14·3 % MAPK, 14·3 % Akt/p70S6K/mTOR kinases and 23·8 % other kinases; Fig. 3(a)). The genomic results were confirmed by protein analysis, LPS treatment inducing the up-regulation of 96·2 % of kinases (Fig. 3(b)). Compared with LPS-stimulated cells, the combination of GP + Lb added to LPS-stimulated cells decreased the signalling kinases protein expression by 61·5 % (Fig. 3(b))
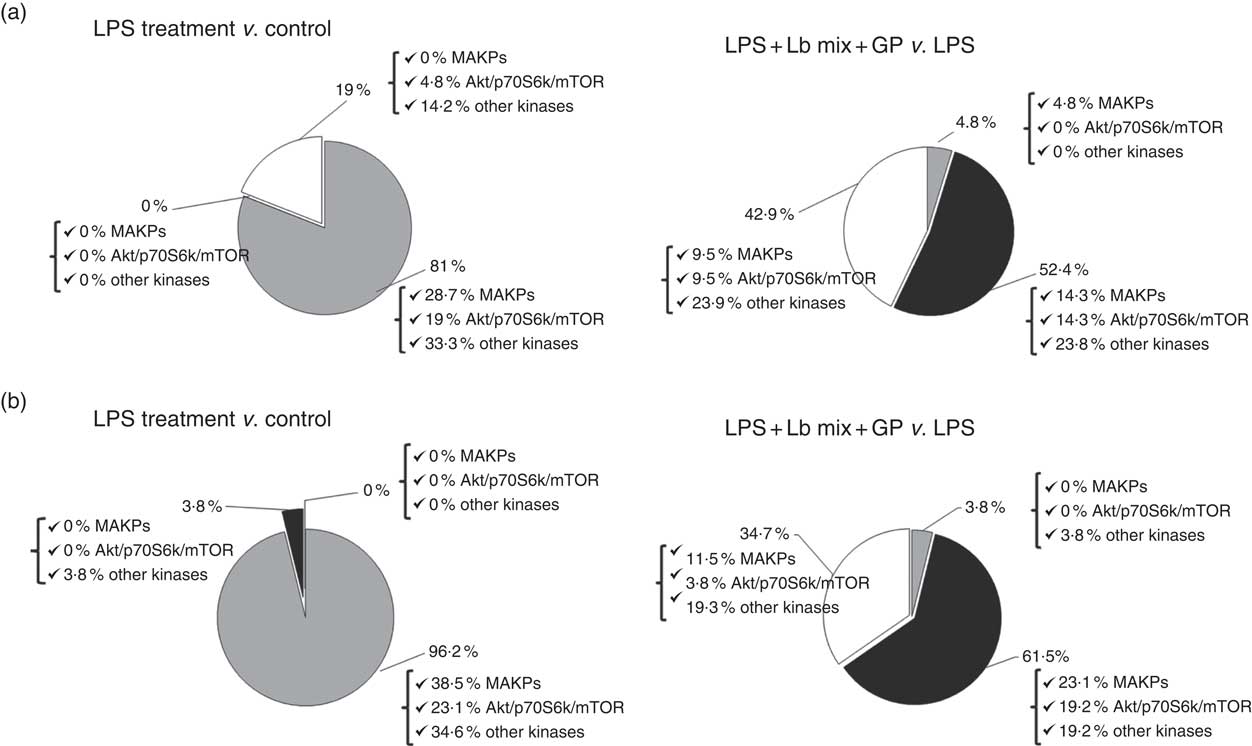
Fig. 3 Overview of individual and combined effects of grape pomace (GP) and lactobacilli mixture (Lb mix) on the mRNA (a) and protein (b) expression of signalling markers in human intestinal Caco-2 cells. Human intestinal Caco-2 cells were treated as follows: lipopolysaccharide (LPS) + GP + Lb mix = cells treated with LPS (5 μg/ml) for 4 h and GP (50 μg/ml) + Lb mixture (1 x 10⁸ each Lb) for 24 h. The expression of signalling markers was achieved by quantitative PCR and by protein array. After data analysis, the obtained results were expressed as percentage of control untreated cells (for LPS-treated cells) and of LPS-stimulated cells (for LPS + GP + Lb mix treatment). ![]() , Up-regulated (%);
, Up-regulated (%); ![]() , down-regulated (%);
, down-regulated (%); ![]() , no effect (%).
, no effect (%).
Combined effect of grape pomace extract and lactobacilli mixture on inflammatory biomarkers (gene and protein array analysis)
The treatment effects of LPS and GP and Lb mix on the different molecules belonging to functional clusters of inflammatory markers are presented below.
Chemokine gene expression
As shown in Table 1, LPS alone lead to an up-regulation of all chemokines’ mRNA expression compared with the control cells (with the exception of MIP-1δ gene), the most up-regulated gene being MCP-1 (29·9 times increase, P = 0·032), followed by EOTAXIN (22·3 time increase, P = 0·044) and MIG (18·2 time increase, P = 0·020). The simultaneous exposure of LPS-treated cells to the combination of pre- (GP extract) and pro-biotic (Lb mix) decreased the expression of 7/11 (63·6 %) chemokine gene expression to a level less than that induced by LPS treatment and even below this level in the case of MIG gene expression. There are also chemokines like IP-10, MIP-1β, MIP-1δ and RANTES which remained overexpressed when compared with LPS alone (Table 1).
Table 1 List of genes encoding for chemokines differentially expressed upon combined treatment with grape pomace (GP) and lactobacilli mixture (Lb mix) * (Mean values with their standard errors of three independent experiments)

LPS, lipopolysaccharide; Fc, fold change.
a,b,c Mean values within a row with unlike superscript letters were significantly different (P <0·05).
* One-way ANOVA test followed by the Tukey method was performed to analyse the effect of the different treatments on mRNA level.
† C = untreated control cells; LPS = cells treated with (5 μg/ml LPS) for 4 h; LPS + Lb mix + GP = cells treated with LPS (5 μg/ml) for 4 h and GP (50 μg/ml) + Lb mix (1 × 10⁸ each Lb) for 24 h; Fc = Fc in gene expression.
Chemokine protein expression
Chemokines’ protein array analysis confirmed the results obtained for their genes. The synbiotic combination (GP extract + Lb mix) proved efficacy in decreasing the expression of 54·5 % (6/11) of chemokine proteins under the LPS level (Table 2). Similarly with their gene expression, IP-10 and MIP-1β chemokine proteins were unmodulated by experimental treatment (Table 2).
Table 2 List of chemokine proteins differentially expressed upon combined treatment with grape pomace (GP) and lactobacilli mixture (Lb mix) * (Mean values with their standard errors of three independent experiments)
LPS, lipopolysaccharide; MD, mean density.
a,b,c Mean values within a row with unlike superscript letters were significantly different (P <0·05).
* One-way ANOVA test followed by the Tukey method was performed to analyse the effect of the different treatments on protein level.
† C = untreated control cells; LPS = cells treated with (5 μg/ml LPS) for 4 h; LPS + Lb mix + GP = cells treated with LPS (5 μg/ml) for 4 h and GP (50 μg/ml) + Lb mix (1 × 10⁸ each Lb) for 24 h; MD = MD of protein spots.
Cytokine gene expression
As in the case of chemokines, the challenge of Caco-2 cells with LPS induced an up-regulation of majority of the twenty-three cytokines analysed (21/23) (Table 3). As expected, the Th2-IL-4 and the anti-inflammatory IL-10 were the only cytokines whose gene expression remained unmodified (IL-4) or down-regulated (IL-10) under the LPS action. The addition in culture media of GP and Lb mix together decreased the gene expression level of several (15/23, 65·2 %) relevant inflammatory cytokines involved in response to microbial infection, such as TNF-α (1·2 (sem 0·3) Fc), IFN-γ (1·5 (sem 0·2) Fc), IL-12p40 (1·1 (sem 0·0) Fc) and IL-7 (1·0 (sem 0·3) Fc) (Table 3) to a level below the level induced by LPS treatment and toward the untreated control level. This treatment increased the expression of IL-4 gene (3·7 (sem 0·5) Fc) (Table 3).
Table 3 List of genes encoding for cytokines differentially expressed upon combined treatment with grape pomace (GP) and lactobacilli mixture (Lb mix) * (Mean values with their standard errors of three independent experiments)
LPS, lipopolysaccharide; Fc, fold change.
a,b,c Mean values within a row with unlike superscript letters were significantly different (P <0·05).
* One-way ANOVA test followed by the Tukey method was performed to analyse the effect of the different treatments on mRNA level.
† C = untreated control cells; LPS = cells treated with (5 μg/ml LPS) for 4 h; LPS + Lb mix + GP = cells treated with LPS (5 μg/ml) for 4 h and GP (50 μg/ml) + Lb mix (1 × 10⁸ each Lb) for 24 h; Fc = Fc in gene expression.
Cytokine protein expression
IL-4 and the IL-10 protein expressions were down-regulated by the LPS treatment (Table 4). The effect of LPS + GP + Lb mix treatment on cytokines protein expression registered a significant decrease (59·1 %, 13/22) against LPS similar to that found for their gene. A significantly low level of protein expression was noticed for IL-12s with an important decrease against both LPS (IL-12 p40: –73%, P <0·001 v. LPS; IL-12-p70: –98%, P = 0·003 v. LPS; Table 4) and untreated control.
Table 4 List of cytokine proteins differentially expressed upon combined treatment with grape pomace (GP) and lactobacilli mixture (Lb mix) * (Mean values with their standard errors of three independent experiments)

LPS, lipopolysaccharide; MD, mean density.
a,b,c Mean values within a row with unlike superscript letters were significantly different (P <0·05).
* One-way ANOVA test followed by the Tukey method was performed to analyse the effect of the different treatments on protein level.
† C = untreated control cells; LPS = cells treated with (5 μg/ml LPS) for 4 h; LPS + Lb mix + GP = cells treated with LPS (5 μg/ml) for 4 h and GP (50 μg/ml) + Lb mix (1 × 10⁸ each Lb) for 24 h; MD = MD of protein spots.
Adhesion molecule and other pro-inflammatory gene expression (soluble forms of cytokine receptors, growth factors and matrix metalloproteinases and their inhibitors)
The incubation of intestinal cells with LPS increased significantly the gene expression of 5/7 adhesion and other pro-inflammatory molecules (Table 5). The combination of GP and Lb mix showed counteracting effect to LPS-induced inflammation by decreasing in the control the expression of five of the ten genes (5/10) of this category (sTNF RII, TGF-β1, PDGF-BB, MMP-2 and MMP-9) and by increasing the expression of TIMP-1 and TIMP-2 (Table 5). The highest efficacy of pre- and probiotic treatment was found for MMP-2 and PDGF-BB genes whose expression decreased from 6·9 (sem 0·4) Fc (LPS) to 0·4 (sem 0·1) Fc (P = 0·002) and from 4·8 (sem 1·3) Fc (LPS) to 1·3 (sem 0·2) Fc (P = 0·050) as well as for TIMP-1 and TIMP-2 whose expression increased from 0·3 (sem 0·0) Fc (LPS) to 2·0 (sem 0·1) Fc and 1·1 (sem 0·1) Fc, respectively (P = 0·007 and P = 0·017; Table 5).
Table 5 List of genes encoding for adhesion and other inflammatory molecules differentially expressed upon combined treatment with grape pomace (GP) and lactobacilli mixture (Lb mix) * (Mean values with their standard errors of three independent experiments)

LPS, lipopolysaccharide; Fc, fold change.
a,b,c Mean values within a row with unlike superscript letters were significantly different (P <0·05).
* One-way ANOVA test followed by the Tukey method was performed to analyse the effect of the different treatments on mRNA level.
† C = untreated control cells; LPS = cells treated with (5 μg/ml LPS) for 4 h; LPS + Lb mix + GP = cells treated with LPS (5 μg/ml) for 4 h and GP (50 μg/ml) + Lb mix (1 × 10⁸ each Lb) for 24 h; Fc = Fc in gene expression.
Adhesion molecule and other pro-inflammatory protein expression (soluble forms of cytokine receptors, growth factors and matrix metalloproteinases inhibitors)
In the case of protein secretion, the strong effect of the synbiotic treatment was observed for sTNF RII, which decreased by –58% (P = 0·001) against LPS and by –10% (P = 0·549) compared with the untreated cells. In addition, TIMP-2 protein lowered by LPS below the level of the untreated cells (–48%, P = 0·041) and was restored to the control level by the synbiotic treatment (Table 6).
Table 6 List of adhesion and other inflammatory molecules proteins differentially expressed upon combined treatment with grape pomace (GP) and lactobacilli mixture (Lb mix)* (Mean values with their standard errors of three independent experiments)
LPS, lipopolysaccharide; MD, mean density.
a,b,c Mean values within a row with unlike superscript letters were significantly different (P <0·05).
* One-way ANOVA test followed by the Tukey method was performed to analyse the effect of the different treatments on protein level.
† C = untreated control cells; LPS = cells treated with (5 μg/ml LPS) for 4 h; LPS + Lb mix + GP = cells treated with LPS (5 μg/ml) for 4 h and GP (50 μg/ml) + Lb mix (1 × 10⁸ each Lb) for 24 h; MD = MD of protein spots.
In-depth intracellular signalling response to the combined effect of grape pomace extract and lactobacilli mixture (quantitative PCR and protein array analysis)
Signalling gene expression
The qPCR array analysis showed that LPS induced in Caco-2 cells an up-regulation of MAPK gene expression, the most affected genes being p38δ MAPK: 3·5 (sem 0·5) Fc, P = 0·048 and ERK2: 3·7 (sem 0·7) Fc, P = 0·038 (Table 7). In addition, LPS treatment led to an increase in gene expression of 80 % of Akt/p706S/mTOR kinases and 70 % of other kinases. The GP + Lb combination decreased the gene expression of JNK1 and ERK1/2 under the LPS level and toward untreated cells. By contrast, GP + Lb combination maintained the gene expression of p38α MAPK to that produced by LPS alone (Table 7). In addition, simultaneous treatment with GP extract and Lb mix decreased the mRNA level of 60 % of Akt/p70S6K/mTOR and 50 % of other kinases under the level from LPS-treated cells (Table 7).
Table 7 List of signalling genes differentially expressed upon combined treatment with grape pomace (GP) and lactobacilli mixture (Lb mix) * (Mean values with their standard errors of three independent experiments)

LPS, lipopolysaccharide; Fc, fold change.
a,b,c Mean values within a row with unlike superscript letters were significantly different (P <0·05).
* One-way ANOVA test followed by the Tukey method was performed to analyse the effect of the different treatments on mRNA level.
† C = untreated control cells; LPS = cells treated with (5 μg/ml LPS) for 4 h; LPS + Lb mix + GP = cells treated with LPS (5 μg/ml) for 4 h and GP (50 μg/ml) + Lb mix (1 × 10⁸ each Lb) for 24 h; Fc = Fc in gene expression.
qPCR analysis demonstrated that LPS treatment induced an overexpression of nuclear receptor genes (NF-κB1, RELA, Nrf2) and genes involved in AhR signalling (AhR, Cyp1A1) (Fig. 4). The GP + Lb combination decreased gene expression of all nuclear receptor genes and AhR signalling mRNA under the LPS level, restoring the gene expression for RELA and AhR to the control level (Fig. 4).
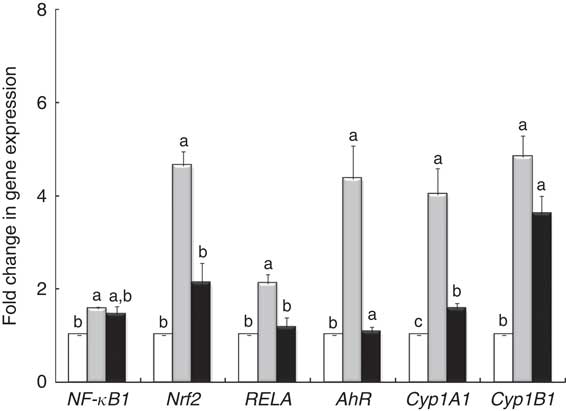
Fig. 4 Effects of lipopolysaccharide (LPS) + grape pomace (GP) + lactobacilli mixture (Lb mix) on nuclear receptor gene expression. Caco-2 cells cultured in the presence of LPS (5 μg/ml) for 4 h and GP (50 μg/ml) + Lb mixture (1 x 10⁸ each Lb) for 24 h were analysed for NF-kB, RELA, Nrf2, AhR, Cyp1A1 and Cyp1B1 mRNA expression by quantitative RT-PCR. Results are expressed as change after normalisation of the expression of the target gene to the mean of the expression of two internal reference genes. Values are means, with standard errors represented by vertical bars, from three experimental series. Statistical analysis was performed using one-way ANOVA followed by the Tukey method. a,b,cMean values with unlike letters were significantly different (P <0·05). ![]() , Control;
, Control; ![]() , LPS;
, LPS; ![]() , LPS + Lb mix + GP.
, LPS + Lb mix + GP.
Signalling phospho-proteins
The analysed proteins were clustered into two main functional groups, MAPK (p38/ERK/JNK) and Akt/P70S6K/mTOR, based on their involvement in cellular signalling pathways, and those that do not belong to these two classes are included in a separate group, ‘other phospho-kinases’ (Table 8). The results of protein array analysis spots showed that the expression of the phospho-protein increased by 96 % using LPS treatment.
Table 8 List of signalling proteins differentially expressed upon combined treatment with grape pomace (GP) and lactobacilli mixture (Lb mix) * (Mean values with their standard errors of three independent experiments)
LPS, lipopolysaccharide; MD, mean density.
a,b,c Mean values within a row with unlike superscript letters were significantly different (P <0·05).
* One-way ANOVA test followed by the Tukey method was performed to analyse the effect of the different treatments on protein level.
† C = untreated control cells; LPS = cells treated with (5 μg/ml LPS) for 4 h; LPS + Lb mix + GP = cells treated with LPS (5 μg/ml) for 4 h and GP (50 μg/ml) + Lb mix (1 × 10⁸ each Lb) for 24 h; MD = MD of protein spots.
Mitogen-activated protein kinases (p38s/c-Jun N-terminal kinases/extracellular signal-regulated kinases)
The protein array results presented in Table 8 showed a notable significant increase in MAPK phospho-protein levels induced by LPS treatment. The incubation of Caco-2 cells with both GP extract and Lb mix resulted in a significant down-regulation of p38δ MAPK (–45%, P <0·001) and ERK1 (–47%, P = 0·097) protein levels under the level of LPS-treated cells (Table 8).
Akt/p60S6K/mTOR and other phospho-kinases
The effect of GP extract and Lb mix together was efficient in decreasing the protein expression of all molecules belonging to Akt/p70S6kinase/mTOR or other kinases group, which were upregulated by LPS. A significant lower expression was observed for Akt3 and p70S6K, CREB, GSK-3β and p53, the important kinases involved in transcription, phosphorylation and proliferation as well as in tumour suppression.
The densitometry analysis of Western blot data confirmed that LPS treatment induced a strong up-regulation of RELA protein expression, both in cytoplasmic and in nuclear lysate. In these two types of lysates, treatment with GP extract and Lb mix decreased the protein expression of RELA under the LPS level, restoring it to that in the control (Fig. 5).
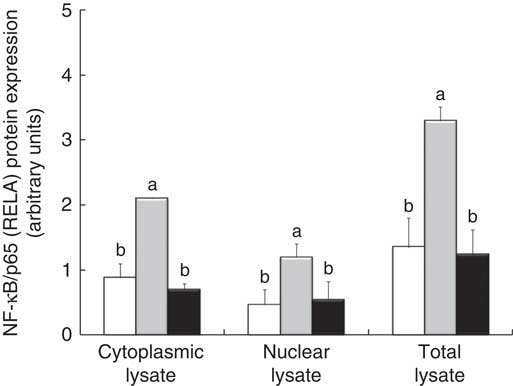
Fig. 5 NF-κB/p65 (RELA) expression in Caco-2 cellular lysate. The level of NF-κB/p65 phosphorylation in Caco-2 cells was determined by Western blot and expressed as the ratio between NF-κB/p65 and β-actin band intensities, respectively. Values are means, with standard errors represented by vertical bars, for each experimental group. Statistical analysis was performed using one-way ANOVA followed by the Tukey method. a,bMean values with unlike letters were significantly different (P <0·05). ![]() , Control;
, Control; ![]() , lipopolysaccharide (LPS);
, lipopolysaccharide (LPS); ![]() , LPS + lactobacilli mixture + grape pomace.
, LPS + lactobacilli mixture + grape pomace.
Discussion
One of the current requirements in IBD research is to establish whether the natural alternatives such as prebiotics and probiotics could be effective in the treatment of these diseases either individually or in combination( Reference Debnath, Kim and Lim 38 ). Using array technologies (genes and proteins), this study aimed to investigate the effect of a new combination of natural curative alternatives including prebiotics (GP extract rich in polyphenols, fibre etc.) and probiotics (L. rhamnosus, L. paracasei, L. acidophilus mixture) on the intrinsic mechanisms of inflammation and intracellular signalling routes in a cellular model of intestinal inflammation.
Literature data revealed two main experimental designs used to study the effects of prebiotics/probiotics in the in vitro models of intestinal inflammation. One of them focused on the capacity of pre- and probiotics to prevent intestinal inflammation and therefore the treatment of the cells included the addition and incubation with pre- and probiotics before the induction of inflammation( Reference Wang, Mateos and Goya 16 , Reference Del Pino-García, Rivero-Pérez and González-SanJosé 17 , Reference Priyamvada, Anbazhagan and Kumar 27 ). The second experimental design concentrated on their restorative effect, considering first the induction of inflammation in the intestinal cells followed by the addition of the prebiotics/probiotics within the system( Reference Palocz, Pászti-Gere and Galfi 30 , Reference Farkas, Mátis and Pászti-Gere 39 ). Our study used the second experimental design, as we considered that the initial induction of inflammation in Caco-2 intestinal cells by LPS fits best the recurrent and chronic pathologic conditions of IBD, where the cure is used mostly after the inflammation has already been installed. After the LPS challenge and induction of intestinal inflammation, the cells were treated with GP extract and Lb combination for 24 h. The analyses of qPCR and protein array data have shown a successful induction of inflammation by LPS treatment in Caco-2 cells, that is, more than 90 % of the analysed inflammatory mediators were up-regulated.
The inflammatory response at intestinal level is coordinated by a complex network of cytokines, chemokines, growth factors, adhesion molecules released from epithelial cells and surrounding( Reference Baumgart and Carding 40 ). In our study, the efficacy of GP extract and Lb mix together to mitigate the LPS-induced inflammation has been proven by a down-regulation of 63·4 % of chemokine genes (7/11) and 54·5 % of chemokine protein (6/11) expressions, especially for MIG, a very important biomarker of intestinal inflammation in IBD( Reference Wang, Dubois and Richmond 41 ). These data suggest that combined prebiotic and probiotic could be effective in the restoration of altered chemokine which occurred during intestinal inflammation. By contrast, IP-10 (CXCL10), an important pro-inflammatory mediator in IBD due to its role in activating and attracting the Th1-immune cells and phagocytic cells to the site of infection( Reference Hormannsperger, Clavel and Hoffmann 42 ), was highly up-regulated when GP and Lb mix acted together. Hormannsperger et al. Reference Hormannsperger, Clavel and Hoffmann (42) also reported an increase in IP-10 gene by L. plantarum 299 in TNF-treated intestinal epithelial cells (IEC). Ruiz & HallerReference Ruiz and Haller (43) showed that prebiotics like flavones (1–200 mmol/l) were not able to inhibit the TNF-induced IP-10 secretion in murine-derived IEC cells.
Cytokines are another key network that plays an important role in the initiation and perpetuation of inflammatory reaction in IBD by recruiting and activating the immune cells (IL-12, IL-18 and IL-23)( Reference Baumgart and Carding 40 ) and by amplifying and propagating the inflammatory processes (TNF-α, IL-1β and IL-6)( Reference Sanchez-Munoz, Dominguez-Lopez and Yamamoto-Furusho 2 ). Epithelial cells are involved in innate immune response capable of producing several cytokines, for example, IL-10, IL-6, TNF-α, MCP-1, IL-12p40 or chemokines, IL-8, CCL20 involved in inflammation( Reference Taranu, Marin and Pistol 29 ). In the present study, the advantage of the array technology is that it allowed us to see the modulation of a high number of inflammatory mediators and also to notice that GP and Lb mix was efficient in decreasing the cytokine gene (15/23) and protein (13/22) expression under the level induced by LPS in intestinal epithelial cells. This is the case of IFN-γ, IL-1α, IL-7, IL-11, IL-12p40, IL-12p70 and TNF-α cytokines. Studies describing the combined effect of other pre- and probiotics showed a similar effect on inflammatory response, but on a less number of cytokines. For example, Saccharomyces cerevisiae (var. Boulardii) and β-galactomannan oligosaccharide were able to decrease the gene expression of pro-inflammatory cytokines TNF-α, IL-6, GM-CSF and of chemokines CCL2, CCL20 and CXCL8 in ETEC-pre-treated intestinal IPI-2I porcine cells( Reference Badia, Zanello and Chevaleyre 44 ). Also, Bifidobacterium longum and its growth substrate inulin-oligofructose prebiotic (Synergy 1) were able to reduce the TNF-α and IL-1α mRNA levels in patients with active colitis( Reference Furrie, Mmacfarlane and Kennedy 45 ). Our results also demonstrated that by their combined action GP + Lb mix synbiotic treatment could attenuate the LPS-induced cytokine up-regulation in Caco-2 cells, 65·2 % of cytokine genes and 59·1 % of cytokine proteins were down-regulated under the level of LPS. Of these, 40 % reached the untreated control level or were below (20 %). Literature data also showed the efficiency of pre- or probiotic in mitigating the inflammatory cytokines when they act individually. For instance, there are reports showing the inhibition of TNF-α expression under treatment with specific probiotic strains, for example, Lactobacillus reuteri and Lactobacillus paracasei ( Reference Peña, Rogers and Ge 46 ), Lactobacillus reuteri ( Reference Lin, Thibodeaux and Peña 47 ) and Enterococcus faecium ( Reference Kern, Gunzel and Aschenbach 48 ), whereas other authors demonstrated the immuno-stimulatory properties of probiotics correlated with an increase in TNF-α expression( Reference Cross, Ganner and Teilab 49 , Reference Mohamadzadeh, Olson and Kalina 50 ). A reducing effect was observed with prebiotic natural compounds, such as cucurmin (5, 10 μm), apigenin (40 μm) and various catechins, which were able to reduce the LPS-induced production of IL-1β, TNF-α, IL-6 and IL-12 in human periodontal cells( Reference Mueller, Hobiger and Jungbauer 51 , Reference Jeong, Lee and Jeong 52 ) and murine macrophages, respectively( Reference Ichikawa, Matsui and Imai 53 ).
It is worth highlighting that the concomitant exposure of intestinal cells to the GP and Lb mixture decreased the expression of several important inflammatory mediators (5/10 genes and 3/7 proteins), under the LPS level and toward the untreated control. This is the case of PDGF-BB, a chemoattractant factor which is released at the site of inflammation, contributing to the disease progression( Reference Andrae, Gallini and Betsholtz 54 ). Krzystek-Korpacka et al. ( Reference Krzystek-Korpacka, Neubauer and Matusiewicz 55 ) showed that PDGF-BB was exclusively increased in active stages of IBD. Similarly, sTNF RII, one of the soluble receptors for TNF-α, which was found to be increased in case of acute intestinal inflammation( Reference Gustot, Lemmers and Louis 56 ), was also decreased by the GP + Lb treatment. Also, the synbiotic combination used in our study down-regulated the expression of TGF-β1 gene and protein, another promising alternative of anti-targeted therapies in IBD( Reference Ihara, Hirata and Koike 57 ). Chronic inflammation and aberrant tissue remodelling are hallmarks of IBD( Reference de Bruyn, Vandooren and Ugarte-Berzal 58 ). MMP (MMP-2 and MMP-9) and their natural inhibitors (TIMP-1 and TIMP-2) are important mediators of tissue remodelling, and their aberrant expression has been associated with inflammatory pathologies including IBD( Reference de Bruyn, Vandooren and Ugarte-Berzal 58 ). In this work, both MMP-2 and MMP-9 mRNA decreased under the control levels, whereas the TIMP (TIMP-1 and TIMP-2) gene expressions were restored by GP + Lb combination. In a study of Calabriso et al. ( Reference Calabriso, Massaro and Scoditti 59 ), the addition of a red grape polyphenol extracts (5 and 25 μg/ml) to the inflamed U397 macrophages suppressed the MMP-2 and MMP-9 gene expression and increased the TIMP-1 and TIMP-2 mRNA levels affected by PMA stimulation. Similarly, VSL#3 probiotic, a multistrain cocktail composed of Streptococcus thermophilus, and several species of Lactobacillus and bifidobacteria, reduced the MMP (MMP-2 and MMP-9) activity associated with inflammatory damage in rats( Reference Esposito, Iacono and Bianco 60 ).
Looking at the associated inflammatory signalling pathways, we evaluated the effect of combined treatment of GP and Lb on MAPK, Akt/P70S6K/mTOR and other kinase pathways. Our results confirmed that 69 % of all phospho-proteins analysed were up-regulated by LPS in Caco-2 cells. There are studies reporting that different bioactive compounds such as butein( Reference Lee, Seo and Jin 61 ), genistein( Reference Paradkar, Blum and Berhow 62 ), paeonol( Reference Ishiguro, Ando and Maeda 63 ) and salvia extract( Reference Kim, Narula and Jobin 64 ) down-regulated both inflammatory mediators and MAPK pathway. By contrast, Romier-Crouzet et al. ( Reference Romier-Crouzet, Van De Walle and During 65 ), in a study with seven natural polyphenolic extracts, demonstrated that only some of these extracts were able to down-regulate MAPK/NF-κB pathways. Mango extract could increase the level of JNK activation in IL-1β-treated Caco-2 cells, while cocoa and sugar cane extract up-regulated the activated ERK level. Many studies reported the attenuation of the MAPK/NF-κB-mediated inflammatory gene expression by probiotics, like Lactobacillus acidophillus ( Reference Priyamvada, Anbazhagan and Kumar 27 ), or mixture of bifidobacteria strains( Reference Tomosada, Villena and Murata 66 ). Also, the effect of probiotics on signalling pathways seems to be strain-specific( Reference Tomosada, Villena and Murata 66 ). In our study, the simultaneous addition of GP and Lb to the inflamed intestinal cells down-regulated the MAPK (50 % of genes and 60 % of proteins), Akt/P70S6K/mTOR (60 % genes and 83 % proteins) and other kinase signalling molecule expression (50 % for both genes and proteins) as well as the mRNA levels of Nrf2, NF-κB1, RELA, AhR, Cyp1A1 and Cyp1B1, confirming the involvement of these signalling pathways in IBD inflammatory mechanism.
Conclusions
In summary, our study indicates that the synbiotic combination of GP extract and lactobacilli mixture exerted several anti-inflammatory properties that are able to decrease the majority of the inflammatory LPS-induced genes, their proteins and associated signalling molecules. In total, 61·4 and 60 % of investigated genes and proteins, respectively (7/11 and 6/11 chemokines, 15/23 and 13/22 cytokines, 5/10 and 3/7 adhesion and other pro-inflammatory molecules), were down-regulated under the action of pre- and probiotic combination. Relevant pro-inflammatory cytokines and chemokines involved in response to microbial infection and inflammation like TNF-α, IFN-γ, IL-12p40, IL-7, GCSF and GM-CSF were restored under the level induced by LPS treatment and towards the unchallenged control. As expected, the reduction effect seems to imply MAPK and NF-κB pathway. Most of the signalling molecules activated by LPS were decreased by GP extract and Lb mix. Due to the protective role of GP compounds on lactobacilli probiotic, this synbiotic combination might serve as a promising adjunctive therapy in intestinal inflammation. However, other pre- and probiotic combinations need to be studied.
Acknowledgements
This work was supported by funds from the National Research Project PN-II-RU-TE-2014-4-1287 granted by the Romanian Ministry of Research and Technology. The authors thank Dr Catarina Ghosh (Project Manager at Covance Laboratories) for her help with the English corrections, receiving the permission for her nomination.
G. C. P. and I. T. conceived and designed the experiments. G. C. P. and D. E. M. performed the experiments. G. C. P. and C. D. analysed the data and performed the statistical analysis. I. T., G. C. P. and C. D. contributed reagents/materials/analysis tools. G. C. P. and I. T. wrote the paper. All authors read and approved the final manuscript.
The authors declare that there are no conflicts of interest.
Supplementary material
For supplementary material/s referred to in this article, please visit https://doi.org/10.1017/S0007114518003410


