


It is widely acknowledged that healthy dietary intake is fundamental to health and well-being across the lifespan(1,2) . To meet nutrition requirements and promote health and well-being, the Australian Dietary Guidelines describe an optimal dietary pattern for the general Australian population as containing a wide variety of nutritious foods from five groups, with limited intake of saturated fat, added salt, added sugars and alcohol(2). Healthy dietary intake is associated with a lower risk of overweight and obesity, chronic diseases (e.g. CVD), certain cancers and mental health disorders (e.g. stress and depression)(1,2) .
Despite these well-established benefits, many young adults worldwide, including university students, are not meeting dietary guidelines(Reference Burrows, Whatnall and Patterson3). For university students, the transition to higher education is a period often accompanied by emotional, psychological and financial challenges(Reference Wengreen and Moncur4). This period of change may also negatively impact their overall dietary patterns(Reference Wengreen and Moncur4), including low fruit and vegetable intake, high caloric intake, and increased alcohol consumption(Reference Burrows, Whatnall and Patterson3). Overall dietary intake among university students is important not only due to the association with health but also because of their potential influence on cognitive function, learning, academic performance and educational success(Reference Burkhalter and Hillman5). Academic performance at university may have lasting effects on students’ future health, quality of life, career and earning capacity(Reference Burrows, Whatnall and Patterson3). The potential causal association between dietary intake and educational outcomes (EO) has been outlined in a conceptual framework developed by the World Health Organisation (WHO), which also acknowledges a number of mediating factors including socio-economic status, gender, age and cognitive function(Reference Suhrcke and de Paz Nieves6).
Links between dietary intake and EO could be a function of multiple mechanisms. For example, a healthy dietary pattern is thought to influence brain structure and cognitive functioning through adequate intake of energy, essential macronutrients (e.g. polyunsaturated fat) and micronutrients (e.g. n-3) to meet individual nutritional requirements(Reference Murakami and Livingstone7). On the contrary, a poor dietary pattern with high levels of saturated fat and refined sugars can negatively impact cognitive function and in turn, EO(Reference Spencer, Korosi and Layé8). Beyond dietary pattern quality, however, the relationship between dietary intake and EO could generally be a function of overall health or access to resources(Reference Sogari, Velez-Argumedo and Gómez9).
A recent systematic review in university students identified only seven papers that found small-to-moderate positive associations between dietary intake (e.g. consuming regular meals, having breakfast and meeting recommendations for fruit intake) and academic achievement(Reference Burrows, Whatnall and Patterson3). However, most of the studies were of low quality and had several methodological limitations, such as using non-validated tools to measure dietary intake (i.e. through self-report surveys) and EO (e.g. self-reported grade point average (GPA)(Reference Burrows, Whatnall and Patterson3). This is an important limitation as non-validated tools may not appropriately and accurately capture dietary intake, potentially leading to lower precision when examining the relationship with EO(Reference Burrows, Whatnall and Patterson3). Many studies in the review also did not control for confounding factors (e.g. socio-economic status and gender)(Reference Burrows, Whatnall and Patterson3). Overall, although some additional studies have been conducted since this systematic review, available findings in this area are limited to cross-sectional studies largely originating in the USA(Reference Burrows, Whatnall and Patterson3), with a lack of longitudinal studies or studies published from the Australian higher education context(Reference Whatnall, Patterson and Burrows10). Longitudinal studies are important as they enable determination of changes in university students’ dietary intake and EO over time, whilst also considering and accounting for possible confounding factors that may also change over time (e.g. changes in living arrangements and employment status)(Reference Winpenny, Smith and Penney11).
The aim of this study was to examine cross-sectional and longitudinal associations between dietary intake and EO among first-year university students in Australia. This study addresses several of the limitations identified in previous research. The findings from this study have the potential to improve our understanding of the relationship between dietary intake and EO in university students and meaningfully contribute to the development of tailored policies and strategies that can help improve future students’ health and broader success.
Method
Study design
This study includes secondary data from a longitudinal study ‘Healthy Universities’ that collected health behaviour data from university students at three time points. Baseline data were collected at the start of the first academic semester (March 2014), with a 6-month follow-up at the start of the second academic semester (July 2014) and a 1-year follow-up at the start of the third academic semester (March 2015). As the current study aimed to examine associations between dietary intake and EO, participants from the Healthy Universities study were invited to provide informed consent to extract retrospective EO data. Ethical approval for both studies was obtained from The University of Queensland Ethics Committee in 2014 (Ref # 2013001628) and 2018 (Ref # 2018002476), respectively.
Recruitment and participants
For the Healthy Universities study, participants were recruited from two campuses (metropolitan and regional) of a large university in Queensland, Australia. To be included, participants had to meet the following criteria: (a) have completed secondary school in 2013 and (b) be aged between 17 and 19 years. This ensured that the sample had experienced the transition from high school to university in the preceding year. All participants from the Healthy Universities study (n 203) were invited to participate in the current study through email or telephone and were considered eligible to participate if they provided informed consent for extraction of their EO data at the time their health behaviour data were collected. Participants provided their informed consent electronically via an online Checkbox form (Checkbox Survey Solutions Inc.) prior to any data extraction. A flow diagram of the current study is presented in Fig. 1.

Fig. 1 STROBE flow diagram. EO, educational outcomes
Predictor variables
Self-reported fruit and vegetable intake
Participants’ usual fruit and vegetable intake was measured by asking participants to report their average daily serves of fruit and vegetables, respectively. These questions were developed from The Dietary Questionnaire for Epidemiological Studies, a validated food frequency questionnaire developed for use with Australian adults(Reference Hodge, Patterson and Brown12). These continuous data were also categorised for further interpretation as meeting/not meeting the Australian Dietary Guidelines, which recommend eating two serves of fruit and five serves of vegetables per d(13).
Self-reported alcohol intake
Participants were asked to report how often they consumed more than four standard drinks on one occasion in the past 12 months(14). This reflects the National Health and Medical Research Council, Australian Guidelines to Reduce Health Risk from Drinking Alcohol, which suggest that consuming more than four standard drinks on one occasion at any frequency is a risk to health(15). Responses varied across six categories, which were condensed to two categories for analysis (‘less than monthly or less frequently’ and ‘monthly or more frequently’) due to limited or no responses for the ‘non-drinker’ and ‘daily or almost daily categories’(15).
Nutrient intake
Energy and nutrient intake were assessed using a self-report, three-day estimated food record, which included two weekdays and one weekend day(16). Three-day estimated food records are considered to have acceptable validity in the adult population, with correlation coefficients of 0·14–0·56 when compared to 9-d food records(Reference Yang, Kim and Hwang17). The record consisted of a table template where participants were asked to record detailed food and drink intake (including estimation of portion sizes and detail for food item descriptors). Energy (kilojoule) and nutrient (grams/milligrams/micrograms) intake were determined from food record data using a standard nutrition analysis software (Foodworks, Xyris Software).
Due to the risk of bias associated with misreporting, the Goldberg cut-off criterion was used to identify under-reporters(Reference Black18). According to this criterion, which compares reported energy intake to estimated basal metabolic rate (BMR), participants with values <1·00 were identified as under-reporters and their data were converted to missing values (T1, n 17; T2, n 14; T3, n 15). BMR was calculated from Schofield equations based on age, gender and weight at the time of measurement(Reference Schofield19).
Macronutrients (carbohydrate, fat and protein) and alcohol intake were converted to a percentage of total daily energy intake (TDEI)(2). Macronutrient data were further categorised as meeting/not meeting the Acceptable Macronutrient Distribution Ranges (AMDR) from the Australian Nutrient Reference Values (45–65 % of total daily energy intake from carbohydrates, 20–35 % from fat and 15–25 % from protein)(20). Saturated fat intake was categorised as meeting/not meeting Australian recommendations of <10 % of total daily energy intake(20), and alcohol intake was categorised as meeting/not meeting the recommendation of < 5 % of total daily energy intake(21). Micronutrient intake was calculated in grams/milligram/micrograms and compared to the Australian Nutrient Reference Values(20) where relevant. Two responders were excluded from the data set as their values for Fe intake and Na intake at time point 1 were considered extreme outliers based on outliers estimated formula (mean ± 2 SD) and biological implausibility.
Outcome variables: educational outcomes
Objective EO data were obtained from the university’s academic records with approval from the academic registrar. EO data were extracted for semesters 1 and 2 2014 and semester 1 2015, corresponding with the health behaviour data collection points. EO data included (a) semester GPA (i.e. out of 7, based on the Australian grading scale), (b) withdrawal (calculated as number of ‘units enrolled’/‘units completed’ for each semester), (c) progress towards academic programme completion (measured using four levels of academic standing: good standing, academic warning, show cause and satisfactory progression following show cause), (d) overall GPA at time of graduation and (e) graduation status (yes/no).
Confounding factors
Several potential confounding factors were assessed. At baseline, demographic data were collected, including gender, country of birth, language, enrolling faculty and programme, and level of socio-economic advantage (as reflected by the Index of Community Socio-educational Advantage (ICSEA) of the high schools participants attended)(22). Data collected at all three time points included study load (full-time/part-time), living arrangements (on-campus/off-campus), employment status (not in paid/unpaid employment/other, full-/part-time/casual employment), BMI (BMI; kg/m2) (calculated using objective weight and height measures and classified using the WHO’s BMI categories(23)), psychological well-being (using the short version of the Warwick-Edinburgh Mental Well-being Scale (SWEMWBS)(Reference Stewart-Brown, Tennant and Tennant24)), psychological distress (using the Kessler Psychological Distress Scale(Reference Kessler, Barker and Colpe25)), smoking status(Reference Kim and Yang26), self-rated health and life satisfaction (using items from the General Social Survey(Reference Schnittker and Bacak27)), physical activity (measured using the Active Australia Survey(28–Reference Brown, Trost and Bauman30) and accelerometry(Reference Santos-Lozano, Marín and Torres-Luque31–Reference Swartz, Strath and Bassett33)), and sedentary behaviour (measured using items from the International Physical Activity Questionnaire (IPAQ)(Reference Craig, Marshall and Sjostrom34) and accelerometry(Reference Santos-Lozano, Marín and Torres-Luque31–Reference Swartz, Strath and Bassett33)).
Statistical data analyses
To describe the sample, descriptive statistics (n, percentages, mean and standard deviation) were calculated for demographic characteristics as well as predictor, outcome and confounding variables. Median and interquartile ranges were calculated for non-normally distributed variables (i.e. self-reported physical activity scores in MET min/week). All variables were tested for normality, and non-normally distributed variables were transformed using log10.
Before conducting any analyses, the variance of categorical variables was examined and variables with little or no variance were excluded from analyses (i.e. 97·5 % of participants were non-smokers and 96·5 % were meeting alcohol intake recommendations based on three-day food diary data). Subsequently, a number of categorical variables were recoded to optimise interpretable analyses. As part of this process, all variables with ≥ 4 categories were recoded into variables with two categories (i.e. self-reported alcohol intake, current living arrangements and current work status). Comparison tests were conducted to examine potential differences in demographic and dietary variables between (a) the initial sample for Healthy Universities study and the sample who consented to the current study and (b) those who participated in and those who dropped out of time points 2 and 3 of the Healthy Universities study.
To examine cross-sectional associations between dietary intake and EO, a combination of univariate and multivariate regression analyses was performed. First, depending on the dependent variable (i.e. continuous or categorical), either linear or binary logistic regressions were conducted between predictor variables (i.e. serves of fruit and vegetable, alcohol intake, nutrient and caffeine intake) and EO variables (i.e. semester GPA, overall GPA and graduation status) as well as between potential confounding factors and EO variables, for each of the three time points. During this step, residuals were checked for normal distribution to ensure appropriate model fit. Subsequently, multivariate analyses were conducted based on univariate analyses findings. To examine associations between dietary intake and EO variables over time, generalised estimating equations with exchangeable correlation structures were used. Generalised estimating equation is an extension of the generalised linear model that produces efficient and unbiased regression estimates in studies with repeated measures or longitudinal and other correlated observations(Reference Ballinger35). Generalised estimating equation models were first used to evaluate univariate associations between dietary intake variables, confounding factors and EO variables (semester GPA, overall GPA and graduation status). Following this step, multivariate analyses were performed based on results from univariate analyses.
To protect against residual confounding, variables were examined for collinearity, where a variance inflation factor ≥ 2 was considered a sign of multicollinearity. Predictor and confounding variables were considered for the final multivariate model analyses, if they had univariate associations with EO variables at P < 0·20 (as suggested elsewhere(Reference Links, Nisenbaum and Ambreen36)). For multivariate analyses, confounding variables were limited to three in models with three-day food record variables or four in models with fruit and vegetable intake and alcohol variables due to sample size and in order to maintain adequate power. Confounding factors were selected based on conceptual overlap and association with the outcomes. In multivariable models, variables were considered to be significantly associated with EO if P < 0·05. OR with 95 % CI were reported for all models. All analyses were conducted using IBM SPSS Statistics, version 27 (IBM Corp.).
Results
Sample characteristics
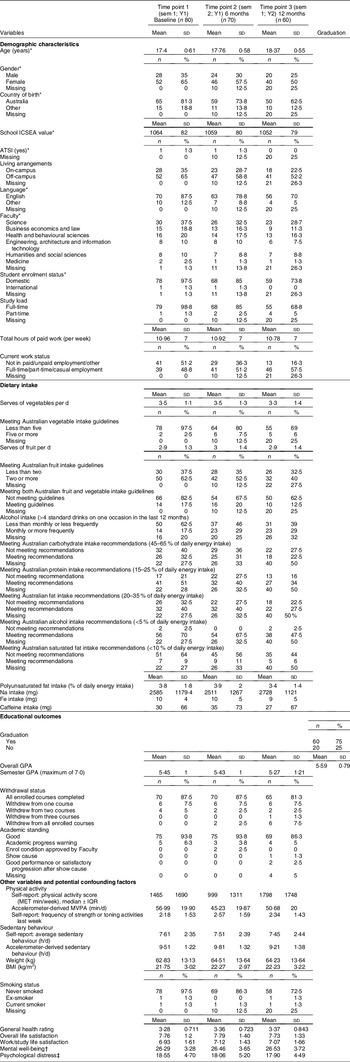
Sample characteristics are summarised in Table 1. Of the 203 students who had previously participated in the Healthy Universities study, eighty-one provided consent for the current study. However, one respondent was excluded from analyses due to a lack of EO data as they moved to another university in their first semester of studies. Accordingly, the final sample for the current study included eighty students (response rate: 40 %) from six faculties across the university, 99 % of whom were studying full-time. At time point 1, the mean age of participants was 17·4 (± 1) years, and most were female (65 %), born in Australia (81·3 %), and lived off-campus (65 %). The mean ICSEA value was 1064 (± 82), which represents an above-average educational advantage as measured by the parents’ occupation and level of education. There were no significant differences in demographic and dietary variables between (a) the initial sample for Healthy Universities studyand the sample who consented to the current study and (b) those who participated in and those who dropped out of time points 2 and 3 of the Healthy Universities study.
Table 1 Descriptive characteristics of the sample

sem, semester; n, sample size; ICSEA, Index of Community Socio-Educational Advantage; ATSI, Aboriginal or Torres Strait Islander; GPA, grade point average; MET, metabolic equivalent; IQR, interquartile range; MVPA, moderate-to-vigorous physical activity.
* Variables that were only examined at baseline.
† Out of a total score of 35.
‡ Out of a total score of 50.
Descriptive statistics for dietary intake and educational outcomes variables
Table 1 reports descriptive statistics for predictor and outcome variables. The proportion of participants meeting guidelines for serves of vegetables per d was low (2·5–7·5 %), whereas the proportion of participants meeting guidelines for serves of fruit per d was highest at time point 1 (62·5 %) but decreased over time. Students’ frequency of alcohol consumption (> 4 standard drinks per drinking occasion) increased after time point 1 (from T1, 17·5 % – T2, 29 %, respectively). According to three-day food record data, there was variability in the proportion of participants who met the carbohydrate, protein and fat intake recommendations, with an overall reduction over time in these variables. Caffeine intake was low across the three time points, with mean intakes equivalent to less than one small cup of coffee per d.
At the time of data collection, about 75 % of the sample had graduated from university, with good academic standing and an average overall GPA of 5·59 (± 0·79) out of 7. Nearly 80 % of the sample completed all enrolled courses. Due to a lack of variability, EO variables such as ‘withdrawal status’ and ‘academic standing’ were excluded from analyses. Thus, the variables used in analyses included semester GPA, overall GPA and graduation status (yes/no).
Associations between dietary intake and educational outcomes
Cross-sectional associations
Dietary intake and semester GPA
In univariate models focusing on the outcome variable of semester GPA (see online supplemental Table A), significant predictor variables (P < 0·20) were: (a) at time point 1, alcohol intake and meeting Australian recommendations for saturated fat and Na intake; (b) at time point 2, serves of vegetables per d, meeting Australian recommendations for fat, saturated fat and Na intake; and (c) at time point 3, serves of vegetables per d, meeting Australian recommendations for fat, saturated fat, Na and Fe intake. Once controlling for confounding factors, the only variables that remained significantly associated with semester GPA in multivariate models were serves of vegetables per d (β = 0·26, 95 % CI (0·034, 0·481)) and Na intake (Na intake is expressed as standardised β coefficients due to the unstandardised β value being small when expressed per mg; (β = -0·368, 95 % CI (-0·001, > 0·001)), both at time point 2. Alcohol intake at time point 1 (P = 0·051) and Na intake at time point 2 (P = 0·05) approached significance and were negatively associated with semester GPA, with a relatively strong coefficient for alcohol intake (β = 0·80). Relevant results are reported in Table 2.
Table 2 Multivariate linear regression analyses examining cross-sectional associations between dietary intake and semester GPA

GPA, grade point average; Sem, semester; VIF, variance inflation factor; MVPA, moderate-to-vigorous physical activity; ICSEA, Index of Community Socio-Educational Advantage.
*Tolerance was > 0·2 and VIF was ≤ 2, suggesting no significant multicollinearity among predictor variables.
†,‡,§Adjusted for total hours working, accelerometer-derived sedentary behaviour and mental well-being.
‖,¶,**,††Adjusted for country of birth, work/study life satisfaction and accelerometer-derived MVPA.
‡‡,§§,‖‖,¶¶,***Adjusted for Index of Community Socio-Educational Advantage values (school ICSEA value), self-reported sedentary behaviour (h/d) and accelerometer-derived MVPA.
†††This value is expressed as standardised β coefficients (in standard deviation units).
Note: only predictor variables that were significant in unadjusted models are presented.
Values in bold indicate a P value < 0·05.
Dietary intake and overall GPA
According to the findings of univariate models focusing on the outcome variable of overall GPA (see online Supplemental Table B), significant predictors (P < 0·20) were: (a) at time point 1, meeting Australian recommendations for saturated fat and Na intake, and (b) at time point 3, serves of vegetables per d, serves of fruit per d and alcohol intake. However, after adjusting for confounding factors in the multivariate models, none of these predictors were significantly associated with overall GPA (see Table 3).
Table 3 Multivariate linear regression analyses examining cross-sectional associations between dietary intake and overall GPA

GPA, grade point average; Sem, semester; VIF, variance inflation factor.
*Tolerance was > 0·2 and VIF was ≤ 2 suggesting no significant multicollinearity among the predictor variables.
†,‡Adjusted for total hours working, accelerometer-derived sedentary behaviour and mental well-being.
§,‖Adjusted for psychological distress, work/study life satisfaction and alcohol intake (> 4 standard drinks on one occasion in the last 12 months).
¶Adjusted for psychological distress, work/study life satisfaction, serves of fruit per d and serves of vegetables per d.
**This value is expressed as standardised β coefficients (in standard deviation units).
Note: only predictor variables that were significant in unadjusted models are presented.
Dietary intake and graduation status
In univariate models focusing on the outcome of graduation status (see online Supplemental Table C), significant predictor variables were: (a) at time point 1, meeting Australian recommendations for carbohydrate and Fe intake; (b) at time point 2, serves of vegetables per d, serves of fruit per d and meeting Australian recommendations for protein intake; and (c) at time point 3, meeting Australian recommendations for carbohydrate, saturated fat, and Na and Fe intake (all P < 0·20). After adjusting for confounding factors, the only predictor variables that remained significantly associated with graduation status in multivariate models were meeting Australian carbohydrate intake recommendations (OR: 8·815, 95 % CI (1·235, 62·913)) and Fe intake (OR: 0·815, 95 % CI (0·675, 0·984)), both at time point 1 (see Table 4).
Table 4 Multivariate binary logistic regression analyses examining cross-sectional associations between dietary intake and graduation status

Sem, semester; VIF, variance inflation factor; ICSEA, Index of Community Socio-Educational Advantage; MVPA, moderate-to-vigorous physical activity.
*Tolerance was > 0·2 and VIF was ≤ 2, suggesting no significant multicollinearity among the predictor variables.
†Adjusted for Index of Community Socio-Educational Advantage values (school ICSEA value), self-reported physical activity score in MET min/week and Fe intake.
‡Adjusted for Index of Community Socio-Educational Advantage values (school ICSEA value), self-reported physical activity score in MET min/week and meeting Australian carbohydrate intake recommendations.
§,‖Adjusted for Index of Community Socio-Educational Advantage values (school ICSEA value), accelerometer-derived MVPA (min/d), total hours working and meeting Australian protein intake recommendations.
¶Adjusted for Index of Community Socio-Educational Advantage values (school ICSEA value), total hours working and accelerometer-derived MVPA (min/d).
**,††,‡‡Adjusted for Index of Community Socio-Educational Advantage values (school ICSEA value), accelerometer-derived MVPA (min/d) and Fe intake.
§§Adjusted for Index of Community Socio-Educational Advantage values (school ICSEA value), accelerometer-derived MVPA (min/d) and meeting Australian carbohydrate intake recommendations.
Note: only predictor variables that were significant in unadjusted models are presented.
Values in bold indicate a P value < 0·05.
Longitudinal associations
Dietary intake and semester GPA
Serves of vegetables per d and alcohol intake were significantly associated (P < 0·20) with semester GPA over time (see online Supplemental Table D) in univariate generalised estimating equation analyses. When controlling for confounding factors, the only variable that remained significantly associated with semester GPA over time in multivariate models was serves of vegetables per d (β = 0·116, 95 % CI (1·001, 1·260)). However, alcohol intake approached significance and was negatively associated with semester GPA (OR: 0·595, 95 % CI (0·334, 1·063)) (see Table 5).
Table 5 Generalised estimating equations examining multivariate longitudinal associations between dietary intake and semester GPA

GPA, grade point average; GEE, generalised estimating equations; VIF, variance inflation factor.
* Tolerance was > 0·2 and VIF was ≤ 2, suggesting no significant multicollinearity among the predictor variables.
† Adjusted for total hours working, living arrangements and alcohol intake.
‡ Adjusted for total hours working, living arrangements and serves of vegetables.
Note: only predictor variables that were significant in unadjusted models are presented.
Values in bold indicate a P value < 0·05.
Discussion
Optimising EO at university is critical, given the established relationship between academic performance and various short- and long-term health and career outcomes(Reference Burkhalter and Hillman5). Available literature acknowledges the potential associations between dietary intake and EO in university students, which may be particularly important to investigate during the challenging transition from high school to university(Reference Burrows, Whatnall and Patterson3). Accordingly, this study examined cross-sectional and longitudinal relationships between dietary intake and different indicators of EO among first-year university students in Australia. It was designed to address limitations identified in previous research and was guided by the WHO framework, emphasising the association between health behaviours and EO, and acknowledging a range of factors that may mediate this relationship(Reference Burrows, Whatnall and Patterson3,Reference Suhrcke and de Paz Nieves6) .
Semester GPA is the most frequently reported indicator of EO in research investigating associations with dietary intake(Reference Burrows, Whatnall and Patterson3). The current study identified moderate significant cross-sectional and longitudinal associations between serves of vegetables and semester GPA after adjusting for confounding factors. Cross-sectionally, there was an increase in semester GPA at time point 2 of 0·26 points on a seven-point scale for every extra serve of vegetables per d; longitudinally, semester GPA increased 0·12 points on a seven-point scale for every additional serve of vegetables per d. This highlights the importance of sufficient intake of vegetables for EO since vegetables are known as rich sources of vitamins, minerals and phytochemicals, which have an impact on brain health, cognitive functioning and learning(Reference Gehlich, Beller and Lange-Asschenfeldt37). The comparison of the current findings with other evidence is challenging due to different methodological approaches. Previous studies measured vegetable intake as a categorised scale (e.g. meeting/not meeting guidelines), but only Whatnall(Reference Whatnall, Patterson and Burrows10) and the current study considered a continuous scale. Overall, the current findings are inconsistent with other literature reporting insignificant or very small cross-sectional associations between semester GPA and meeting vegetable intake guidelines alone(Reference Whatnall, Patterson and Burrows10,Reference Peltzer and Pengpid38–Reference Ong, Hutchesson and Patterson40) or combined with fruit intake guidelines(Reference Peltzer and Pengpid38). The lack of a significant association between vegetable intake and GPA in the available evidence could be due to measuring vegetable intake as a categorical variable, which may not capture small but meaningful changes in intake. For example, guidelines may recommend five serves of vegetables per d, which means that those consuming four serves and no serves are all captured within the same group, meaning changes in intake over time are difficult to capture. Whereas using a continuous scale for vegetable intake ensures that these small changes in consumption are captured. Further, despite the categorical approach being widely used among scholars, it has been criticised as a poor methodological approach due to misleading results, biased coefficients and reducing the statistical power(Reference Fernandes, Malaquias and Figueiredo41). Collectively, our findings and the findings of Whatnall(Reference Whatnall, Patterson and Burrows10) suggest that using serves of vegetables on continuous scale (v. meeting/not meeting recommendations) when examining associations with EO is an accurate approach to determine meaningful and significant associations. Our findings suggest that any increase in vegetable intake, despite meeting or not meeting guidelines, may have a meaningful impact on EO.
The current study identified a small significant association between Na intake and semester GPA at time point 2. For every 1 sd increase in Na intake (1267 mg, which represents 63 % of the suggested dietary target of 2000 mg/d), there was an associated decrease in semester GPA of 0·368. While there are no comparable studies that report Na intake and their association with EO(Reference Burrows, Whatnall and Patterson3), previous evidence indicated that increased consumption of food that is high in Na is associated with a lower GPA in university students(Reference Whatnall, Patterson and Burrows10,Reference Reuter, Forster and Brister39,Reference Ong, Hutchesson and Patterson40) . The magnitude of the association between Na intake and semester GPA was negligible both in our study and previous studies, which indicates that Na intake may be more important to consider in investigations focusing on chronic disease risk than EO.
Our cross-sectional and longitudinal findings demonstrated a moderate to large decrease in semester GPA for students who were consuming alcohol (> 4 standard drinks/occasion) more frequently at time point 1 (80 % decrease) and over time (40 %). Although these associations were insignificant, the magnitude of coefficients was substantial. This highlights that frequency of heavy alcohol consumption may negatively influence GPA due to impaired cognitive abilities (e.g. memory, attention) for long periods of time and displacement of study time or class attendance(Reference Hallett, Howat and McManus42). The current findings reinforce the findings of other studies in Australia and the USA that showed higher consumption of alcohol was associated with lower GPA(Reference Ong, Hutchesson and Patterson40). However, the strength of the associations in our study was stronger than in the above studies. Further studies are needed to confirm these associations.
One of the ways in which this study extends previous relevant research is by using a wider range of EO indicators, including overall GPA and graduation status. The sole use of semester GPA in previous literature has been criticised as a potentially inaccurate reflection of student performance as it is more susceptible to the level of challenge or nuances in specific courses, disciplines or institutions(Reference Burrows, Whatnall and Patterson3,Reference Caskie, Sutton and Eckhardt43) . In the present study, no significant associations were determined with overall GPA; however, it is useful to consider more than statistical significance alone when interpreting results and making comparisons with other studies. For example, while serves of fruit were not significantly associated with overall GPA in the present study, the magnitude of the effect is comparable with those of previous studies that reported a positive but weak association with GPA(Reference Whatnall, Patterson and Burrows10,Reference Peltzer and Pengpid38,Reference Ong, Hutchesson and Patterson40) . The discrepancy in significance between our findings and those of other relevant studies may be attributed to the fact that those studies had larger sample sizes (1500–1600)(Reference Peltzer and Pengpid38,Reference Ong, Hutchesson and Patterson40) than the current study, which increase statistical power(Reference Lin, Lucas and Shmueli44). This association is weak in both the literature and the present study; however, it is meaningful to improving EO. This is because fruit contains many vitamins and minerals that are essential for developing brain health, cognitive functioning and learning(Reference Gehlich, Beller and Lange-Asschenfeldt37).
The present study also found that students who met the Australian recommendations for carbohydrates were nine times more likely to graduate than those who did not meet recommendations. However, this finding should be interpreted with caution, because the CI was very wide. This association could be related to the beneficial effects of carbohydrates on cognitive performance, mood and stress(Reference Markus45), which could in turn positively contribute to EO. The current study also observed the likelihood of graduating was 20 % lower with every milligram increase in Fe intake. This finding was unexpected and is inconsistent with most relevant findings in schoolchildren that demonstrate a positive association between Fe take and academic performance(Reference Burrows, Goldman and Pursey46). Overall, however, there is limited literature exploring the association between Fe intake and EO in both school-aged and university students(Reference Burrows, Whatnall and Patterson3,Reference Burrows, Goldman and Pursey46) . Therefore, this finding should be interpreted with caution, and the association between Fe intake and EO should be revisited in further studies.
The WHO conceptual framework that informed this study acknowledges the complex nature of the relationship between health behaviours and EO and highlights the need to consider confounding factors in relevant investigations(Reference Suhrcke and de Paz Nieves6). Adjusting for potential confounding factors is essential to determine the potential contributions of other factors to the relationships of interest(Reference Skelly, Dettori and Brodt47). Failure to consider appropriate confounding factors may camouflage an existing association or unadjusted models may demonstrate an association when no significant association exists(Reference Skelly, Dettori and Brodt47). Our study attempted to address this identified limitation in the body of work examining the relationship between dietary intake and EO(Reference Burrows, Whatnall and Patterson3), and our findings indicate that some factors (e.g. socioeconomic status, Fe intake and sedentary behaviour) play a significant role in this relationship; following adjustment for these factors, some significant associations between predictor variables and EO no longer existed. To illustrate, the association between meeting Australian saturated fat intake recommendations and overall GPA was no longer significant when controlled for sedentary behaviour. This was identical to the association between several predictor variables (e.g. meeting Australian intake of carbohydrate, saturated fat and Na) and graduation status when controlling for Fe intake, suggesting that Fe intake is a factor that should be accounted for in future-relevant investigations.
The findings of the current study indicate that a greater intake of vegetables, consuming alcohol less frequently, meeting Australian carbohydrate intake recommendations and a lower intake of Na may be related to higher EO. Although dietary patterns have not been assessed in the current study, the variables identified above are aligned with a Mediterranean dietary pattern, which encourages high intakes of vegetables, fruit, nuts, grains, legumes, olive oil, and fish, moderate consumption of alcohol, and small amounts of high-fat dairy products and red meat(Reference Gotsis, Anagnostis and Mariolis48). Indeed, a recent review indicated that the Mediterranean dietary pattern is the most beneficial diet for overall health, mental and academic outcomes in university students(Reference Antonopoulou, Mantzorou and Serdari49). Future studies focusing on associations with EO should look at dietary patterns and adherence to a Mediterranean dietary pattern specifically as well as individual nutrients. Future interventions should also examine incremental changes in dietary intake rather than simply focusing on whether participants meet guidelines to capture meaningful changes in intake. Future interventions should design strategies that promote fruit and vegetable intake and reduce intake of alcohol, fatty and higher Na food within the university context. Since students spend large amounts of time on university campuses, it would be also useful to apply policies related to food quality in university restaurants and cafes to offer healthy food options at reasonable prices. Additionally, improving the level of nutritional knowledge and facilitating access to relevant information through targeted nutrition courses and campaigns on a regular basis may be particularly useful for students who do not major in health-related programmes.
This study has several strengths, including the use of validated assessment tools for dietary intake and the collection of objective EO measures and EO measures that have previously been ignored (e.g. overall GPA and graduation) in this body of work. Furthermore, a large range of confounding factors were used in this study, including demographic factors, student characteristics and health behaviours. Moreover, the time of data collection was aligned for health behaviour and EO data. Finally, since participants were recruited from a variety of faculties and programmes across metropolitan and regional campuses, the findings of this study may be generalisable to students from other universities.
Limitations of this study include a lack of consideration of over-reporters of energy intake, which could be associated with risk of bias. Over-reporters were not calculated in the current study due to the known association between obesity and misreporting(Reference Black18). Overall, our study population had a mean BMI in the healthy weight range, meaning that over-reporting is less likely. Additionally, social desirability bias in reporting dietary intake is more commonly linked to under-reporting. Given we did not directly measure energy expenditure, the methods used for under-reporting introduce a level of assumption, which if extended further to over-reporters, was likely to exclude those with plausible results. In larger studies where there is a greater range in the BMI of participants, it is suggested that over-reporters are also identified. Moreover, the current study had a relatively small sample size at baseline, time point 2 and time point 3 (n 80, 70 and 60, respectively), largely because it built on a previous study that required investigators to contact previous participants, resulting in a relatively low baseline response rate (40 %). Additionally, the sample in our study presented low variability in GPA and other indicators of EO (i.e. the sample was, on average, high performing), which influenced our findings and should be taken into consideration when interpreting them. Further, participant’s faculty of enrolment was not able to be included in analyses as a covariant due to limited variability. Finally, twenty participants in this study were classified as not having graduated at the time of data collection; however, they may have since graduated from university or still intend to graduate. Further studies are needed to confirm our findings by recruiting larger sample sizes with greater variability in EO and using validated measures of dietary intake and EO.
Conclusion
This is the first study to investigate cross-sectional and longitudinal associations between dietary intake (i.e. self-reported dietary intake measured using a three-day estimated food record) and various EO (e.g. semester GPA, overall GPA at time of graduation and graduation status) using validated measures while considering a wide range of confounding factors. Our findings indicated moderate positive associations between self-reported serves of vegetables and semester GPA at time point 2 and over time. Further, our findings indicated a weak negative association between Na intake and semester GPA at time point 2, and non-significant negative associations (substantial reduction) between frequency of consuming alcohol and semester GPA at time point 1 and over time. A significant positive association between meeting Australian carbohydrate recommendations and graduation status and significant negative association between Fe intake and graduation status were found at time point 1. These findings reveal the importance of the relationship between vegetable intake and EO in both cross-sectional and longitudinal analysis. Future interventions should implement and determine the effectiveness of strategies to improve vegetable intake among university students. Further studies should measure vegetable intake as a continuous variable when examining associations with EO. More research is needed to understand the relationship between dietary intake and EO that uses larger samples with higher variability in demographic, dietary and EO characteristics.
Acknowledgements
Acknowledgements: The authors thank Dr Asad Khan for providing advice on data analysis. Financial support: This article is part of a PhD project funded by The Saudi Arabian Cultural Mission Scholarship, Umm Al-Qura University. Authorship: L.B., S.R.G. and M.S. designed the study. L.B. and S.R.G. collected the data. L.B. led data analysis, with contributions from S.R.G., M.S. and J.W. L.B. wrote the first draft with contributions from S.R.G., M.S. and J.W. All authors reviewed and commented on subsequent drafts of the manuscript. Ethics of human subject participation: This study was conducted according to the guidelines laid down in the Declaration of Helsinki, and all procedures involving research study participants were approved by The University of Queensland Ethics Committee in 2014 (Ref # 2013001628) and 2018 (Ref # 2018002476). Written informed consent was obtained from all subjects.
Conflicts of interest:
There are no conflicts of interest.
Supplementary material
For supplementary material accompanying this paper visit https://doi.org/10.1017/S1368980022001847


 Open access