


While food choice is influenced by a large number of factors(Reference Shepherd1), the price of food is clearly an important determinant(Reference Glanz, Basil, Maibach, Goldberg and Snyder2, Reference Lennernas, Fjellstrom, Becker, Giachetti, Schmitt, Remaut de Winter and Kearney3). Generally, energy-dense and nutrient-dilute foods such as cereals, fats and oils, and sugar and sweets provide dietary energy at lowest cost. Conversely, the cost per kilojoule of energy-dilute and nutrient-dense foods, including vegetables, fish and fruit, is much higher. If healthier foods cost more then so too will healthier diets. In fact, several(Reference Maillot, Darmon, Vieux and Drewnowski4–Reference Schroder, Marrugat and Covas9) although not all(Reference Murakami, Sasaki, Okubo, Takahashi, Hosoi and Itabashi10) observational studies have shown that healthful diets are more expensive than less healthful diets.
However, all of these previous studies have estimated both monetary diet costs and dietary intake based on self-reported dietary intake obtained by the same dietary assessment method, resulting in an inevitable overestimation of the association between monetary diet cost and dietary intake due to errors shared by monetary diet costs and dietary intake. Given the difficulty in estimating monetary diet cost at the individual level without dietary intake information(Reference Darmon, Briend and Drewnowski11) as well as the existence of valid biomarkers for dietary intake of several nutrients(Reference Bingham and Cummings12–Reference Hunter16), the combined use of monetary diet cost estimated from self-reported dietary intake information and biomarker-based estimates of dietary intake is an attractive alternative methodology for this important public health issue.
The Japan Dietetic Students’ Study for Nutrition and Biomarkers(Reference Murakami, Sasaki and Takahashi17–Reference Murakami, Sasaki and Takahashi19) is unique in that both estimates of monetary cost of self-reported diet and urine biomarker-based estimates of dietary intake are available (although blood biomarkers of dietary intake are unfortunately unavailable due to limited financial resources). In the current preliminary report, we used this data set to investigate the association of monetary diet cost(Reference Murakami, Sasaki, Okubo, Takahashi, Hosoi and Itabashi10) estimated from a self-administered, comprehensive diet history questionnaire (DHQ)(Reference Sasaki, Yanagibori and Amano20–Reference Murakami, Sasaki, Takahashi, Okubo, Hirota, Notsu, Fukui and Date23) with biomarker-based estimates of dietary protein(Reference Bingham and Cummings12, Reference Kipnis, Midthune, Freedman, Bingham, Schatzkin, Subar and Carroll13), K(Reference Holbrook, Patterson, Bodner, Douglas, Veillon, Kelsay, Mertz and Smith14, Reference Tasevska, Runswick and Bingham15) and Na(Reference Holbrook, Patterson, Bodner, Douglas, Veillon, Kelsay, Mertz and Smith14, Reference Hunter16) obtained from 24 h urinary excretion.
Subjects and methods
Subjects
The present study was based on a cross-sectional multi-centre survey conducted from February to March 2006 and from January to March 2007 among female dietetic students from fifteen institutions in Japan. Detailed descriptions of the survey have been published elsewhere(Reference Murakami, Sasaki and Takahashi17–Reference Murakami, Sasaki and Takahashi19). Briefly, staff at each institution provided an outline of the survey to potential subjects. Those who agreed to participate were then provided detailed written and oral explanations of the survey’s general purpose and procedure. A total of 1176 Japanese women took part. All measurements at each institution were conducted according to the survey protocol. The study protocol was approved by the Ethics Committee of the National Institute of Health and Nutrition, Japan. Written informed consent was obtained from each subject, and also from a parent for subjects aged <20 years.
Monetary diet cost
Dietary habits during the preceding month were assessed using a self-administered, comprehensive DHQ. Detailed descriptions of the DHQ concerning its structure, calculation of dietary intake and validity for commonly studied nutritional factors have been published elsewhere(Reference Sasaki, Yanagibori and Amano20–Reference Murakami, Sasaki, Takahashi, Okubo, Hirota, Notsu, Fukui and Date23). Responses to the DHQ were checked at least twice for completeness by trained survey staff (mostly registered dietitians) and, when necessary, forms were reviewed with the subject to ensure the clarity of answers. Briefly, the DHQ is a 16-page structured questionnaire which asks about the consumption frequency and portion size of selected foods commonly consumed in Japan as well as general dietary behaviour and usual cooking methods(Reference Sasaki, Yanagibori and Amano20). Estimates of daily intake for foods (150 items in total) and energy were calculated using an ad hoc computer algorithm for the DHQ(Reference Sasaki, Yanagibori and Amano20, Reference Murakami, Sasaki, Takahashi, Okubo, Hirota, Notsu, Fukui and Date23), which was based on the Standard Tables of Food Composition in Japan (24).
Monetary cost of the habitual diet (Japanese yen/d) was calculated by multiplying the amount of each food estimated from the DHQ (g/d) by the estimated price of the food (Japanese yen/g) and summing the products (1 Japanese yen = 0·0048 GBP = 0·0062 € = 0·0095 $US in May 2008). A detailed description of the cost calculation method as well as the monetary cost of each food has been published elsewhere(Reference Murakami, Sasaki, Okubo, Takahashi, Hosoi and Itabashi10). Briefly, the price of each food was determined based on the National Retail Price Survey 2004(25). For foods whose price was not published in the survey (thirteen items), prices were taken from the websites of a nationally distributed supermarket (Seiyu, Tokyo, Japan) or fast-food restaurant (McDonalds, Tokyo, Japan and Mister Donut, Tokyo, Japan) chain. Alcoholic beverages (six items), non-caloric beverages (four items) and water (three items) were excluded from calculation(Reference Maillot, Darmon, Vieux and Drewnowski4). Costs of combined foods such as pizza were calculated using the prices of frozen equivalents(Reference Schroder, Marrugat and Covas9). The procedure for estimating costs was based on the assumption that all foods were purchased and then prepared and consumed at home(Reference Darmon, Briend and Drewnowski11).
While the misreporting of dietary intake, a serious problem associated with self-report dietary assessment methods, is strongly associated with BMI not only in Western populations with relatively high mean BMI(Reference Livingstone and Black26) but also in Japanese populations with relatively low mean BMI(Reference Murakami, Sasaki and Takahashi17), BMI-dependent misreporting seems to be cancelled by energy adjustment, at least for protein, K and Na(Reference Murakami, Sasaki and Takahashi17). Energy-adjusted values of total monetary diet cost as well as the monetary cost of selected food groups (Japanese yen/1000 kJ) were thus calculated by dividing the estimated monetary cost (Japanese yen/d) by the total energy intake (kJ/d) and multiplying by 1000. Categorization of food groups has been published elsewhere(Reference Murakami, Sasaki, Okubo, Takahashi, Hosoi and Itabashi10).
Biomarker-based estimate of nutrient intake
Within 1–3 d after completion of the questionnaires, a single 24 h urine collection was performed. Detailed descriptions of the procedure of 24 h urine collection have been published elsewhere(Reference Murakami, Sasaki and Takahashi17, Reference Murakami, Sasaki and Takahashi19). Briefly, subjects were provided with three or four 1-litre bottles (containing no additives), ten 400 ml cups marked with 50 ml lines on both the inner and outer surfaces (to facilitate urine collection and missing urine estimation) and a recording sheet, and were asked to collect all urine specimens during a 24 h period in the bottles (using the cups) as well as to record on the sheet the time of the start and end of the collection period (start usually 06.00–09.00 hours) and the estimated volume of all missing urine specimens. The recording sheet was reviewed by the staff when the collection bottles were handed in, and any missing information was obtained from subjects. In the 2006 survey, the height of urine in each bottle was measured and later converted into volume with an empirical formula based on repeated measurements of volume in identical bottles, as described in a previous study(Reference Stamler, Elliott, Dennis, Dyer, Kesteloot, Liu, Ueshima and Zhou27); in the 2007 survey, the total urine volume was directly measured using a graduated cylinder. We adjusted 24 h urine volume by self-reported collection time (calculated from the self-reported time of the start and end of the collection period) and missing urine volume; the utility of this adjustment has been indicated, at least in well-motivated populations(Reference Murakami, Sasaki and Takahashi19).
All urine samples taken over the 24 h period were carefully mixed, and several aliquots were taken and transported at −20°C by car or aeroplane to ensure delivery to a laboratory (SRL Inc., Tokyo, Japan in 2006 and Mitsubishi Kagaku Bio-Clinical Laboratories Inc., Tokyo, Japan in 2007). All biochemical variables used in the present study were assayed at the laboratory within 1–2 d of collection to avoid significant degradation. Urea-N concentrations were measured using the enzymatic assay method, K and Na using the electrode method, and creatinine (for the assessment for completeness of urine collection) using the enzymatic assay method. In-house quality control procedures for all assays were conducted at the respective laboratory. Total 24 h excretion was calculated by multiplying the measured concentration by the (adjusted) volume of 24 h urine. Urea-N content in 24 h urine was multiplied by 9·08, assuming that urea-N is in constant proportion (85 %) to total urinary N(Reference Bingham and Cummings12), 81 % of ingested N is excreted through the urine(Reference Bingham and Cummings12, Reference Kipnis, Midthune, Freedman, Bingham, Schatzkin, Subar and Carroll13) and N constitutes 16 % of protein. K content in 24 h urine was divided by 0·77, assuming that 77 % of ingested K is excreted through the urine(Reference Holbrook, Patterson, Bodner, Douglas, Veillon, Kelsay, Mertz and Smith14, Reference Tasevska, Runswick and Bingham15). Na content in 24 h urine was divided by 0·86, assuming that 86 % of ingested Na is excreted through the urine(Reference Holbrook, Patterson, Bodner, Douglas, Veillon, Kelsay, Mertz and Smith14, Reference Hunter16).
On the day the collected 24 h urine sample was handed in, body height and weight were measured to the nearest 0·1 cm and 0·1 kg, respectively, while the subject was wearing light clothes and no shoes. BMI was calculated as body weight (kg) divided by the square of body height (m). Energy expenditure can be estimated as BMR multiplied by an appropriate physical activity level value(Reference Black, Coward, Cole and Prentice28). BMR was estimated using measured body weight according to the FAO/WHO/United Nations University equation for women aged 18–30 years(29). In the absence of an accurate and comprehensive measure of physical activity, we could not assign each subject an appropriate physical activity level value. In our sample, self-reported time spent on sedentary activities was predominant compared with that spent on high-intensity activities, moderate-intensity activities and walking (mean: 16·44, 0·06, 0·25 and 0·45 h/d, respectively) indicating a predominantly sedentary lifestyle, as described previously(Reference Murakami, Sasaki, Takahashi and Uenishi18). We thus estimated energy expenditure as estimated BMR by physical activity level value for light activity (1·56)(29). Considering the influence of body size (and physical activity) on the amount of food consumed and hence urinary excretion of nutrients, energy-adjusted values of biomarker-based estimates of nutrient intake (percentage of energy for protein and mg/1000 kJ for K and Na) were calculated using 24 h urinary excretion (with conversion for intake estimation, as described above) and estimated energy expenditure(Reference Murakami, Sasaki and Takahashi17, Reference Heitmann and Lissner30).
Statistical analysis
All statistical analyses were performed with the SAS statistical software package version 8·2 (SAS Institute Inc., Cary, NC, USA). Using the PROC GLM procedure, linear regression models were constructed to examine the association of monetary cost of the self-reported diet (total and selected food groups) with biomarker-based estimates of nutrient intake (protein, K and Na). For analyses, subjects were categorized into quintiles according to monetary cost of the self-reported diet. Mean values (with 95 % confidence intervals) of biomarker-based estimates of nutrient intake were calculated by quintile of monetary cost of the self-reported diet. Adjustment was made for survey year (2006 or 2007) because of the differences in the procedure used to measure 24 h urine volume and in the laboratory used for biochemical measurements. For analysis of the monetary costs of individual food groups, adjustment was also made for the monetary costs of all other food groups (continuous). We tested for linear trends with increasing levels of monetary cost of self-reported diet by assigning each participant the median value for the category and modelling this value as a continuous variable. We also calculated the regression coefficient (and 95 % confidence interval) expressing changes of biomarker-based estimates of nutrient intake for an increment of monetary costs of 1 Japanese yen/1000 kJ of self-reported diet by multiple regression analysis (using the PROC REG procedure). All reported P values are two-tailed and P < 0·05 was considered significant.
Results
In total, 1105 of 1176 women undertook 24 h urine collection. For the present analysis, women aged 18–22 years were selected (n 1083). We then excluded women not completing survey questionnaires (n 1) and those with extremely low or high reported energy intakes (<2092 or >16 736 kJ/d; n 1). We further excluded those whose 24 h urine collection was considered incomplete (n 35) as assessed using information on urinary creatinine excretion and body weight based on a strategy proposed by Knuiman et al.(Reference Knuiman, Hautvast and van der Heyden31) and as per our previous analysis(Reference Murakami, Sasaki and Takahashi19), which showed that only thirty-six (5·5 %) of 654 Japanese female dietetic students were identified as having incomplete 24 h urine by the p-aminobenzoic acid check method and that this creatinine-based strategy was useful (sensitivity: 0·47; specificity: 0·99), at least in well-motivated populations where the proportion of incomplete urine is presumed to be small. The final analysis sample comprised 1046 women.
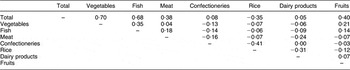
Basic characteristics of the subjects are shown in Table 1. Important contributors to total monetary diet cost were vegetables, fish, meat and confectioneries, followed by rice, dairy products and fruits. Pearson’s correlation matrix of monetary costs of self-reported diet is shown in Table 2. Total monetary cost of self-reported diet was correlated relatively strongly with the monetary costs of vegetables and fish; modestly with those of meat, rice and fruits; and somewhat weakly with those of confectioneries and dairy products. Correlations among the monetary costs of food groups were low to modest.
Table 1 Basic characteristics of 1046 Japanese women aged 18–22 years: subset of participants in the Japan Dietetic Students’ Study for Nutrition and Biomarkers, 2006 and 2007

* 1 Japanese yen = 0·0048 GBP = 0·0062 € = 0·0095 $US in May 2008.
Table 2 Pearson’s correlation matrix of monetary costs of self-reported diet (Japanese yenFootnote */1000 kJ) in 1046 Japanese women aged 18–22 years: subset of participants in the Japan Dietetic Students’ Study for Nutrition and Biomarkers, 2006 and 2007
* 1 Japanese yen = 0·0048 GBP = 0·0062 € = 0·0095 $US in May 2008.
Associations between monetary cost of self-reported diet and biomarker-based estimates of nutrient intake are shown in Table 3. Similar results were observed when monetary cost of self-reported diet was treated as a categorical variable (quintile) and as a continuous variable. Total monetary cost of self-reported diet was significantly positively associated with biomarker-based estimates of protein, K and Na intake. The monetary cost of vegetables was also significantly positively associated with all three nutrients, while the monetary cost of fish showed a significant and positive association with protein but not with K or Na. Regarding the monetary costs of other foods, there were significant negative associations between the monetary cost of confectioneries and Na and between that of fruits and protein and Na, and significant positive associations between that of dairy products and protein and K.
Table 3 Biomarker-based estimates of nutrient intake according to quintile (Q) of monetary cost of self-reported diet in 1046 Japanese women aged 18–22 yearsFootnote *: subset of participants in the Japan Dietetic Students’ Study for Nutrition and Biomarkers, 2006 and 2007

* n 209 in Q1, Q2, Q4 and Q5 and n 210 in Q3 for all monetary cost variables. Adjustment was made for survey year (2006 or 2007). For analysis of monetary costs of individual food groups, adjustment was also made for the monetary costs of all other food groups (Japanese yen/1000 kJ, continuous).
† 1 Japanese yen = 0·0048 GBP = 0·0062 € = 0·0095 $US in May 2008.
‡ Median (all such values).
§ A linear trend test was used with the median value in each quintile as a continuous variable in linear regression analysis.
∥ Expressing changes of biomarker-based estimates of intake of protein (percentage of energy), K (mg/1000 kJ) or Na (mg/1000 kJ) for an increment of monetary costs of 1 Japanese yen/1000 kJ of self-reported diet. Adjustment was made for survey year (2006 or 2007). For analysis of monetary costs of individual food groups, adjustment was also made for the monetary costs of all other food groups (Japanese yen/1000 kJ, continuous).
Discussion
In the current preliminary study of young Japanese women, we found that total monetary cost of self-reported diet was positively associated with biomarker-based estimates of protein, K and Na intake. To our knowledge, the present study is the first to examine the relationship of monetary costs of the self-reported diet with biomarker-based, rather than self-reported, estimates of dietary intake.
A limited number of observational studies in Europe have consistently shown that healthful diets are more expensive than less healthful diets, using diet cost and intake variables derived from self-reported dietary intake information(Reference Maillot, Darmon, Vieux and Drewnowski4–Reference Schroder, Marrugat and Covas9). Conversely, monetary diet costs seem to be associated with both favourable and unfavourable dietary intake patterns in Japan; monetary cost of self-reported diet was positively associated with self-reported intakes of protein, dietary fibre and key micronutrients, including K, but also positively associated with self-reported intake of Na, fat, SFA and cholesterol and negatively with self-reported carbohydrate intake in young Japanese women(Reference Murakami, Sasaki, Okubo, Takahashi, Hosoi and Itabashi10). The present findings of positive associations between total monetary costs of self-reported diet and biomarker-based estimates of protein, K and Na intake in young Japanese women are highly consistent with this previous self-report-based Japanese study(Reference Murakami, Sasaki, Okubo, Takahashi, Hosoi and Itabashi10). Given that the common belief that a healthy diet costs more is supported by the above-mentioned European studies, which rely exclusively on self-reported dietary information, more research using biomarker-based estimates of dietary intake is needed. This need is emphasized by the importance of associations between dietary cost and intake to public health.
In the present study, vegetables and fish were not only the main contributors to total diet cost but also were relatively strongly correlated with it. Additionally, the monetary cost of vegetables was positively associated with protein, K and Na, while that of fish was positively associated with protein, but not with K or Na. Thus, the positive associations of total monetary diet cost with protein, K and Na intake appear to be mainly accounted for by the monetary costs of vegetables and fish. While fruit (in addition to vegetables and fish) is an important contributor to total diet cost in European populations(Reference Cade, Upmeier, Calvert and Greenwood8, Reference Schroder, Marrugat and Covas9), its contribution in the present Japanese study was quite small. This important difference, aside from differences in dietary habits, may be one explanation for the differences between Japanese and European studies on the associations between dietary cost and intake.
Several limitations of the present study warrant mention. First, our subjects were selected female dietetic students, not a random sample of Japanese people, and the exact response rate was unknown because of our recruitment procedure (although an approximate response rate was 56 %); these elements of the design may have produced recruitment bias. As such the subjects may have healthier dietary habits than the general population, although with regard to the self-reported intake of energy, protein, K and Na and BMI at least, mean values in the present study (7406 kJ/d, 60·1 g/d, 1985 mg/d, 3626 mg/d and 21·2 kg/m2, respectively) were relatively comparable to those of a representative sample of Japanese women aged 20–29 years (7000 kJ/d, 62·8 g/d, 1976 mg/d, 3661 mg/d and 20·5 kg/m2, respectively)(32). Additionally, students may not be directly paying the costs of food themselves. Thus, our results cannot be extrapolated to males or non-students and of course the general Japanese population, or even to the general student community.
Dietary data were collected using a self-administered semi-quantitative DHQ(Reference Sasaki, Yanagibori and Amano20–Reference Murakami, Sasaki, Takahashi, Okubo, Hirota, Notsu, Fukui and Date23). Although the validity of the DHQ appears reasonable with regard to commonly studied nutritional factors(Reference Sasaki, Yanagibori and Amano20–Reference Murakami, Sasaki, Takahashi, Okubo, Hirota, Notsu, Fukui and Date23), the DHQ is not designed specifically to measure monetary diet cost, as with other studies on this topic(Reference Maillot, Darmon, Vieux and Drewnowski4–Reference Darmon, Briend and Drewnowski11). Additionally, food prices were derived from the National Retail Price Survey(25) and websites of nationally distributed supermarket and fast-food restaurant chains. As this procedure provides only an approximation of actual diet costs, the results of the present study should be interpreted with caution. We note, however, that a similar methodology (relying on retail food prices as well as self-reported dietary intake information) has been used in all previous observational studies(Reference Maillot, Darmon, Vieux and Drewnowski4–Reference Darmon, Briend and Drewnowski11).
In the present study, a single 24 h urine sample was used, which is not optimal for characterizing individual habitual dietary intake and introduces random errors(Reference Bingham33). Nevertheless, errors in 24 h urine and hence biomarker-based estimates of nutrient intake are thought to be independent of those in self-reported dietary intake (and retail food prices) and hence monetary costs of self-reported diet. This is an important and unique methodological characteristic of the present study, because in all previous studies on this topic (where both monetary diet costs and dietary intake are estimated based on self-reported dietary behaviour obtained by the same dietary assessment method)(Reference Maillot, Darmon, Vieux and Drewnowski4–Reference Darmon, Briend and Drewnowski11), errors in self-reported dietary behaviour are shared by monetary diet cost and dietary intake.
Additionally, concern has been expressed regarding the precision of the correction factors used to estimate dietary intake from 24 h urine. Many variables may influence the percentage of ingested protein (N), K and Na excreted in urine, including the absolute level of dietary intake, the season during which the balance study is conducted, race and cooking method(Reference Zhang, Temme, Sasaki and Kesteloot34). Here, we used correction factors determined in carefully designed balance studies(Reference Bingham and Cummings12–Reference Hunter16), but the use of other correction factors should have little influence on the observed associations between dietary cost and intake. Nevertheless, estimates of biomarker-based nutrient intake themselves should be interpreted with caution, as they are largely dependent on the correction factors used.
Because energy expenditure was estimated by using physical activity level value for light activity, assuming a predominantly sedentary lifestyle in this population at the group level, energy expenditure of some subjects may have been underestimated(Reference Murakami, Sasaki, Takahashi and Uenishi18). However, because no significant difference in physical activity was seen among quintile categories of monetary diet cost (data not shown), it is unlikely that the use of physical activity level value for light activity for all subjects had any major impact on the observed associations between dietary cost and intake, notwithstanding that energy-adjusted biomarker-based estimates of nutrient intake may be on average overestimated.
Finally, several(Reference Goulet, Lamarche and Lemieux35–Reference Mitchell, Shannon, McKenzie, Smiciklas-Wright, Miller and Tershakovec39) although not all(Reference Stender, Skovby, Haraldsdottir, Andresen, Michaelsen, Nielsen and Ygil40) intervention studies have reported that nutrient-dense diets consumed as a result of nutrition interventions were not more expensive than lower-quality diets. These intervention studies provided individual instructions on how to identify nutritious low-cost foods, how and where to make food purchases, and how to store and prepare the foods, possibly facilitating the consumption of a healthier diet at lower cost. The observational nature of the present study did not allow us to investigate directly if the cost of diet changed after nutritional intervention.
In conclusion, the current preliminary study of young Japanese women showed that total monetary costs of self-reported diet were positively associated with biomarker-based estimates of protein, K and Na intake, and appeared largely due to the monetary costs of vegetables and fish. Contrary to the common public health belief that a healthy diet costs more, spending more money for foods may not necessarily ensure healthier diets, at least among young Japanese women. The association of monetary diet costs with dietary intake is an important public health topic, but information based on using objective measures of dietary intake is not available except for the present study. Thus, further research using objective biomarkers of dietary intake, such as serum carotenoid and fatty acid concentrations, would be of interest.
Acknowledgements
This work was supported by grants from the Ministry of Health, Labour, and Welfare, Japan. None of the authors has any conflict of interest to declare. K.M. contributed to the concept and design of the study, the study protocol, data collection and management; coordinated the fieldwork; formulated the hypothesis; analysed and interpreted the data; and wrote the manuscript. S.S. (a principal researcher of this project) contributed to the concept and design of the study, the study protocol, data collection and management, the writing and editing of the manuscript; and formulated the hypothesis. Y.T. and K.U. contributed to the concept and design of the study, the study protocol and data collection. All authors contributed to the preparation of the manuscript and approved the final version submitted for publication. The authors thank Keika Mine, Yoko Hosoi, Mami Itabashi, Tomono Yahata, Asako Ishiwaki and Kyoko Saito (National Institute of Health and Nutrition) for data collection.


