


Obesity is a disease characterised by the accumulation of excess fat mass relative to total body mass(Reference Pate, O’Neill and Liese1). Its origin is multifaceted and complex with long-term energy imbalance, genetics, lifestyle and environmental factors all contributing to its development(Reference Jebb, Kopelman and Butland2). Evidence from across the globe demonstrates a stark rise in the prevalence of overweight and obesity amongst children and adolescents from just 4 % in 1975 to 18 % in 2016(Reference Abarca-Gómez, Abdeen and Hamid3). Overweight and obesity rates in Irish children also illustrated a rise between 1990 and 2005(Reference Perry, Whelton and Harrington4,Reference O’Neill, McCarthy and Burke5) . However, more recently, a systematic review identified a premise that overweight and obesity levels may be plateauing within Irish children; however, higher levels are still evident in girls and in children from a lower socio-economic background(Reference Keane, Kearney and Perry6).
The consequences of childhood overweight and obesity are wide-ranging and can result in immediate health consequences, including obstructive sleep apnoea, hypertension and low self-esteem(Reference Andersen, Holm and Homøe7–Reference Gibson, Allen and Davis9). In addition, children and adolescents with obesity are five times more likely to carry this disorder into adulthood than individuals without obesity(Reference Simmonds, Llewellyn and Owen10). Thus, children with overweight/obesity are at risk of the long-term health consequences of retaining a high BMI into adult life including an elevated risk of adult morbidities such as type 2 diabetes, coronary heart disease and certain cancers(Reference Reilly and Kelly11,Reference Llewellyn, Simmonds and Owen12) . This in turn is associated with a huge economic burden; in the Republic of Ireland, the total lifetime cost of childhood overweight and obesity was recently estimated to be €4·6 billion with 21 % attributed to direct health care costs and 79 % from indirect total lifetime costs, including absenteeism, lifetime income losses and premature mortality(Reference Perry, Millar and Balanda13).
Different anthropometric techniques are used to establish overweight and obesity levels in children. BMI (kg/m2), (through the calculation of population age- and gender-specific z-scores and percentiles) persists as the most commonly applied method due to its convenience(Reference Cole and Lobstein14,Reference Cole, Freeman and Preece15) . Other methods focus on measuring abdominal overweight and obesity considering its association with an increased prevalence of cardiometabolic disorders(Reference Kelishadi, Mirmoghtadaee and Najafi16). Both waist circumference (WC) and waist-height ratio (WHtR) are strongly correlated with abdominal fat and have been used as indicators of abdominal overweight and obesity in children(Reference Savva, Tornaritis and Savva17). The lack of consensus around the use of BMI-derived or WC-derived cut-off’s to establish overweight and obesity levels in children makes comparison across studies and populations problematic, and often different rates of overweight and obesity are reported within the same population(Reference Rolland-Cachera18).
The Childhood Obesity Surveillance Initiative (COSI) monitors overweight and obesity levels in children living in Ireland using the International Obesity Taskforce (IOTF) cut-offs, with current data highlighting that girls and children from a lower social class are more susceptible to this disease. In order to add to population data and augment funding for research programmes and policies to tackle the problem of obesity, the continued collection of objective data to monitor childhood weight status is required(19). The primary objective of these analyses was to provide an update on the height, weight, BMI, WC, hip circumference (HC) and WHtR in Irish children aged between 5 and 12 years, by gender and social class group using data collected during the second National Children’s Food Survey (NCFSII 2019). The second objective was to indicate, using various published cut-offs, BMI-derived weight status and abdominal overweight and obesity levels. Lastly, to compare these most recent figures with previously collected anthropometric data from the Irish National Nutrition Survey 1990 (INNS 1990) and The National Children’s Food Survey (NCFS 2005).
Materials and methods
Study design and participants
Data for this analysis were derived from the INNS 1990, NCFS 2005 and NCFSII 2019. Each of these dietary surveys encompassed a national sample of Irish children and obtained anthropometric measurements from children through adherence to a similar protocol, thus providing the basis for comparison of these databases. The INNS 1990 was a cross-sectional and nationally representative survey conducted in 1990 in the Republic of Ireland in which 148 Irish children aged 8–12 years were recruited from primary schools selected with probability proportionate to size and stratified by county(Reference Lee and Cunningham20). The NCFS 2005 was a cross-sectional food consumption survey carried out in the Republic of Ireland between 2003 and 2004 in a nationally representative sample of 594 Irish children aged 5–12 years(21). NCFSII 2019 was a cross-sectional food consumption survey carried out between 2017 and 2018 in the Republic of Ireland in a national sample of 600 children aged 5–12 years (boys: n 300; girls: n 300). In brief, the sample was representative of the Irish population with respect to age, gender and urban/rural location compared with the 2016 Irish census(22). However, the cohort did contain a higher proportion of children of professional workers and a lower proportion of children of semi-skilled and unskilled workers than the national population. Therefore, to adjust for these differences, a statistical weighting factor was applied which accounted for the underrepresentation of children from the lower social class groups in 2019. Primary schools were selected from databases acquired from The Department of Education and Skills for both the NCFS 2005 and NCFSII 2019. School selection was stratified by location, urban/rural, gender, size of the school and whether or not the school was classified as disadvantaged. Children were randomly selected from the school roll to receive a participant information pack; if interested in participating, a fieldworker contacted the parent/guardian of the child to explain the survey in detail and organise the initial appointment. At this appointment, written consent was obtained from the child’s parent/guardian in accordance with the declaration of Helsinki(23). In the case of each survey, ethical approval was obtained as suitable. The response rates for the INNS 1990, NCFS 2005 and NCFS 2019 were 68, 63 and 65 %, respectively. In the current analyses, anthropometric data from 596 children from the NCFSII 2019, 594 children from NCFS 2005 and 148 children from INNS 1990 were included.
Anthropometric measurements
In all three surveys, anthropometric measurements were carried out by trained researchers (qualified dietitian or nutritionists) using standardised techniques. Height, weight, WC and HC were measured. Children were measured in light clothing, barefoot, with pockets emptied and after voiding. All weighing scales were calibrated and placed on a hard level surface. No allowance was made for the weight of clothing. The INNS 1990 recorded weight in duplicate using a Soèhnle digital personal weighing scales and height using a folding stadiometer to the nearest 0·1 kg/0·1 cm (CMS Weighing Equipment, Ltd). The NCFS 2005 recorded weight in duplicate using a Seca 770 digital personal weighing scale (Chasmores Ltd) and height using the Leicester portable height measure to the nearest 0·1 kg/0·1 cm (Chasmores Ltd). For NCFSII 2019, weight was taken in duplicate using a Tanita Body Composition Analyser BC-420MA (Tanita, Ltd, GB), to the nearest 0·1 kg. Height was measured to the nearest 0·1 cm using The Leicester Height Measure (Seca) stadiometer. In all surveys, children were asked to stand in an upright position with his/her back to the backboard of the stadiometer. Their heels and buttocks were touching the backboard of the stadiometer, with their feet together, and the child’s head positioned in the Frankfurt Plane. WC was measured in duplicate using a Seca 201 tape measure (Seca) in both NCFS 2005 and NCFSII 2019. Measurements were taken on the bare skin, with the child in a standing position. The fieldworker identified the top of the child’s iliac crest and the bottom of the child’s rib cage. The measurement was taken at the halfway point between these two sites. The measurement was recorded to the closest 0·1 cm. HC was measured in a similar manner to WC as only measurements were taken across the widest part of the buttocks and over light clothing.
Defining weight status
For the purpose of this analyses, three methods were utilised to determine BMI-derived weight status for data from 1990, 2005 and 2019: the IOTF age- and gender-specific BMI cut-offs, the UK90 BMI reference curves and the WHO growth reference, with morbid obesity defined using the IOTF and the UK90 cut-offs(Reference Cole and Lobstein14,Reference Cole, Freeman and Preece15,Reference de Onis, Onyango and Borghi24) . Two methods were also used to establish abdominal overweight/obesity; this was computed using data from 2005 and 2019 only as WC was not measured in 1990. Children who had a WC ≥ 85th percentile were classified with abdominal overweight status, whilst ≥95th percentile indicated abdominal obesity(Reference McCarthy, Jarrett and Crawley25). Additionally, WHtR was computed for the 2005 and 2019 cohorts, with abdominal overweight/obesity classified as a ratio of ≥0·50(Reference Browning, Hsieh and Ashwell26). The LMS growth Microsoft Excel Add-in was used to calculate age- and gender-adjusted z-scores and percentiles from a reference population for each method for BMI and WC based on the LMS method(Reference Pan and Cole27).
Social class
Social class was assessed through the use of a questionnaire where parents/guardians of children gave details of their employment status. A code based on the occupational description was then allocated to children which coincided with the defined social class groups based on the Irish Census 2016: professional, managerial and technical workers, non-manual workers, skilled manual workers and semi-skilled and unskilled workers (including students)(22). In cases where more than one occupation was provided resulting in two different social class codes, the participant was allocated to the higher social class group.
Statistical analysis
Statistical analysis was performed utilising IBM SPSS statistics software package version 24. Mean, standard deviation and median values were calculated for height, weight, BMI, WC, HC and WHtR for data obtained throughout NCFSII 2019. In order to assess if significant changes had occurred in anthropometric measurements over time, a multivariate general linear model adjusted for age and gender (where applicable) was completed with Holm’s sequential Bonferroni post hoc test which is used to adjust for multiple comparisons. This was utilised to determine if any statistically significant changes in age-adjusted mean height, weight and BMI had occurred across the three time points, from 1990 to 2005 and 2019. Whilst changes in age-adjusted mean WC, HC and WHtR were examined between 2005 and 2019 only (due to lack of data on WC, HC and WHtR from 1990). The χ 2 test was used to examine if the percentage of children with BMI- and WC-derived overweight and obesity differed over time and to establish differences in overweight and obesity prevalence based on social class. Significance across all tests was defined as P < 0·05.
Results
No significant difference in gender was apparent between surveys; in INNS 1990, 43 % of children were girls compared with 51 % in NCFS 2005 and 50 % in NCFSII 2019 (P = 0·21). The age profile of children differed between surveys; the INNS 1990 had an older cohort with a mean age of 10·4 years (±1·2) in comparison with NCFS 2005 and NCFSII 2019 in which both had a mean age of 9·0 years (±2·3) (P ≤ 0·001). Table 1 displays the mean, standard deviation and median values of the anthropometric measurements including: height, weight, BMI, WC, HC and WHtR; of Irish children aged 5–12 years who participated in NCFSII 2019, no significant differences in gender were apparent for any of the parameters.
Table 1 Anthropometric measurements of Irish children in 2019 for the total population, boys and girls

NCFS, National Children’s Food Survey; n, sample number; sd, standard deviation; kg, kilograms; cm, centimetres; BMI, body mass index; kg/m2, kilograms divided by metres squared; WC, waist circumference; HC, hip circumference; WHtR, waist:height ratio.
P value represents the results of an independent samples t test to examine differences in anthropometric measurements between genders with P < 0·05 signifying a significant difference between boys and girls.
The age-adjusted mean, standard error and 95 % CI for weight, height and BMI of Irish children measured in 1990, 2005 and 2019 are presented in Table 2. Children in 2019 were significantly heavier (3·0 kg) and taller (2·3 cm) in comparison with 1990, with no significant differences observed between 2019 and 2005. The BMI of children in 2019 was significantly lower than that observed in 2005 (–0·6 kg/m2), whilst no significant difference in BMI was evident between 1990 and 2019. In 2019, boys were significantly heavier than those in 1990 (2·6 kg), but not in 2005. In contrast, no significant difference in height was observed across the three time points for boys. In comparison with 1990, the BMI of boys was significantly higher in 2005 (0·8 kg/m2); however, no significant difference was observed in BMI between 2019 and 2005 or 2019 and 1990. Similar to what was found for boys, no significant difference in the weight of girls was observed between 2005 and 2019, although in 2019 girls were significantly heavier than girls in 1990 (3·4 kg). In addition, girls in 2019 were significantly taller than those in 1990 (3 cm), but not in comparison with those in 2005. The BMI of girls was significantly lower in 2019 in comparison with 2005 (–0·9 kg/m2); however, no significant difference in the BMI of girls was observed between 2019 and 1990. The age-adjusted mean, standard error and 95 % CI for the WC, HC and WHtR of Irish children measured in 2005 and 2019 are also presented in Table 2. In 2019, children had a significantly lower WC (–3·3 cm), HC (–2·2 cm) and WHtR of (–0·02) in comparison with 2005. This change in WC, HC and WHtR remained significant in both genders, although the difference was greater in girls than boys.
Table 2 Anthropometric measurements of children in Ireland in 1990, 2005 and 2019 split by gender
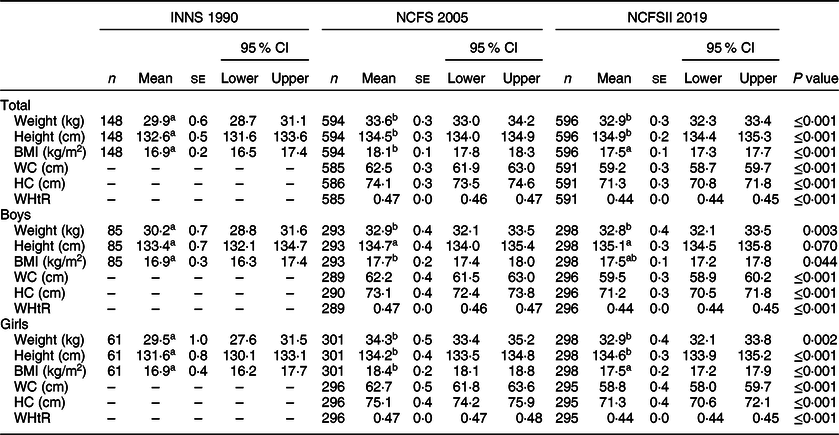
INNS, Irish National Nutrition Survey; NCFS, National Children’s Food Survey; n, sample number; se, standard error; 95% CI, 95% confidence interval; kg, kilograms; cm, centimetres; BMI, body mass index; kg/m2, kilograms divided by metres squared; WC, waist circumference; HC, hip circumference; WHtR, waist:height ratio.
abMean values within a row with unlike superscript letters were significantly different (P < 0·05); general linear model comparing weight, height and BMI between 1990, 2005 and 2019, and WC, HC and WHtR between 2005 and 2019 with Holms sequential Bonferroni post hoc test used to adjust for multiple comparisons, models were adjusted for age (all groups) and gender (total group only).
The prevalence of normal weight (including underweight), overweight, obesity and morbid obesity in Irish children in 1990, 2005 and 2019 is shown in Table 3. The highest prevalence of overweight and obesity was found through the application of the WHO growth reference, whereas the IOTF and UK90 methods yielded lower rates. Only the IOTF cut-off results will be discussed here as this is the most comparable method with other research in Ireland and internationally. A significantly lower proportion of Irish children had overweight or obesity in 2019 in comparison with 2005; in 2005, 24·6 % of children had overweight or obesity in comparison with 16·4 % in 2019, which was higher than the 12·2 % of children who had overweight or obesity in 1990. In 2019, less boys has overweight or obesity in comparison with 2005 (13·9 v. 18·8 %), whereas more boys had overweight or obesity in 2005 in comparison with 1990 (18·8 v. 9·5 %), although these differences were not significant. Conversely, a higher proportion of Irish girls had overweight or obesity in 2005 in comparison with 1990 (30·2 v. 15·9 %), whilst a significantly lower level of overweight and obesity was observed in girls in 2019 in comparison with 2005 (19·2 v. 30·2 %). With respect to morbid obesity, a higher level was observed in 2019 in comparison with 1990 (1·2 v. 0·7 %), with a marginal difference observed between 2005 and 2019 (1·5 v. 1·2 %).
Table 3 Weight status of Irish children in 1990, 2005 and 2019 as defined by the International Obesity Taskforce (IOTF), UK90 and WHO cut-offs

INNS 1990, Irish Naitonal Nutrition Survey 1990; NCFS, National Children’s Food Survey; %, percentage; N, normal weight; OW, overweight; OB, obese; M OB, morbidly obese; IOTF, International Obesity Taskforce cut-off’s; UK 90, British 1990 child growth reference; WHO, World Health Organisation growth reference.
χ2 used to examine if changes occurred in overweight and obesity levels between 1990, 2005 and 2019 where P < 0·05 denotes statistically significant changes over time. Prevalence of underweight included in normal weight category.
Figure 1 illustrates the proportion of Irish children who had overweight or obesity based on their social class group in 2019. A significant difference in overweight/obesity levels based on social class group was apparent (P = 0·02). Those from the highest social class had the lowest overall prevalence of overweight/obesity at 13 %, in comparison with those from the lowest social class who had the highest prevalence at 25 %. The same pattern was observed for abdominal overweight/obesity as the proportion of children with a WC ≥ 85th percentile was significantly higher in the lowest social class group at 36 % in comparison with 20 % in the highest social class group (P = 0·006).
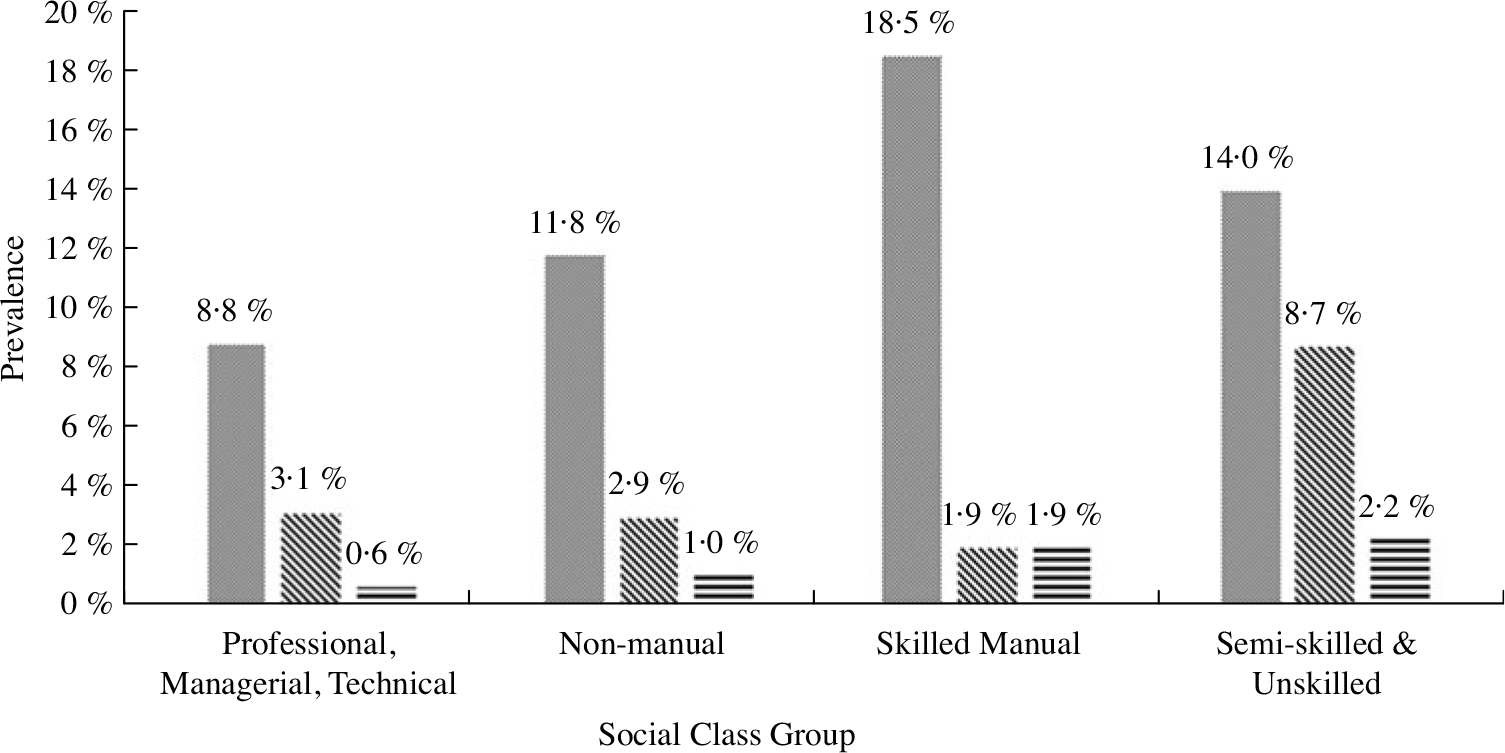
Fig. 1 Prevalence of overweight, obesity and morbid obesity in children based on social class group in second National Children’s Food Survey 2019 as defined by the International Obesity Taskforce cut-offs. Social class groups based on the Irish Census. The difference in overweight, obesity and morbidity prevalence across social class groups was assessed by χ 2 test with a statistically significant difference found between groups at P < 0·05. ![]() , Overweight;
, Overweight; ![]() , obese;
, obese; ![]() , morbidly obese
, morbidly obese
The proportion of boys and girls classified as having abdominal overweight/obesity based on their WC and WHtR measurements is displayed in Figure 2(a) and (b). In 2005, a higher percentage of girls had a WC ≥ 85th percentile than boys (51 v. 42 %); however, in 2019, the difference was less apparent with 24 % of boys having a WC ≥ 85th percentile v. 28 % of girls. Similarly, a higher percentage of girls had a WHtR ≥ 0·5 in 2005 in comparison with boys (30 v. 19 %); however, in 2019, this difference was no longer apparent (both 11 %).
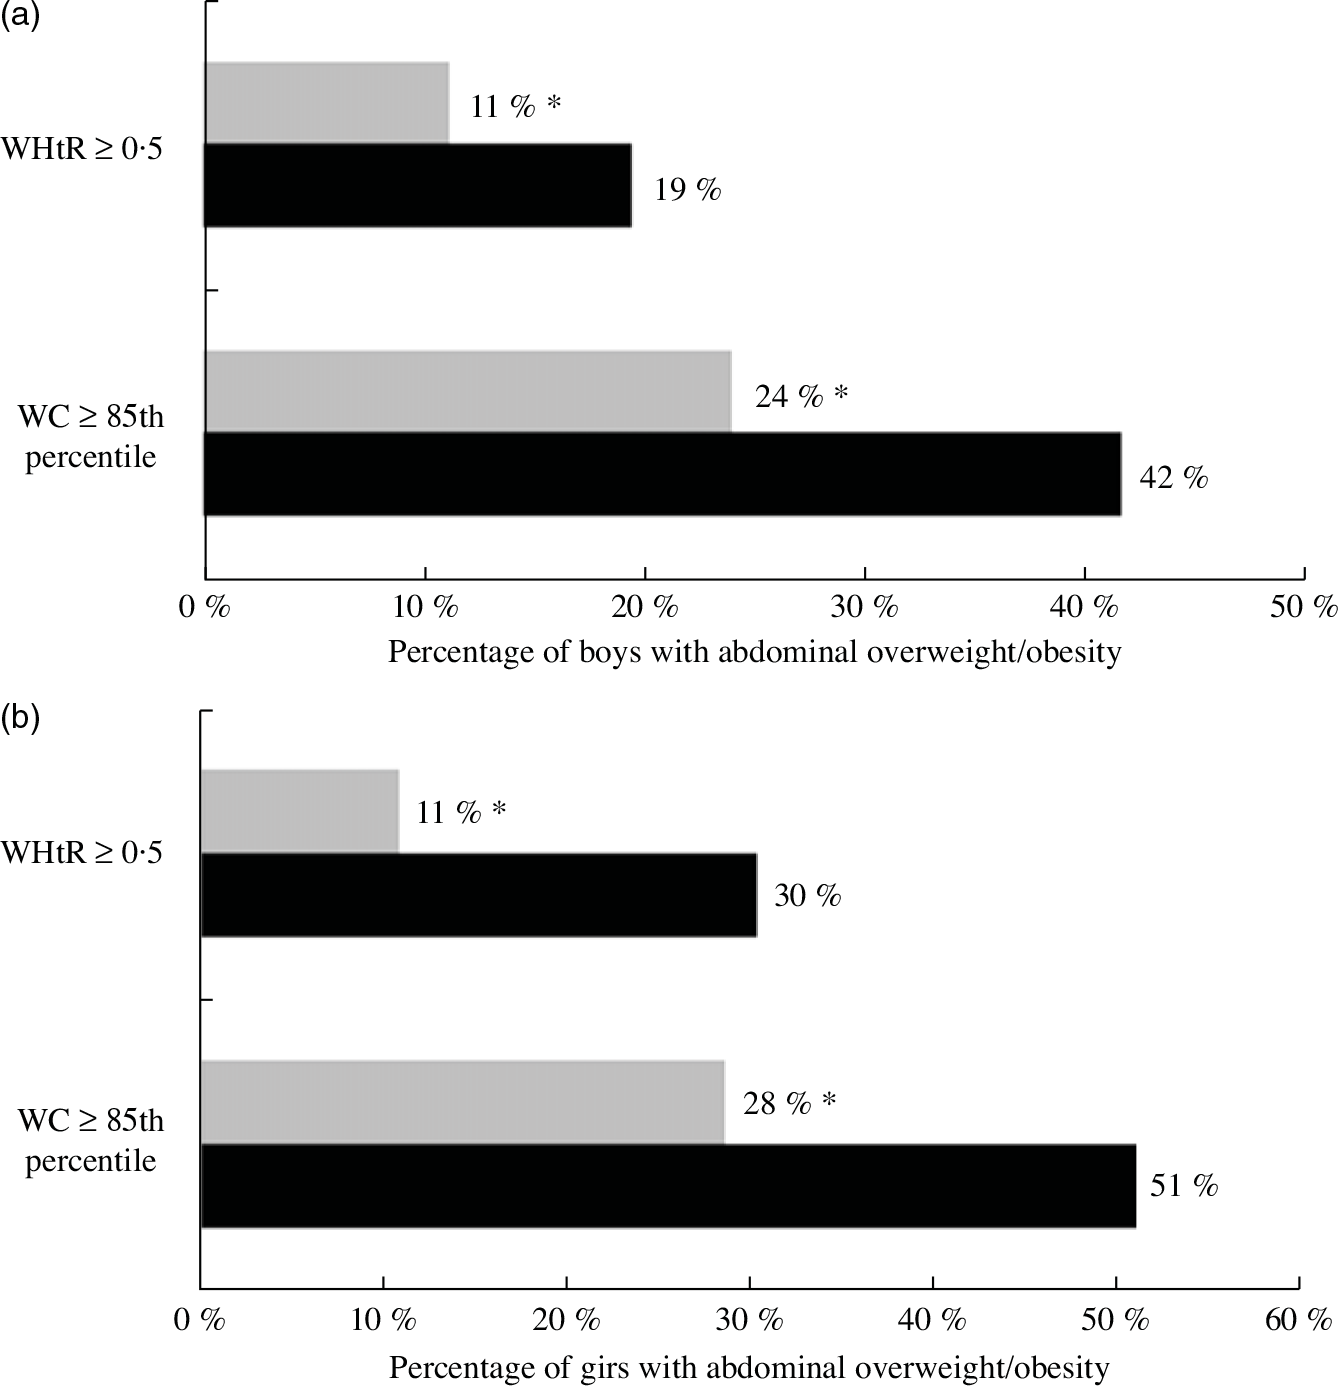
Fig. 2 Prevalence of abdominal overweight and obesity in boys (a) and girls (b) in 2005 and 2019. WHtR, waist-height ratio at risk ≥0·50, not at risk <0·50. Waist circumference (WC) ≥ 85th percentile, WC ≥ 85th percentile. The change in abdominal overweight and obesity levels across time points was assessed by χ 2 test with statistical significance denoted by * at P < 0·05. ![]() , 2019;
, 2019; ![]() , 2005
, 2005
Discussion
Overall, these findings demonstrate that the prevalence of overweight and obesity in Irish children differed across all three time points. In 1990, 12·2 % of Irish children had overweight or obesity; however, in 2005, a much higher prevalence was observed at 24·6 %. In contrast to this, a significantly lower level of overweight and obesity was observed in 2019 at 16·4 % in comparison with 2005. Furthermore, in 2019, overweight and obesity were more prevalent in girls at 19 % than boys at 14 % and a significantly lower level of overweight and obesity was found in 2019 in comparison with 2005 in girls but not boys. Differences in overweight and obesity prevalence were evident based on social class, with higher levels observed in children from the lowest social class group in comparison with those from the highest social class group. In addition, significantly less Irish children had abdominal overweight/obesity in 2019 in contrast to 2005, with this decline being greater in girls than in boys.
The levels of overweight and obesity in this population are comparable with other reported levels in Irish children and internationally. Ongoing monitoring of overweight and obesity levels in Irish primary school-aged children has been carried out as part of the World Health Organizations COSI since 2008. Recent findings based on the IOTF cut-offs reported rates of overweight and obesity ranging from 17 to 20 % in 2015(Reference Bel-Serrat, Heinen and Murrin28). Growing Up in Ireland (GUI) is a national longitudinal study of 9-year-old children in Ireland which examines weight status using the IOTF protocol. In the most recent findings from the GUI study, a higher rate of overweight was reported in comparison with the current study at 17 % with the same level of obesity at 5 %(29). Although overweight and obesity rates in children living in Ireland are still elevated and urgently need to be addressed, much higher rates of overweight and obesity have been reported in the USA in children aged 2–19 years at 35 %(Reference Fryar, Carroll and Ogden30). Likewise in England, 14 % of children aged from 4 to 11 years have overweight status with a further 15 % having obesity(31). In the current analysis, the IOTF cut-offs were used as these were developed to standardise international measurement and intercountry comparisons; however, it must be noted that both the USA and England have their own reference criteria for defining BMI-derived overweight and obesity levels which can lead to differences in prevalence rates between countries(Reference Cole, Freeman and Preece15,Reference Kuczmarski, Ogden and Grummer-Strawn32) .
In 2019, a gender difference in overweight and obesity rates was apparent in the current analysis, as a higher proportion of girls had overweight/obesity at 19 % compared with boys at 14 %. A systematic review examined the prevalence of overweight and obesity in children living in Ireland between 2002 and 2012 and noted that girls consistently had higher rates of overweight and obesity than boys(Reference Keane, Kearney and Perry6). Similar differences were observed in the COSI for 7 year olds in 2015, as only 13 % of boys had overweight/obesity in contrast to 20 % of girls with similar observations found in the GUI study(Reference Bel-Serrat, Heinen and Murrin28,29,33) . Contrastingly, in the USA, 6–11-year-old boys had a 4 % higher rate of obesity in comparison with girls(Reference Fryar, Carroll and Ogden30). Moreover, in line with the USA, evidence from across European countries, such as Bulgaria, Croatia, France and Romania amongst others, showed higher rates of obesity in boys than girls(34). Results reported here support the evidence that girls in Ireland have higher rates of overweight/obesity than boys.
Health inequalities resulting from social class have been labelled as one of the main drivers of the obesity epidemic(Reference Loring and Robertson35). Prevalence of overweight and obesity in children in Ireland was starkly different based on social class in 2019. Levels rose steadily from 13 % in children from the highest social class group to 25 % in those from the lowest, with a comparable pattern observed for abdominal overweight/obesity. Similarly, it has been reported that a higher proportion of children attending disadvantaged schools had overweight/obesity compared with those attending non-disadvantaged schools(Reference Bel-Serrat, Heinen and Mehegan36). Furthermore, inequalities in overweight/obesity prevalence have also been described in American and British children(Reference Bann, Johnson and Li37,Reference Ogden, Lamb and Carroll38) . These findings highlight the continued widening gap in overweight and obesity levels based on social class in children, with those from a lower social class being more predisposed to this disease.
In comparison with overweight and obesity, children with morbid obesity are three times more likely to experience immediate health issues such as worsened cardiometabolic risk profiles, high blood pressure, and suffer from depression and anxiety(Reference Skinner, Perrin and Moss39–Reference Rank, Siegrist and Wilks42). In 2019, 1·2 % of children had morbid obesity, with a slightly higher level of morbid obesity observed in boys at 1·7 % than girls at 0·7 %. Moreover, a higher prevalence was observed in children from a low socio-economic background. A similar level of morbid obesity was found in the COSI at 1·5 % in 2012/2015 with higher rates occurring in children attending disadvantaged schools(Reference Bel-Serrat, Heinen and O‘Malley43). Across Europe, a recent assessment of the prevalence of morbid obesity found that of the children who had obesity, at least one in four had morbid obesity, with the highest rates observed in Southern Europe(Reference Spinelli, Buoncristiano and Kovacs44). In England, higher levels of morbid obesity are evident, as 4 % of children aged 10–11 years were classified as having morbid obesity, and similar to the present analysis, boys had a higher prevalence than girls(31).
A global analysis of overweight and obesity levels showed a dramatic increase in the BMI of children and adolescents living in developing countries within South and East Asia. In contrast, the BMI of children living in many western and high-income countries has stabilised in the past two decades(Reference Abarca-Gómez, Abdeen and Hamid3). In line with this, since the early 2000’s, a non-significant plateauing trend for overweight and a significant declining trend in obesity rates were identified in Irish children, an observation which is supported by the findings of the current study(Reference Keane, Kearney and Perry6). Similar to what has been found in Canada, some European countries have either reported a significant decrease in the prevalence of childhood overweight and obesity (Greece, Italy, Portugal and Slovenia) or have seen a stabilisation in rates (Belgium, Czechia, Great Britain and Norway). In contrast, other European countries such as Latvia, Bulgaria and Lithuania have seen the opposite effect with an increase in childhood obesity rates occurring which is also the case in the USA(Reference Fryar, Carroll and Ogden30,34,Reference Rao, Kropac and Do45–Reference Bailey, Humphreys and May48) .
WC and WHtR measurements offer a benefit over BMI as they provide relevant information about fat distribution and reflect the degree of abdominal overweight/obesity. Compared with BMI-derived overweight and obesity, abdominal overweight/obesity is more strongly linked to metabolic diseases and CVD risk(Reference Kelishadi, Mirmoghtadaee and Najafi16,Reference Savva, Tornaritis and Savva17) . Irrespective of the method used to calculate it, a lower level of abdominal overweight/obesity was observed in 2005 in comparison with 2019, with the greatest difference observed in girls at 44 %. Between 2008 and 2015, a reduction in abdominal overweight/obesity in the COSI was also noted(Reference Heinen, Concannon and Farrell49). Similarly, in the USA, a marginal decrease in abdominal overweight/obesity levels occurred between 2003/2004 and 2011/2012 in 6–11 year olds(Reference Xi, Mi and Zhao50). Ongoing monitoring of WC in children is necessary to establish if these observed modest declines continue.
The Joint Committee on Children and Youth Affairs in Ireland recently described childhood overweight and obesity as the ‘most urgent health concern facing policymakers, parents/guardians, teachers and children’ and emphasised the need for a whole-system, collaborative approach to confront this challenge(51). Recent efforts have focused on reducing overweight and obesity levels by 2025(52). To date, interventions have included the following initiatives: the introduction of a levy on sugar-sweetened beverages in 2019; public health campaigns; the introduction of a National Physical Activity Plan and the implementation of school-based interventions to promote healthy lifestyle behaviours in primary school-aged children. Considering the findings of this and other similar studies, it could be speculated that such interventions may be assisting in the stabilisation and reduction of overweight and obesity levels in children in Ireland. Despite this as suggested by Keane et al.(Reference Keane, Kearney and Perry6), the increased attention and media scrutiny around obesity may have led to a disincentive for children with overweight and obesity and their parents to participate in such studies which examine weight status due to the associated stigma, and thus this may also have played a role in contributing to the observed stabilisation/reduction in rates. Nonetheless, continued monitoring of overweight and obesity rates is essential in order to evaluate the impact of changes to public health policy and public health promotion campaigns.
This study has many strengths such as the comprehensive anthropometric data collected and the methodological similarities between INNS 1990, NCFS 2005 and NCFSII 2019 allowing for direct comparison between data across these time points. The assessment of BMI, WC and WHtR-derived overweight and obesity also provides robust information on the proportion of children in Ireland who are at risk of the associated comorbidities of obesity. The limitations should be acknowledged such as the low representation of children from lower social class groups; however, a statistical weighting factor was applied in order to make the sample representative of the Irish population. Additionally, the cross-sectional nature of the data included here is a further limitation of this analysis.
In conclusion, this study adds to the evidence that the proportion of Irish children with overweight and obesity appears to be stabilising and was lower in 2019 in comparison with 2005. Findings would encourage in particular the inclusion of children from a lower social class and girls in interventions to further reduce rates of overweight and obesity. Additionally, in order to gain greater insight into the issue of overweight and obesity in children, a more in-depth understanding of the contributors to this disease such as diet, lifestyle and environmental factors in specific populations is imperative, in order to successfully prevent and reduce the occurrence of obesity in our youth.
Acknowledgements
Acknowledgements: The authors wish to acknowledge Eoin O’Connell for his advice on the statistical procedures carried out in this analysis. Financial support: This study was funded by the Irish Department of Agriculture Food and the Marine under the project ‘National Children’s Food Consumption Survey II’ (15/F/673). Conflicts of interest: The authors have no conflicts of interest to declare. Authorship: B.M.N., A.F., A.N., J.K. and J.W. contributed to the design and implementation of the study and are principal investigators on the project. M.B., L.K. and A.O’D. were involved in subject recruitment and data collection. A.O’D. and B.M.N. were involved in data analysis and illustrated the manuscript. All authors reviewed and approved the final manuscript. Ethics of human subject participation: This study was conducted according to the guidelines laid down in the Declaration of Helsinki, and all procedures involving study participants were approved as follows; for the INNS 1990, ethics was granted by the Irish Department of Health, whilst in the case of the NCFS 2005, ethics was approved by the Federated Dublin Voluntary Hospitals and St James’ Hospital Joint Research Ethics Committee. The NCFSII 2019 ethics approval was obtained from the University College Cork Clinical Research Ethics Committee of the Cork Teaching Hospitals and the Human Ethics Research Committee of University College Dublin {ECM 4 (aa 07 February 2017)}. Written consent was obtained from all childrens’ parents/guardians.


