Premature deaths from non-communicable diseases such as CVD, diabetes and cancer are largely preventable by a healthy lifestyle, with good dietary patterns being a key factor( 1 – 4 ). Globally, more than 36 million people die every year from non-communicable diseases, including more than 14 million aged between 30 and 70 years, contributing substantially to increased health-care costs and premature mortality( 1 , Reference Robertson, Tirado and Lobstein 5 , 6 ).
There has been a declining trend in CVD morbidity and mortality in high-income countries over the past four decades( Reference Yeh, Sidney and Chandra 7 – Reference Yusuf, Rangarajan and Teo 9 ). In Sweden, the decrease in mortality from CVD has been the major reason for an increase in life expectancy in recent decades (10) . High blood pressure, high serum cholesterol and tobacco use, as well as insulin resistance, physical inactivity and obesity, are all modifiable lifestyle risk factors affecting CVD mortality( Reference Beaglehole, Bonita and Horton 11 , 12 ). More than half of the substantial decrease in CHD mortality in Sweden between 1986 and 2002 was attributable to reductions in major risk factors, primarily a large decrease in serum total cholesterolReference Björck, Capewell and O’Flaherty (13) . Unhealthy lifestyle and high cardiovascular risk are associated with low socio-economic status (10) . This inequality of health in the population is a challenge for the health-care system( 14 ).
Obesity has been shown to be a prominent risk factor for several CVD( Reference Frost, Hune and Vestergaard 15 , Reference Rosengren, Aberg and Robertson 16) , and in Sweden there has been a marked increase in the prevalence of overweight and obesity in both men and women nationwideReference Ng, Fleming and Robinson (17) . The recently published report The Nordic Monitoring System 2011–2014 Reference Matthiessen, Andersen and Barbieri (18) , which monitored diet, physical activity and overweight, showed an alarming increase in obesity prevalence among adults in the Nordic countries. The prevalence of obesity in Sweden has been estimated at 14–19 % in men and women aged 20 years or older( 10 , Reference Ng, Fleming and Robinson 17 ). Even though the overall CVD morbidity and mortality and the total CVD risk factor burden have decreased in 50-year-old men and women over the past 50 years( Reference Zhong, Rosengren and Fu 19 , Reference Johansson, Wilhelmsen and Welin 20 ), recent studies indicate that the incidence of CVD is increasing among people under 45 years of age( Reference Barasa, Schaufelberger and Lappas 21 , Reference Giang, Mandalenakis and Nielsen 22 ).
There is currently a large body of evidence directly supporting the importance of good dietary patterns in order to maintain good health (2) . In the INTERGENE study, a healthy cluster was defined by more frequent consumption of high-fibre and low-fat foods, and lower consumption of products rich in fat and sugar. This cluster differed significantly from the others, with a lower prevalence of CVD risk factors, including the metabolic syndromeReference Berg, Lappas and Strandhagen (23) . The Mediterranean dietary pattern is negatively associated with overall mortalityReference Trichopoulou, Orfanos and Norat (24) , CVD, CHD, myocardial infarctionReference Marventano, Grosso and Marranzano (25) , overall cancer incidence and diabetesReference Dinu, Pagliai and Casini (26) . A recent meta-analysis revealed that the protective effects of the diet appear to be most attributable to olive oil, fruits, vegetables and legumesReference Marventano, Grosso and Marranzano (25) . In the Nordic Nutrition Recommendations (NNR), a food pattern rich in fibre and good fat quality is recommended (2) . In the population-based Västerbotten Intervention Programme with more than 15000 participants, dietary changes over 10 years towards lower carbohydrate and higher protein intakes showed that individual changes in line with the NNR resulted in a healthier cardiometabolic risk factor profile at the second visitReference Winkvist, Klingberg and Nilsson (27) .
The proportion of individuals in the Nordic countries with an unhealthy diet increased by more than 20 % from 2011 to 2014, while the proportion with a healthy diet decreasedReference Matthiessen, Andersen and Barbieri (18) . Actions need to be taken towards more effective prevention strategies. In 2012, the Swedish National Board of Health and Welfare published the report National Guidelines for Methods of Preventing Disease, in which health-care personnel are urged to support patients in their efforts to change unhealthy lifestyle habits by five indicators (28) . Our intention was to use these indicators as the basis for development of a screening instrument aimed at screening for the risk of poor dietary pattern in accordance to CVD. The aims of the present study were therefore to: (i) assess the feasibility of a simple new fifteen-item FFQ as a tool for screening risk of poor dietary patterns; and (ii) investigate how the results of this FFQ correlated with cardiovascular risk factors as well as socio-economic factors in a random sample from a healthy middle-aged population.
Methods
Study population
In 2013, a random sample of every fifth man and woman born in 1963 and living in the city of Gothenburg, western Sweden, was selected and invited to a screening examination for cardiovascular risk factorsReference Zhong, Rosengren and Fu (19) . In total, 649 men and 645 women were invited and 313 men (48 % of the sample) and 343 women (53 %) agreed to participate (Fig. 1).
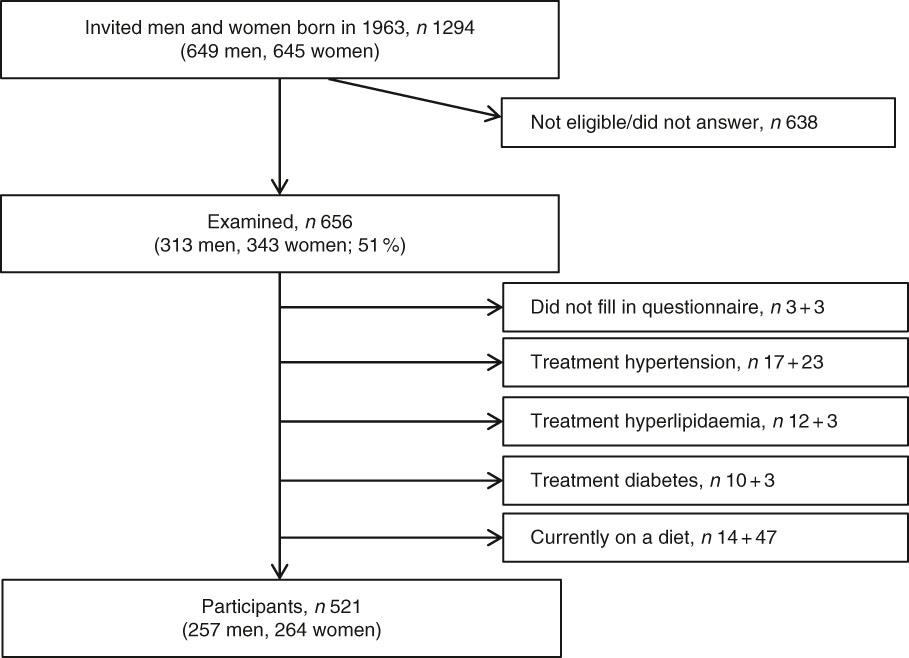
Fig. 1 Flowchart of the study participants
Written informed consent was obtained from all participants and the study protocol was approved by the regional ethical review board at Gothenburg University (DNR 649-13).
Data collection
Most participants were investigated in the morning after an overnight fast, while some (26 % of the men and 31 % of the women) were investigated in the afternoon after at least 4 h of fasting. Both BMI (weight/height2; kg/m2) and waist-to-hip ratio were used as indicators of relative weight and obesity. BMI≥25·0 kg/m2 was defined as overweight and BMI≥30·0 kg/m2 was defined as obesity. Blood pressure was measured once in a sitting position, before venepuncture, and to the nearest 2 mmHg after a 5min rest. Hypertension was diagnosed based on either medical history with current antihypertensive therapy or current blood pressure≥140 mmHg (systolic) or ≥90 mmHg (diastolic). A research nurse drew blood samples from an antecubital vein. Fasting serum cholesterol and serum TAG measurements were performed according to standard laboratory procedures. Fasting serum total cholesterol≥6·0 mmol/l and serum TAG≥1·7 mmol/l were considered elevated values.
Information about smoking habits, leisure-time physical activity, mental stress and level of education were collected using questionnaires. Both current smokers and those who had quit smoking less than a month before the examination were categorized as smokers. A modernized version of the Saltin–Grimby questionnaireReference Saltin and Grimby (29) was used to assess leisure-time physical activity and coded as 1=sedentary (physically inactive), 2=some light physical activity such as walking, riding a bicycle and light gardening for at least 4 h/week, 3=regular moderate physical activity for a minimum of 3 h/week and 4=regular hard physical training for competitive sports. Through a previously validated toolReference Rosengren, Hawken and Ounpuu (30) , mental stress was defined as ‘feeling tense, irritable or filled with anxiety or having sleeping difficulties due to conditions at work or at home’. The question had six response options: 0=‘never experienced stress’, 1=‘one period of stress ever’, 2=‘some periods of stress during the past 5 years’, 3=‘several periods of stress during the past 5 years’, 4=‘permanent stress during the past year’ and 5=‘permanent stress during the past 5 years’. Categories 4 and 5 were regarded as permanent stress. Educational level was measured as ‘the highest level of completed education’ with the response options 1=‘elementary school’, 2=‘vocational school’, 3=‘secondary school’, 4=‘upper secondary school’ and 5=‘university/college’. Education was set as a dichotomous variable: having/not having a university/college education (categories 1–4 v. category 5). Marital status was defined using the question ‘what is your marital status at the moment?’ with the response options being 1=‘unmarried’, 2=‘married/living with partner’, 3=‘widow/widower’, 4=‘divorced/separated’ and 5=‘remarried/living with new partner’, where categories 1, 3 and 4 were defined as living alone. Employment status was measured as 1=‘working full-time’, 2=‘early retirement’, 3=‘retired’, 4=‘part-time early retirement/sick leave’, 5=‘full-time sick leave’, 6=‘unemployed’ and 7=‘other’. Foreign-born was defined as being born outside Sweden.
FFQ
Information on dietary patterns was obtained using a fifteen-item FFQ, based on indicators from the National Food Agency population, and supplemented with additional questions (see online supplementary material). A healthy eating index was created from the answers to the FFQ. The answers to each item were set into a dichotomous variable with the options meets/does not meet the recommendations. We used the NNR (2) to determine which answers met/did not meet the recommendations for a healthy intake of each item. The question regarding having breakfast is not included in the NNR. However, it was added in the present FFQ as breakfast is one of five indicators in the National Board of Health and Welfare’s questions proposed to capture dietary habits that are relevant from a public health point of view and at the same time is easy to answer( Reference Wyatt, Grunwald and Mosca 31 , Reference Wing and Hill 32 ). The criteria for meeting the recommendations are shown in Table 1. Each recommendation that was met received 1 point, resulting in a healthy eating index ranging from 0 to 15 points. From this index, three dietary patterns were defined: good (meets nine or more recommendations), average (meets six to eight recommendations) and poor (meets five or fewer recommendations).
Table 1 Criteria for meeting the Nordic Nutrition Recommendations for each food item

Statistical methods
Means and sd for continuous variables and numbers and percentages for categorical variables are presented. The χ 2 test was performed in order to investigate differences in dietary patterns, lifestyle and socio-economic factors between the three dietary pattern groups. We used multivariate logistic regression models to assess the relationship between dietary patterns and cardiovascular risk factors by OR and 95 % CI. The first model was unadjusted and the second model was adjusted for smoking, permanent stress, sedentary lifestyle and education.
All statistical analyses were performed using statistical software package SAS version 9.4 and R version 3.3.2 (http://www.R-project.org).
Results
Out of 656 participants, six individuals (three men and three women) did not complete the FFQ and sixty-eight were excluded due to known medically treated hypertension, hyperlipidaemia or diabetes. Another sixty-one participants reported ongoing, temporary, special diets and were also excluded, see flowchart in Fig. 1. Thus, the present study includes 521 participants (257 men and 264 women). Anthropometric measurements, blood pressure, serum lipids, lifestyle and demographic factors are summarized in Table 2.
Table 2 Baseline characteristics of risk factors in 50-year-old men and women born in 1963 and living in Gothenburg, Sweden, 2013

Continuous variables are presented as mean and sd; categorical variables are presented as n and %. Differences between men and women were measured using the Wilcoxon rank-sum test for continuous variables and Pearson’s χ 2 test for categorical variables.
† High waist circumference: ≥102 cm for men and ≥88 cm for women.
‡ Hypertension: systolic blood pressure ≥140 mmHg or diastolic blood pressure ≥90 mmHg.
§ Permanent stress as reported by the participant during the last year or up to the last 5 years.
FFQ
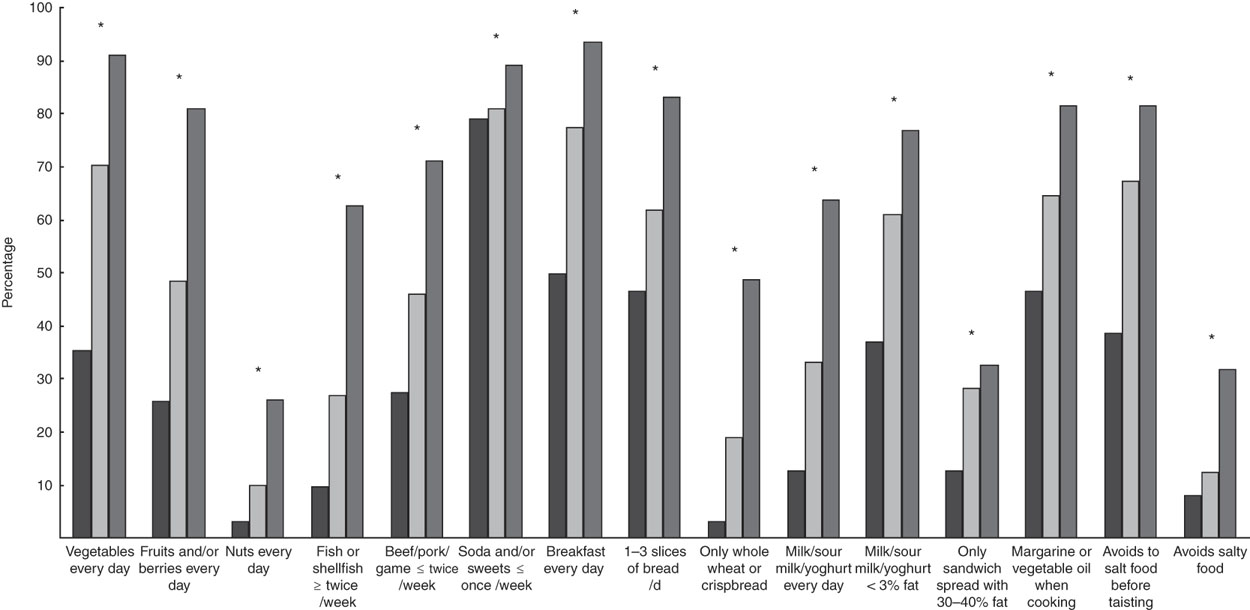
The proportions in each dietary pattern group that met the recommendations for each item in the FFQ are shown in Fig. 2. The median number of recommendations met was 8 (interquartile range 3). Overall, individuals in the poor dietary group met each recommendation to a smaller extent compared with individuals in the average and good dietary pattern groups. The least attained recommendations were daily intake of nuts, choosing sandwich spread with 30–40 % fat and avoidance of salty foods, and the most attained were daily intake of vegetables, having breakfast every day and low consumption of soda and sweets. Pairwise differences between the groups are presented in the online supplementary material, Supplemental Table 1.
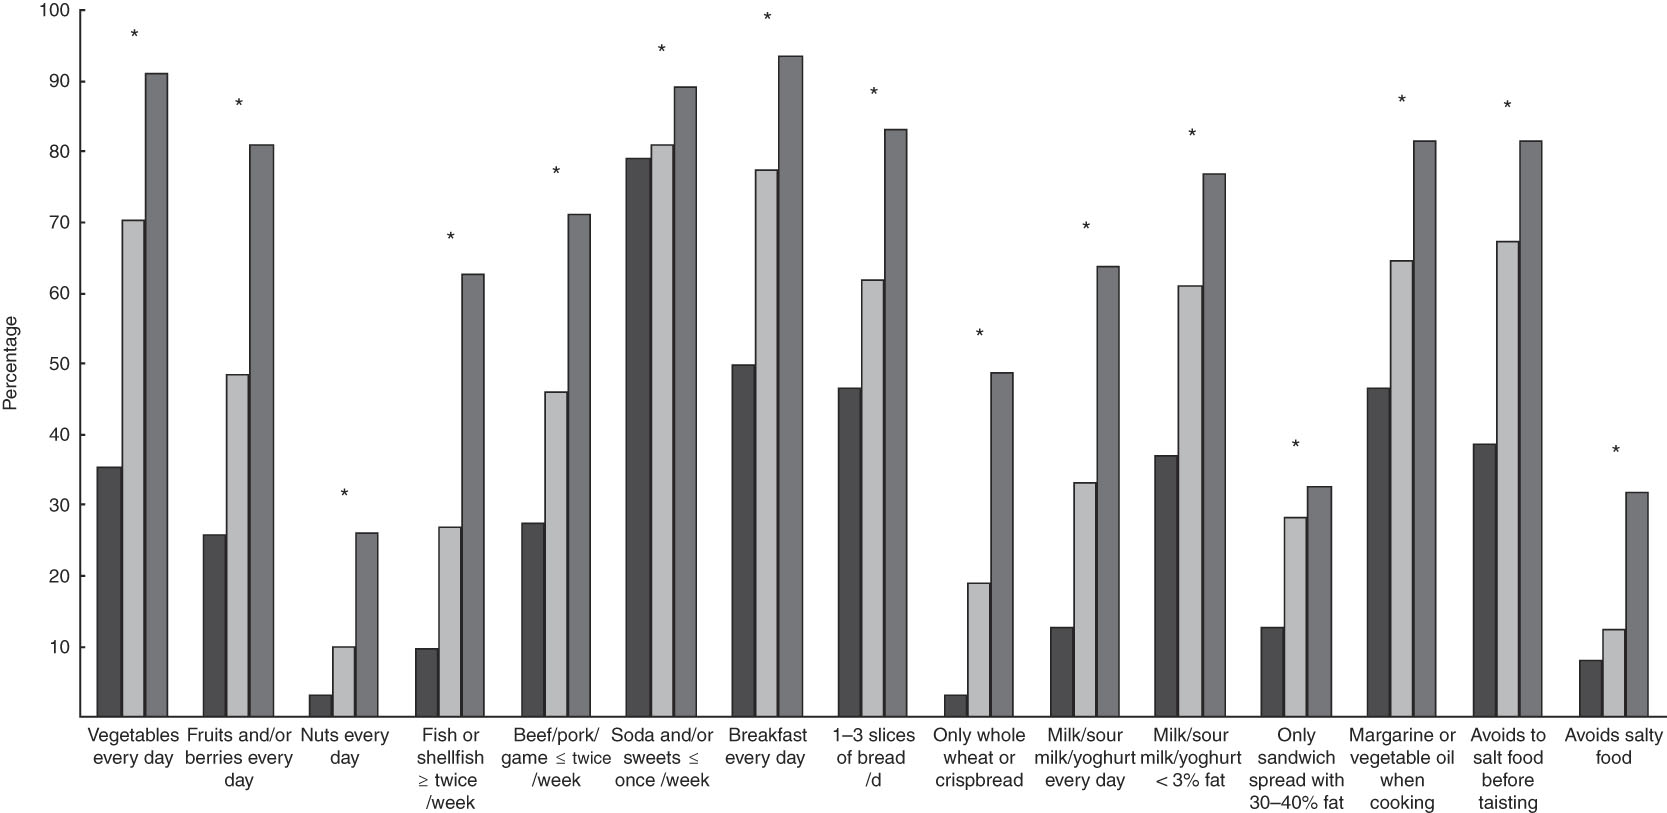
Fig. 2 Percentage of participants in each dietary pattern group (![]() , poor;
, poor; ![]() , average;
, average; ![]() , good) who were considered to meet the recommendations for each item among 50-year-old men and women born in 1963 and living in Gothenburg, Sweden, 2013. Differences between groups were measured with χ
2 tests: *P<0·05 (pairwise difference between the groups are presented in the online supplementary material, Supplemental Table 1). Good diet meets nine or more recommendations; average diet meets six to eight recommendations; and poor diet meets five or fewer recommendations
, good) who were considered to meet the recommendations for each item among 50-year-old men and women born in 1963 and living in Gothenburg, Sweden, 2013. Differences between groups were measured with χ
2 tests: *P<0·05 (pairwise difference between the groups are presented in the online supplementary material, Supplemental Table 1). Good diet meets nine or more recommendations; average diet meets six to eight recommendations; and poor diet meets five or fewer recommendations
Socio-economic differences and other lifestyle factors in relation to dietary patterns
Figure 3 shows differences in socio-economic factors and lifestyle between dietary pattern groups. The poor dietary pattern group had the lowest proportion of university/college education and highest proportions of smoking and sedentary lifestyle, while no significant correlations were found between dietary pattern groups and participants living alone or having permanent stress. Pairwise differences between the groups are presented in the online supplementary material, Supplemental Table 2.

Fig. 3 Distribution of socio-economic and lifestyle factors by dietary pattern group (![]() , poor;
, poor; ![]() , average;
, average; ![]() , good) among 50-year-old men and women born in 1963 and living in Gothenburg, Sweden, 2013. Differences between groups were measured with χ
2 tests (pairwise difference between the groups are presented in the online supplementary material, Supplemental Table 2). Good diet meets nine or more recommendations; average diet meets six to eight recommendations; and poor diet meets five or fewer recommendations
, good) among 50-year-old men and women born in 1963 and living in Gothenburg, Sweden, 2013. Differences between groups were measured with χ
2 tests (pairwise difference between the groups are presented in the online supplementary material, Supplemental Table 2). Good diet meets nine or more recommendations; average diet meets six to eight recommendations; and poor diet meets five or fewer recommendations
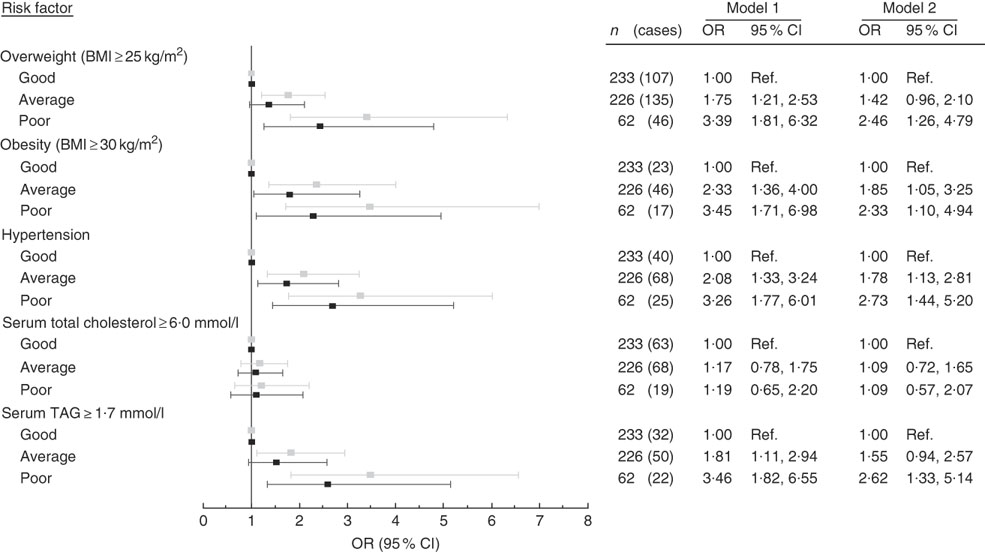
Dietary patterns and cardiovascular risk factors
Figure 4 shows the odds of having a cardiovascular risk factor by good, average and poor dietary patterns. With good dietary pattern as the reference, there was a gradient increase in OR of having overweight, obesity, hypertension and high serum TAG in those with average and poor dietary patterns. After adjusting for education, smoking, sedentary lifestyle and permanent stress, the odds of being obese were increased to 1·85 (95 % CI 1·05, 3·25) in participants with average dietary patterns and up to 2·33 (95 % CI 1·10, 4·94) in those with poor dietary patterns. There were also higher odds of having high blood pressure (OR=2·73; 95 % CI 1·44, 5·20) and high serum TAG (OR=2·62; 95 % CI 1·33, 5·14) in those with poor dietary patterns, while there was no significant difference in having high serum total cholesterol between the dietary pattern groups. In a sensitivity analysis with obese individuals excluded, the association between dietary pattern and risk factors was still present (see online supplementary materal, Supplemental Table 3).

Fig. 4 Odds of having a cardiovascular risk factor, comparing participants with a good dietary pattern (Ref., reference category) v. participants with average and poor dietary patterns, among 50-year-old men and women born in 1963 and living in Gothenburg, Sweden, 2013. Values are OR, with their 95 % CI represented by horizontal bars: ![]() , model 1 (unadjusted);
, model 1 (unadjusted); ![]() , model 2 (adjusted for education, smoking, sedentary lifestyle and permanent stress). Good diet meets nine or more recommendations; average diet meets six to eight recommendations; and poor diet meets five or fewer recommendations
, model 2 (adjusted for education, smoking, sedentary lifestyle and permanent stress). Good diet meets nine or more recommendations; average diet meets six to eight recommendations; and poor diet meets five or fewer recommendations
Discussion
In a cross-sectional sample of 50-year-old Swedish men and women, we found that a simple fifteen-item FFQ can predict the risk of a poor dietary pattern related to CVD risk factors. With a good dietary pattern as reference, there was a gradient increase in odds of clinical CVD risk factors for participants with average and poor dietary patterns. The results confirm that compliance to the NNR seems to be associated with a lower prevalence of CVD risk factors. This is in accordance with results from recent large-scale international studies, showing that both eating amounts of macronutrients in accordance with NNR recommendationsReference Dehghan, Mente and Zhang (33) and having a high intake of fruits and vegetables are associated with lower risk of CVDReference Miller, Mente and Dehghan (34) .
We found a reverse relationship between a good dietary pattern and other health-related lifestyle factors, such as smoking and sedentary lifestyle. This has previously been established in the INTERGENE study, which identified five distinct food clusters and where the healthy eating pattern was associated with other positive health behavioursReference Berg, Lappas and Strandhagen (23) . During the past decades, it seems that the gap between a healthy and unhealthy lifestyle in relation to level of education has increased in Sweden( 10 ). This is a trend that was also evident in the present study, where poor dietary patterns were more common among participants with lower education. No differences between the dietary pattern groups were found regarding marital status, being born outside Sweden or working full/part-time.
The prevalence of obesity (17·5 and 15·5 % for men and women, respectively) in the present study was within the range previously reported in Sweden. A study which measured weight and height showed a prevalence of obesity of 19 % in both men and womenReference Ng, Fleming and Robinson (17) , while a study with self-reported data found a prevalence of about 14 % for both sexes aged 16–84 years( 10 ). The value in the latter study was most likely under-reported and the ‘true’ value is probably somewhat higherReference Nyholm, Gullberg and Merlo (35) .
The present study showed an association between a poor dietary pattern and hypertension. Similar results were recently shown in the Västerbotten Intervention Programme study, where a Healthy Diet Score was associated with lower systolic blood pressure for men after 10 years of follow-upReference Winkvist, Klingberg and Nilsson (27) . In addition, the INTERGENE study showed that the cluster of participants with a healthy eating pattern had lower blood pressure compared with the rest of the study population( Reference Berg, Lappas and Strandhagen 23 ). Furthermore, the Framingham StudyReference Millen, Quatromoni and Nam (36) showed a similar positive effect from a healthy dietary pattern on hypertension. A recent meta-analysis of the association between dietary pattern and blood pressure showed that some dietary patterns are more effective than others in reducing blood pressureReference Gay, Rao and Vaccarino (37) . The largest effect was seen from the DASH (Dietary Approaches to Stop Hypertension) diet, characterized by increased consumption of fruits, vegetables, low-fat dairy, whole grains, lean meats (fish and poultry), nuts and beans, as well as reduced intakes of red meat and fat.
There were no differences in hypercholesterolaemia between the dietary pattern groups in the present study. This may be due to a small sample size, too small range in cholesterol levels between dietary pattern groups, or limitations in the FFQ with regard to capturing the consumption of relevant foods properly. The result could not, however, be explained by cholesterol-lowering treatment, since all individuals with these types of medication were excluded from the study.
Strengths and limitations
The greatest strengths of the current study are the randomly selected population sample and the thorough procedure for data collection. The method for data collection in the present study has been performed in several previous cross-sectional studies of 50-year-old men and women in GothenburgReference Zhong, Rosengren and Fu (19) . Since the FFQ was created for the purposes of the study, there has not been any previous validation of the method, which is a limitation. However, the FFQ showed to be promising as a screening tool, assessing the risk of poor dietary patterns, and should be further tested in future studies. In addition, the cross-sectional design is a limitation, since it only generates descriptive data from one time period, and we are only able to describe correlation, not any causal effect. Furthermore, the response rate in the study was about 50 % and the sample was quite small, limiting the possibility to find clear associations in subgroup analysis. Due to ethical reasons, we were not able to collect any information about the non-participants. However, previous studies have found that individuals willing to participate in population studies tend to have higher socio-economic status and a healthier life style compared with non-participants( Reference Tolonen, Dobson and Kulathinal 38 , Reference Strandhagen, Berg and Lissner 39 ). Thus, the percentage of participants with poor dietary patterns might have been underestimated. Nevertheless, we found a difference in education and some lifestyle factors between the dietary pattern groups. If the participation rate had been higher, it is possible that the differences would be greater and more associations between socio-economic factors and dietary pattern groups may have been found.
The FFQ lacked information regarding portion sizes and included only specific food frequencies, giving an indication of the quality of the dietary pattern rather than mirroring habitual food intake. However, by showing an association between dietary patterns and health indices it gives an indirect evaluation of the questionnaire’s feasibility to capture meaningful data. It therefore appears suitable for the purpose of screening for poor dietary patterns related to cardiovascular risk factors. The simplicity of the FFQ is its greatest strength. It is easy to use for both the interviewer and the participant, and the interviewer does not require special training. Health-care professionals in Sweden are encouraged to address lifestyle issues with patients proactively, with the aim of screening for a risk of unhealthy lifestyle behaviours( 28 ). The FFQ could be used as such a screening tool and should be tested in practical settings for further development. It is important to stress that screening is merely a quick and easy method to identify risks, meaning that not all individuals identified actually have unhealthy dietary patterns. However, the screening should lead to an offer of further assessment by a dietitian and those found in need of advanced counselling should also be offered individualized dietary advice( 40 ).
Conclusions
Individuals with a higher compliance to the NNR are less likely to have cardiovascular risk factors than those showing poor dietary quality according to the recommendations. The fifteen-item FFQ tested in the present study was shown to predict an association between poor dietary patterns and cardiovascular risk factors. Hence, the FFQ has potential to be used as an effective screening tool for detecting individuals at risk of developing food-related CVD risk factors.
Acknowledgements
Financial support: This work was supported by the Swedish state under the agreement between the Swedish government and the county councils concerning economic support of research and education (P.-O.H., grant number ALFGBG-532311); the Swedish Heart and Lung Foundation (C.E.P., grant number 2015 0438); and the Swedish Research Council (C.E.P., grant number 2013 0325). The funding agencies had no role in the design, analysis or writing of this article. Conflict of interest: None. Authorship: All authors contributed to the research question. C.W. and P.-O.H contributed to the design and the implementation of the study. C.E.P. conducted the analyses and all authors contributed to the interpretation of data. C.E.P., E.R. and E.S. drafted the manuscript. All authors critically revised the manuscript and gave final approval. Ethics of human subject participation: This study was conducted according to the guidelines laid down in the Declaration of Helsinki and all procedures involving human subjects were approved by the Regional Ethical Review Board in Gothenburg (2013/649). Written informed consent was obtained from all subjects.
Supplementary material
To view supplementary material for this article, please visit https://doi.org/10.1017/S1368980018002264