


Sugar-sweetened beverages (SSB) contribute to multiple health problems among adults worldwide( Reference Singh, Micha and Khatibzadeh 1 – Reference Curhan and Forman 3 ), including obesity among youths overall( Reference Collison, Zaidi and Subhani 4 – Reference Te Morenga, Mallard and Mann 13 ) and among Black and Latino youths in particular( Reference Bremer, Byrd and Auinger 14 , Reference Kenney, Long and Cradock 15 ). Lowering SSB consumption can reduce youths’ BMI( Reference Levy, Friend and Wang 16 , Reference Ebbeling, Feldman and Osganian 17 ). In 2009–2010, energy from beverages (‘beverage calories’) accounted for 21·1 % of total energy intake (from all sources) among US youths in the form of added sugars, although there was a decrease in energy from beverages over time from 2001 to 2010( Reference Mesirow and Welsh 18 ).
A primary public policy response to the obesity epidemic has been industry self-regulation, such as voluntary commitments to change marketing practices( Reference Wilde 19 ). However, self-regulation has been questioned in terms of effectiveness and industry compliance, given that companies’ main motivation is to sell their product( Reference Simon 20 , Reference Ronit and Jensen 21 ). One self-regulatory response is the Balance Calories Initiative (BCI), a partnership in 2014 between the American Beverage Association and the Alliance for a Healthier Generation( 22 ), under which the American Beverage Association pledged to decrease per capita consumption of energy from beverages by 20 % by 2025 (http://www.balanceus.org/; http://www.kickthecan.info/system/files/Balanced%20Calories%20Initiative.pdf). The BCI has two components: (i) the National Initiative, which aims to reduce beverage calories nationally; and (ii) the Communities Initiative, which aims to reduce beverage calories in eight to ten US communities that have had less access to or lower sales of no- or reduced-calorie beverages. The American Beverage Association is a trade association that represents the US’s non-alcoholic beverage industry; it includes Coca-Cola Co., PepsiCo Inc. and Keurig Dr Pepper. The Alliance for a Healthier Generation, which was founded by the American Heart Association and the Clinton Foundation, aims to reduce the prevalence of childhood obesity and to empower youths to develop lifelong, healthy habits by working with schools, companies, community organizations, health-care professionals and families to transform conditions and systems.
A key BCI component is targeted and tailored engagement of pilot lower-income communities. The local initiative started in communities in Eastern Los Angeles, CA, followed by Little Rock, AK, and then communities in New York City, with an October 2016 roll-out to Montgomery, AL and the North Mississippi Delta, MS. Targeted local activities may include introducing and expanding new reduced-calorie products and smaller-portion packages; changing product placement (e.g. end-aisle and checkout displays featuring only reduced-calorie beverages, repositioning reduced-calorie beverages on shelves); providing coupons and other promotions for no- and reduced-calorie options; conducting taste tests; and putting messages about energy balance on beverage coolers and billboards.
As of 2017, at least two BCI logos had been advanced, with messages stating: ‘Find your balance, find your flavor’ (Picture 1, Fig. 1; paired with pictures of regular and diet beverages such as soda and iced tea; see https://www.drpeppersnapplegroup.com/company/balance); ‘Balance What You Eat, Drink, and Do’ (Picture 2, Fig. 1; shown with pictograms of a set of utensils, a cup with a straw and a running figure; see http://www.cokeconsolidated.com/wellness); and ‘Balance What You Eat, Drink, and Do’, paired with the explanatory text, ‘More Beverage Choices, Smaller Portions, Less Sugar’, especially on billboards (Picture 3, Fig. 1). These pictures were sometimes shown with beverage company logos (e.g. Coca-Cola) and messages were presented in Spanish in some neighbourhoods.
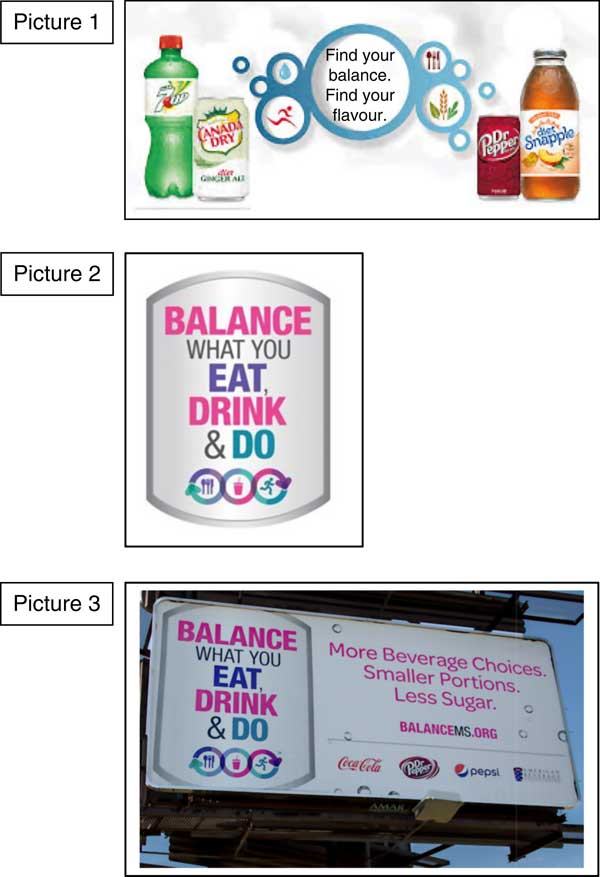
Fig. 1 (colour online) Balance Calories Initiative logos and messaging
Research has examined perceptions of beverage advertising and labelling, and how viewing beverage advertising can influence beverage consumption. Relevant to the BCI, a focus group study found that a nutritional logo with the phrase ‘Balance your energy’ was not well understood and rated negatively, and physical activity pictograms (e.g. walking figure) depicted next to calorie counts were negatively viewed as inducing guilt( Reference Van Kleef, Van Trijp and Paeps 23 ).
The present research qualitatively assessed awareness and range of perceptions of the BCI and its messages among key stakeholders, including parents of children aged 0–17 years, children aged 10–17 years, and store and restaurant managers. We explored participants’ comprehension of the messages, including the extent to which they understood the campaign’s overall intent to decrease SSB consumption.
Methods
Participants
Participants were drawn from three communities targeted by the BCI because of their low sales of no- and reduced-calorie beverages: Montgomery, AL; North Mississippi Delta, MS; and Eastern Los Angeles, CA; note that all three communities have high obesity rates( 24 ). Semi-structured interviews were conducted with thirty-three parents of children under 18 years old (ten in CA, eleven in AL, twelve in MS), thirty-eight youths aged 10–17 years (twelve in CA, fourteen in AL, twelve in MS), six supermarket store managers (two in CA, two in AL, two in MS), six convenience store managers (two in CA, two in AL, two in MS) and four restaurant managers (one in CA, one in AL, two in MS).
Parents were eligible if they were the legal caregiver of a child under 18 years, and youths were eligible if they were 10–17 years old. Parents and youths were recruited through youth-serving organizations, via street intercept near food establishments and parks, and by snowball sampling. Specially, directors of youth-serving organizations were asked to arrange times when youths and parents could be interviewed (e.g. before or after an already scheduled activity); study interviewers were present at the organization during those times to answer questions and conduct interviews. Interviewers also approached adults with children in parks or entering or leaving food establishments (e.g. fast-food restaurants, grocery stores), described the study and asked if they wanted to participate; if so, they were taken to a nearby quiet space (e.g. a picnic table) for the interview. Participants were asked to refer other parents and youths who might be eligible for the study. Parents provided written informed consent for themselves and their children, and youths provided assent.
Managers were recruited at their businesses and were eligible if they were the manager or owner of the establishment. Interviewers visited the business during work hours and asked to talk to the manager, to whom they described the study; if managers were interested in being interviewed, they were interviewed at their business at a mutually agreed-upon time. Managers provided oral informed consent.
Semi-structured interview protocol
Participants were asked to ‘think aloud’ as they viewed pictures of BCI logos, signage and text. The think aloud protocol is useful for evaluating how participants interpret and comprehend material( Reference van Someren, Barnard and Sandberg 25 – Reference Fonteyn, Kuipers and Grobe 27 ), and here was applied to assess understanding of the intent and meaning of BCI taglines, images and logos. Specifically, parents and youths were shown each of the three BCI images described above (Fig. 1). For each picture, they were asked if they had seen the image before and to think aloud as they looked at the image (‘Tell me everything that you are thinking as you look at this picture. Tell me what you think this picture is saying, in your own words’). Participants were also asked to rate each picture from 1 (‘difficult to understand’) to 5 (‘easy to understand’) and the reasons for their response. Parents and adolescents were given $US 30 in gift cards for local food establishments for participation; managers were given $US 30 in either cash or gift cards. Interviews were conducted between March and August of 2017.
Qualitative analysis
We conducted thematic coding on the transcripts( Reference Ryan and Bernard 28 ). As an initial step, two team members developed two codebooks: one for parents and youths (who answered similar questions) and one for store/restaurant managers. To develop the codebooks, the two team members first independently reviewed all open-ended responses and wrote up summary notes, and then met to determine essential codes and a coding tree( Reference Ryan and Bernard 29 ). For parents and youths, the codebook captured misunderstandings of BCI messages (general misunderstandings about the overall meaning of the picture and definitions of words such as ‘balance’; specific misunderstandings about SSB, e.g. that some SSB are healthier than others, that drinking SSB will not be harmful if one also eats healthy foods and/or exercises) or understandings of BCI messages (i.e. that it is important to drink healthy no- and reduced-calorie beverages, exercise and eat healthy foods). Understandings of some but not all aspects of the message were coded as ‘mixed understandings’. Comments about the underlying intent of the advertisement (e.g. to sell SSB) were also coded. For managers, narratives were coded in terms of awareness of the BCI, beverage marketing strategies, store/restaurant relationship with beverage companies and suggestions for reducing SSB consumption. Interviewers also conducted in-store observations (by walking around the perimeter and down each aisle, and checking coolers) and coded whether BCI logos were displayed.
Once initial codebooks were developed, the codebooks were refined in an iterative process: each coder independently coded a transcript and then met to discuss agreements as well as areas of lack of clarity, to determine whether the coding scheme needed to be changed or refined (e.g. with a more specific definition of a code). After both coders agreed on the codebook, they independently marked areas of text pertaining to the final codes in 10 % of the parent and youth transcripts (seven total) and 19 % of the store/restaurant manager transcripts (one of each type). Coder consistency across responses was good (κ=0·90 across codes for parent and youth interviews; κ=0·77 for manager interviews)( Reference Cohen 30 ). After coder consistency was achieved, both coders coded all remaining transcripts independently and met to discuss and resolve any discrepancies.
Coders noted that similar themes tended to be repeated in later interviews and no new codes were added after initial coding was completed; thus, we believe that saturation was reached within each category of participants.
Results
Descriptive statistics
As shown in Table 1, 58 % of parents were mothers and 42 % of youths were female. Two-thirds of parents and more than two-thirds of youths were Black/African American, and 27 % of parents and 39 % of youths were Latino; all Black/African-American participants were drawn from AL and MS, and all Latino participants were drawn from CA. Over 70 % of parents and over 80 % of youths drank SSB at least a few times per week. Fewer parents (n 12; 36 %) than youths (n 24; 63 %) had seen any BCI message: about a quarter of parents and youths had seen Picture 1, about a fifth of parents and 40 % of youths had seen Picture 2, and 12 % of parents v. 30 % of youths had seen Picture 3. Picture 1 was rated as most difficult to understand, and Picture 2 was rated as easiest to understand.
Table 1 Descriptive characteristics of US parents and youths, recruited from communities targeted by the Balance Calories Initiative, who participated in qualitative interviews in March–August 2017
* 1=every day; 2=a few times per week, 3=once per week; 4=twice per month; 5=once per month; 6=less than once per month; 7=never.
† 1=difficult to understand to 5=easy to understand.
Youths’ and parents’ SSB consumption, understanding of BCI messages and awareness of BCI messages did not differ significantly by region. Specifically, youths and parents did not differ across regions on SSB consumption (F
(2,35)=2·1, P=0·13 for youths; F
(2,30)=2·5, P=0·10 for parents). They also did not differ across region on understanding of any of the BCI messages (for youths, F
(2,35)=0·8, P=0·46 for Picture 1, F
(2,35)=1·7, P=0·21 for Picture 2 and F
(2,35)=0·1, P=0·92 for Picture 3; for parents, F
(2,30)=0·3, P=0·71 for Picture 1, F
(2,30)=1·2, P=0·3 for Picture 2 and F
(2,30)=1·00, P=0·38 for Picture 3). Finally, youths’ and parents’ awareness of the any of the three BCI messages did not differ by region (for youths, $\chi _{{(2)}}^{2} $
=2·4, P=0·31 for Picture 1,
$\chi _{{(2)}}^{2} $
=2·4, P=0·31 for Picture 1, $\chi _{{(2)}}^{2} $
=2·3, P=0·67 for Picture 2 and
$\chi _{{(2)}}^{2} $
=2·3, P=0·67 for Picture 2 and $\chi _{{(2)}}^{2} $
=3·9, P=0·15 for Picture 3; for parents,
$\chi _{{(2)}}^{2} $
=3·9, P=0·15 for Picture 3; for parents, $\chi _{{(2)}}^{2} $
=5·5, P=0·06 for Picture 1,
$\chi _{{(2)}}^{2} $
=5·5, P=0·06 for Picture 1, $\chi _{{(2)}}^{2} $
=1·9, P=0·39 for Picture 2 and
$\chi _{{(2)}}^{2} $
=1·9, P=0·39 for Picture 2 and $\chi _{{(2)}}^{2} $
=4·6, P=0·09 for Picture 3).
$\chi _{{(2)}}^{2} $
=4·6, P=0·09 for Picture 3).
Parent and youth themes
Representative quotes are listed in Table 2; themes are discussed below.
Table 2 Parents’ (n 33) and youths’ (n 38) understanding of and beliefs about the Balance Calories Initiative (BCI) messages, collected in March–August 2017
SSB, sugar-sweetened beverage.
Across regions, participants, especially youths, showed mixed or poor comprehension of the Balance Calories Initiative messages (Table 2, code A)
Although most participants rated BCI messages as relatively easy to understand (Table 1), participants showed basic misunderstandings of the messages through their qualitative narratives. Among youths generally, and especially those who were younger, there was confusion about the word ‘balance’. Some youths thought that balance meant drinking a greater variety of beverages, in terms of new flavours and different brands, or finding the drink they liked the best. For example, a 10-year-old girl in AL said, ‘drink a little bit of each of these drinks,’ and a 14-year-old boy in MS said, ‘Balance means buy the right drink for you that you like and enjoy.’ A few youths and parents thought that the message suggested that sodas now have less sugar.
Although misunderstandings among youths were evident across regions, more misunderstandings seemed to emerge among parents in the South compared with CA. In the South, parents and youths had the additional misconception that dark sodas (e.g. Coke) are less healthy than light sodas (e.g. Sprite). For example, one 46-year-old mother in AL said, ‘I see the black boxes of sodas and I see diseases, the darker the beverage is, the badder for the body.’
Some parents and youths believed the Balance Calories Initiative messages endorsed combining healthy and unhealthy activities (Table 2, code B)
Some parents and youths believed that the BCI message of ‘balance’ conveyed the need to equalize intake of healthy and unhealthy beverages, or to balance unhealthy beverages with healthy food and beverage intake, and exercise. For example, a 15-year-old boy in CA said, ‘Balance means keep equally when you drink soda and diet soda,’ and a 14-year-old girl in CA said, ‘Balance means weigh out bad things with good things.’ A 34-year-old mother in AL said, ‘Balance means, it does not matter what you eat, drink or do, no matter what it is as long as all balances out,’ and a 36-year-old father in CA said that balance means ‘not too much, not too little, the right combination of healthy and unhealthy.’ These participants understood the message as saying that they can drink SSB if they also exercise, eat healthy foods and/or drink healthy beverages. They did not seem to understand the negative consequences of SSB consumption for health.
Some parents and youths thought the Balance Calories Initiative messages were promoting sugar-sweetened beverages (Table 2, code C)
Some participants felt that the overall message was an advertisement for SSB, especially Picture 3, which showed the three main beverage company logos. As one 14-year old girl in CA said in response to Picture 3, ‘I think the statement “More beverage choices” does not make sense here. It is saying to drink or try more beverages and then saying less sugar. I cannot have less sugar if I’m going to have more beverages choices.’ Several participants said that the pictures made them want to drink SSB. For example, in response to Picture 1, a 23-year-old mother in AL said, ‘Getting thirsty, hmmm, just thirsty,’ and another 22-year-old father in CA said, ‘I want to have a soda, I prefer regular sodas than diet sodas, that’s all that I can think of.’
Some parents and youths interpreted Balance Calories Initiative messages to be promoting public health recommendations around healthy food and beverage intake, and exercise (Table 2, code D)
Some parents and youths, especially those in CA, interpreted the BCI message as conveying the need to balance healthy eating with exercise and healthy drinks. Others understood the message as communicating a general message about health, without focusing on the word ‘balance’. For example, some youths perceived from the messages that they should eat healthy foods, that they should consume beverages with less sugar, that they should reduce their SSB intake, or that they should exercise. Few participants found diet drinks to be acceptable for reducing sugar intake, but many recognized water as healthy. As a 46-year-old mother in CA said of Picture 1, ‘It is a little confusing, because I think diet sodas are not good for health, I do not like them and I do not drink them, but in this picture, it seems, diet beverages are ok.’
Food establishment manager themes
Table 3 shows representative quotes from store/restaurant managers for the themes described below.
Table 3 Store/restaurant managers’ (n 16) awareness of the Balance Calories Initiative (BCI), marketing strategies for sugar-sweetened beverages (SSB) and relationship to beverage companies, collected in March–August 2017

TV, television.
* Half of the logo was observed on a cooler that the manager said had come from a previous owner.
† A large logo in the front window of the store was mostly obscured by a plant.
Knowledge/awareness of the Balance Calories Initiative (Table 3, codes A and B)
Although part of the BCI’s mission is to engage food establishments in offering promotions for no- and reduced-calorie beverages, only four managers (25 %) were familiar with the BCI logo. However, interviewers observed the BCI logo in seven of the stores, meaning that three managers who were not aware of the logo had been exposed to it.
No manager said that they had been given specific guidance from beverage manufacturers about the BCI. Even the manager of one supermarket that had hosted a BCI event said: ‘We have not had any other communication with anybody from the Balance Calories Initiative, we just had the initial communication … when they gave us the decals and stickers that we have so far, but nothing else that I’m aware of.’ And a restaurant manager in MS said, ‘We have not received anything related to the Balance Calories Initiative,’ which was consistent with what most other managers communicated.
Beverage marketing (Table 3, codes C and D)
Managers said that they did not communicate regularly with companies about marketing and that placement and advertising of beverages was mainly determined by the owner or corporate headquarters (if the establishment was owned by a national company). Managers said that, in some cases, the beverage manufacturer might install the cooler or have an agreement with the store about shelf space quantity or special floor displays. However, managers said beverage companies mainly engaged in national advertisements or promotions (e.g. coupons), rather than intervening at the local store level.
Managers thought that beverage companies’ national advertising efforts for SSB were very effective (and trickled down to the local level) and that within-store discounts were more helpful than other types of promotions for sales. Coupons were seen to be less effective because they had strict rules that needed to be explained to consumers (e.g. expiry date). In terms of their own marketing strategies, managers said that SSB sold better than no- or reduced-calorie beverages. Thus, they were not incentivized to change the placement or pricing of no- and reduced-calorie beverages (as suggested under the BCI) and instead focused on increasing sales of SSB. Accordingly, the study team observed that all stores had more prominent displays promoting SSB than water.
Suggestions for reducing sugar-sweetened beverage consumption (Table 3, code E)
When asked how SSB consumption could be reduced, several suggested reducing beverage container size. One convenience store had negotiated a smaller bottle with American Beverage Association manufacturers, and sales continued to be strong. Others suggested better pricing of no- and reduced-calorie drinks from beverage companies (because they tended to cost more than SSB). Managers were sceptical that beverage companies would be motivated to reduce consumption and that consumers would stop buying SSB; some felt that the only way to decrease obesity rates would be to reformulate SSB to have less sugar with a similar taste.
Discussion
Our results suggest that BCI goals to reduce beverage calories consumed per capita in the USA may not be achieved unless BCI messages are revised to convey the health-related risks of high SSB (and sugar) intake. Within each BCI-targeted community, parents and youths were confused by BCI messages or perceived that the messages were promoting SSB consumption, rather than encouraging reduction in SSB intake or cautioning about the health consequences of SSB. Parents and youths commented that the messages communicated that SSB could be consumed in conjunction with healthy beverages and activities. Relatively fewer participants thought that BCI messages indicated an overall focus on health and the need to reduce SSB intake. Some participants believed the BCI messages were advertising SSB, as beverage company logos and products were prominently displayed next to BCI messages. Clinicians and public health practitioners should be made aware of the need to address misunderstandings about SSB consumption, which may be exacerbated by such campaigns.
A key BCI activity is to work with food establishments in BCI-targeted areas, to, for example, change product placement and promote no- and reduced-calorie beverages. Our interviews suggest that beverage companies have not engaged managers to help realize BCI goals. Managers were largely unaware of the BCI and did not intend to change placement and promotions regarding SSB, which generated high profits. Most did not actively work with beverage companies on beverage placement and promotion. In most cases, placement and promotion were determined by corporate offices or the individual store, and most managers had little interaction with beverage companies around these issues. Most managers discussed the much higher profit margin for SSB than for no- and reduced-calorie drinks, and thus they intended to continue promoting SSB. Hence, it seems that a major barrier to obesity prevention initiatives such as the BCI is that managers are incentivized to promote SSB more than no- and reduced-calorie beverages. These findings are consistent with prior research, which has discussed the lack of alignment between the goals of the commercial interests that control the food system and the public health system( Reference Lang 31 , Reference Lang and Rayner 32 ).
Study limitations should be acknowledged. Consistent with qualitative methodology, we used a small convenience sample to explore the range of perceptions across BCI communities and thus our findings cannot be used to determine the prevalence of different kinds of perceptions of BCI messages. Importantly, the BCI was announced in 2014 as a 10-year initiative. As more communities are involved, the beverage companies plan to refine BCI messaging and determine additional ways to engage with food establishments.
A recent progress report on the BCI indicated that beverage calories per capita per day decreased by only 2·8 (1·4 %; 11·7 kJ) from 2014 to 2018( 33 ). These results are consistent with prior research that beverage consumption in general is steadily declining among US youths( Reference Mesirow and Welsh 18 ), as well as with studies suggesting that industry self-regulation around SSB may have limited effectiveness( Reference Simon 20 , Reference Ronit and Jensen 21 ) unless the beverage industry has a genuine motivation to reduce sales( Reference Sharma, Teret and Brownell 34 ). Lessons from tobacco industry self-regulation should be heeded when evaluating beverage industry efforts( Reference Sharma, Teret and Brownell 34 ). For example, in the 1980s, the tobacco industry launched youth anti-smoking campaigns, motivated by a desire to prevent government regulation. Evaluations have indicated that these campaigns lacked effectiveness (and may have even increased youth smoking rates), most likely because the messages did not inform about smoking-related addiction and disease( Reference Landman, Ling and Glantz 35 , Reference Wakefield, Terry McElrath and Emery 36 ) – just as BCI messages do not mention harmful health consequences of sugar consumption. If the BCI’s intent is to decrease SSB intake, BCI messages may need to be improved and redeveloped, with input from consumers, clinicians and public health practitioners, and rigorously evaluated by independent researchers.
Acknowledgements
Financial support: This work was funded by the Robert Wood Johnson Foundation under a cooperative agreement (#73587; Principal Investigator: D.A.C.). The funders approved of the overall study design and decision to submit the article for publication. Conflict of interest: None. Authorship: L.M.B. co-led the overall study concept and design, analysis plan, data analysis and interpretation of the data, conducted study interviews, drafted the manuscript and approved of the final version. G.C. coordinated data collection efforts, conducted study interviews, helped with data analysis and interpretation of the results, helped to draft the manuscript and approved of the final version. D.A.C. co-led the overall study concept and design, analysis plan and interpretation of the data, helped to draft the manuscript and approved of the final version. Ethics of human subject participation: This study was conducted according to the guidelines laid down in the Declaration of Helsinki and all procedures involving human subjects were approved by the RAND Human Subjects Protections Committee. Written informed consent was obtained from all parents and adolescents, and verbal informed consent was obtained from food establishment managers. Verbal consent was witnessed and formally recorded.


