


Type 2 diabetes mellitus (T2DM) is a considerable contributor to the global burden of disease(Reference Zheng, Ley and Hu1). In 2019, worldwide prevalence of T2DM among adults was estimated to 8·4 %, where only half being diagnosed. In addition, 7·5 % of the adult population were estimated to have impaired glucose tolerance(2).
There is a strong correlation between diabetes and CVD(Reference Sarwar, Gao and Seshasai3), which is the number one cause of death globally(4) and a major cause of mortality in people with diabetes(5). Adults with diabetes has a two-three times increased risk of CVD, and CVD events generally occur at an earlier age in people with diabetes than people without diabetes(5). A healthy diet is important to prevent CVD and T2DM,(Reference Micha, Shulkin and Peñalvo6) and the association between fish consumption and decreased risk of CVD is well documented(Reference Mozaffarian and Rimm7–Reference Tørris, Småstuen and Molin9). The beneficial effects of fish consumption have largely been attributed to marine n-3 PUFA present in fatty fish(Reference Mozaffarian and Wu10). However, studies on health effects of lean fish consumption suggest that other components than n-3 PUFA have beneficial cardiometabolic effects(Reference Ouellet, Marois and Weisnagel11–Reference Telle-Hansen, Larsen and Hostmark14).
Both lean and fatty fish contain other potential health-promoting components such as taurine, vitamin D, vitamin B12, iodine, Se(Reference Lund15) and more unspecified components such as bioactive peptides(Reference Jensen and Mæhre16).
Peptides with a specific amino acid sequence, and with known bioactivity, have been isolated from by-products from lean and fatty fish(Reference Pampanin, Haar and Sydnes17,Reference Pampanin, Larssen and Provan18) . In vitro and animal studies have suggested that fish protein has beneficial effects on, for example, cardiometabolic markers, including markers related to blood glucose metabolism(Reference Jensen and Mæhre16,Reference Lavigne, Marette and Jacques19–Reference Drotningsvik, Mjos and Pampanin21) . Fish protein peptides are formed during digestion or from enzymatically treatment, and it has been hypothesised that peptides may act locally in the gut or peripherally(Reference Jensen and Mæhre16,Reference Drotningsvik, Mjos and Pampanin21) . Animal studies have shown improved post-prandial glucose regulation, albeit higher weight gain(Reference Drotningsvik, Mjos and Pampanin21), resistance to high-fat-diet-induced obesity(Reference Liaset, Hao and Jørgensen22,Reference Pilon, Ruzzin and Rioux23) , and reduced plasma lipids such as TAG and total cholesterol(Reference Liaset, Hao and Jørgensen22,Reference Wergedahl, Liaset and Gudbrandsen24) when fed a diet rich in hydrolysed salmon protein. Clinical trials with fish protein given as supplements, mainly from lean fish, have suggested beneficial cardiometabolic effects(Reference Dale, Jensen and Hausken25–Reference Zhu, Li and Peng30), including improved glucose metabolism(Reference Vikoren, Nygard and Lied29). However, clinical trials in humans with protein supplements derived from fatty fish are sparse, and the studies are small and with inconsistent results on cardiometabolic risk markers(Reference Framroze, Vekariya and Swaroop26,Reference Kawasaki, Seki and Osajima27,Reference Hovland, Leikanger and Stokkeland31–Reference Jensen, Fjeldheim Dale and Hausken33) .
The overall aim of the FishMeal human intervention study was to investigate effects of salmon fish protein on cardiometabolic risk markers. We hypothesised that daily intake of a salmon fish protein supplement for 8 weeks would improve glucose tolerance in persons with increased risk of T2DM. Our primary outcome was changes from baseline in serum glucose (s-glucose) measured after a 2-h oral glucose tolerance test (2-h OGTT). Secondary outcomes were changes from baseline in other markers related to glucose tolerance: fasting s-glucose, fasting serum insulin (s-insulin), 2-h OGTT-s-insulin, homeostatic model assessment of insulin resistance (HOMA-IR) and HbA1c. Other pre-specified outcomes were changes from baseline in body weight and markers related to lipid metabolism: TAG and total, LDL- and HDL-cholesterol.
Methods
Participants
The study was conducted at the University of Oslo, Norway, from August 2018 to September 2019. We recruited participants through advertisements in social media and medical practices at the University of Oslo. The text in the advertisement was directed at people at risk of T2DM. After a telephone interview, we invited eligible participants to a screening visit to further check eligibility criteria. Inclusion criteria were ≥20 years of age and elevated blood glucose defined as either fasting s-glucose ≥ 5·6 mmol/l, 2-h OGTT-s-glucose ≥ 6·5 mmol/l or HbA1c ≥40 mmol/mol (≥5·8 %). Exclusion criteria were diabetes (defined as fasting s-glucose ≥ 7·0 mmol/l, 2-h OGTT-s-glucose ≥ 11·1 mmol/l or HbA1c ≥40 mmol/mol (≥5·8 %)), high fish/seafood intake (>450 g/week), fish or shellfish allergy and age-related elevated blood pressure (≥70 years: ≥180/110 mmHg, >40–70< years: ≥170/100 mmHg and ≤40 years: ≥160/100 mmHg). Further exclusion criteria were use of prescription drugs related to diabetes, inflammation or systemic use of corticosteroids, or unstable use (defined as change of dose during the last 3 months) of lipid-lowering drugs, thyroxine, blood pressure-lowering drugs and drugs affecting appetite. In addition, we excluded participants with unstable use (defined as change of dose during the last month) of dietary supplements including n-3 PUFA, daily use of protein supplement powder and participants who were pregnant, breast-feeding or planning pregnancy. Furthermore, all participants had to have a stable body weight (defined as ±5 %) during the last 3 months and not be planning changes in body weight during the intervention period.
Ethics
The study was conducted according to the guidelines laid down in the Declaration of Helsinki. All participants gave their written informed consent, and the Regional Ethics Committee for Medical Research in South-East Norway approved the study. The study was registered at ClinicalTrials.gov (ClinicalTrials.gov Identifier: NCT03764423). The post-prandial ‘Fish protein Ex Vivo’ study, assessing uptake of the study product, was registered as a separate study (ClinicalTrials.gov Identifier: NCT04078958).
Study design
We conducted an 8-week double-blind, randomised controlled parallel study. Before the baseline visit, all participants performed a 2–4-week washout period where intake of fish and seafood were reduced to a maximum of one serving (150 g) per week. We instructed participants in both groups to consume ten capsules together with a meal three times per d for 8 weeks (in total thirty capsules per d). All participants were advised to maintain their usual lifestyle habits throughout the study, without changing their physical activity and dietary habits including supplement use, except for a reduction in fish and seafood intake to a maximum of one serving (150 g) per week. Clinical and blood laboratory assessments were performed at baseline and after 8 weeks of follow-up. In addition, the participants came to the study centre after 4 weeks of follow-up to receive more of the study product. We sent a text message 2–3 d before all visits as a reminder of how to prepare for the upcoming visit.
Blinding and randomisation
Participants were stratified by sex (male and female) and age (<50 years, ≥50 years) prior to a block randomisation with use of an external statistician (Health Services Research Unit (HØKH), Akershus University Hospital, Lørenskog, Norway and Faculty Division Akershus University Hospital, University of Oslo, Blindern, Oslo, Norway). The randomisation allocations, selected consecutively, were sent to the product packaging personnel on demand, according to strata information of newly recruited participants.
To ease the management for the participants, capsules were packed in blister sheets (thirty capsules per sheet) and delivered in boxes (seven sheets per box). Boxes (fish protein and placebo) were identical in appearance and were only identifiable by numbers on the containers. The study was double-blinded, as neither the participants, the study investigator collecting data nor the outcome adjudicators knew which group the participants were assigned to. The randomisation code was concealed from the study investigators until the statistical analyses were completed.
Study product
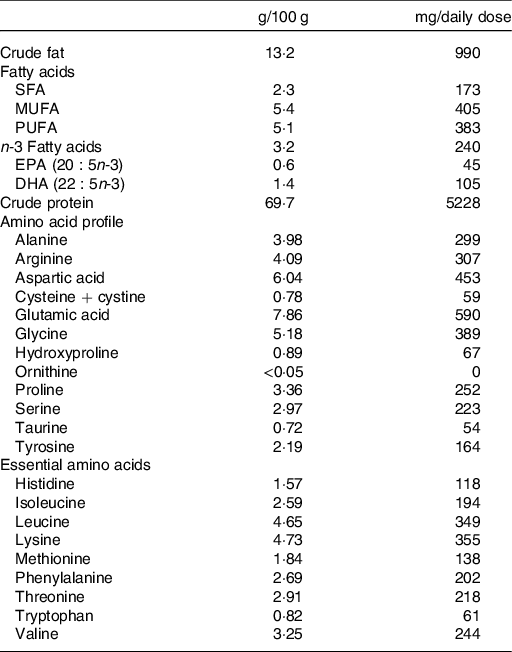
The experimental group received capsules containing salmon fish protein (250 mg/capsule), microcrystalline cellulose (240 mg/capsule), antioxidants (tocopherols and rosemary extract) and excipients (magnesium stearate: 5 mg/capsule, tricalsiumphosphate: 5 mg/capsule and silisiumdioxide: 2·5 mg/capsule). The placebo group received capsules containing microcrystalline cellulose (250 mg/capsule) and antioxidants and excipients similar to the fish protein capsules, but without amino acids. The salmon fish protein contained 69·7 g of protein and 13·2 g of fat/100 g. Table 1 shows the amino acid composition and main groups of fatty acids of the salmon fish protein used in the present study. In the fish protein group, the daily dosage of capsules provided 7·5 g of salmon fish protein, corresponding to a total of 5·2 g of salmon protein. Mowi ASA supplied the salmon fish protein and Optipharma AS produced the capsules in transparent bovine gelatine capsule shells (96 mg of gelatine/capsule) (ACG Europe Ltd). Before and after encapsulation, the fish protein and capsules were stored at 5·5°C, and participants were instructed to store the capsule containers at 4°C during the intervention period. Before encapsulation, and regularly during the intervention period, the content of unwanted micro-organisms (histamine, aerobe micro-organisms, Escherichia coli, and Salmonella) were analysed in the fish protein. Before encapsulation, we also analysed the content of contaminants (Eurofins Food & Feed Testing Norway AS). We did not detect any increase in unwanted micro-organisms in the fish protein during the intervention.
Table 1. Characterisation of the encapsulated salmon fish protein
Uptake of study product
To investigate whether fish protein was taken up into the circulation, we performed a post-prandial analysis of serum amino acids 1 h after intake in five healthy participants. In short, five healthy, male participants were recruited from the University of Oslo from October to November 2019. Inclusion criteria were >20 years of age and BMI between 18·5 and 24·9 kg/m2. Exclusion criteria were known diabetes, elevated blood pressure, pregnancy, breast-feeding or allergy/intolerance to fish. Participants arrived fasting on the morning of the post-prandial test and consumed thirty capsules containing a total of 5·2 g of salmon protein (the same amount as the daily dose in the present study) with 0·5 litres of water. Blood samples were taken at fasting and 60 min after capsule intake. Participants were not allowed to consume dietary supplements or fish the day before the test.
Serum amino acid concentrations were measured by HPLC–tandem MS (HPLC-MS/MS), as previously described(Reference Olsen, Øvrebø and Turner34). Chromatographic separation was performed on a Phenomenex Kinetex Core Shell C18 system (100 × 4·6 mm, 2·6 μm), with an aqueous solution of formic acid (0·5 %) and heptafluorobutyric acid (0·3 %), and acetonitrile. Linear calibration curves of the peak area ratios of analytes and internal standards were used for quantification.
Compliance
The participants received boxes with capsules at baseline and after 4 weeks of follow-up and were instructed to deliver all blister sheets, both empty and full, at the end-of-study visit. Compliance was assessed by capsule count. The number of capsules consumed during the intervention period were counted and divided by the number of capsules scheduled for the intervention period(Reference Mäenpää, Heinonen and Manninen35). Participants with compliance less than 70 % would be excluded from the analysis.
Blood sampling and standard laboratory analysis
Participants were instructed to avoid consumption of alcohol and doing vigorous physical activity the day before blood sampling. Venous blood samples were drawn after an overnight fast (≥10 h). Serum was obtained from silica gel tubes (Becton, Dickinson and Company) and kept at room temperature for >30–60< min, until centrifugation (1500 g , 15 min). Plasma was obtained from K2EDTA tubes (Becton, Dickinson and Company), immediately placed on ice, and centrifuged within 10 min (2000 g , 4°C, 15 min). Lithium-heparin tubes (Becton, Dickinson and Company) and K2EDTA tubes with whole blood were kept at room temperature. Serum and plasma concentrations of fasting glucose, insulin, HbA1c, TAG, total cholesterol, LDL-cholesterol, HDL-cholesterol, high-sensitive C-reactive protein, creatinine, estimated glomerular filtration rate, aspartate aminotransferase, alanine aminotransferase, γ-glutamyl transferase and Hg, and glucose and insulin after a 2-h OGTT were measured by standard methods at an accredited routine laboratory (Fürst Medical Laboratory).
Oral glucose tolerance test
An OGTT was conducted at baseline and at the end-of-study visit. Venous blood samples were drawn, and within 10 min, the participants were instructed to drink a 75-g anhydrated glucose drink (Esteriplas) in less than 5 min. Participants were instructed to remain fasting, remain in the waiting room and refrain from any activity until the post-prandial blood samples were drawn 120 min after finishing the glucose drink.
Clinical assessment
We measured body weight on a digital scale (Seca GmbH) in light clothing without shoes and height with a stadiometer (Seca GmbH). Blood pressure was measured by a Carecape V100 monitor (GE Healthcare) in a sitting position, on the non-dominant arm after a 10 min rest. We obtained three measurements with a 1-min interval, and calculated the average value of the last two measurements.
Dietary assessment
Habitual dietary intake was assessed prior to the intervention through a semi-quantitative FFQ designed to capture dietary habits during the last year(Reference Carlsen, Karlsen and Lillegaard36). The FFQ included questions about intake of 270 food items, including six questions about cold cuts and spreads made of fish and twelve questions about fish eaten for dinner. The options for frequency of consumption ranged from several times per d to once a month, with options for portion sizes based on household units such as slices, pieces and spoons. The same FFQ was used to assess the participants’ diets during the 8-week intervention.
Statistical analysis
Power calculations estimated that 120 participants (including a 20 % dropout rate) were required to obtain 80 % of power with a type I error of 5 % to detect a clinically relevant difference between the two groups of 0·4 (SD 0·7) mmol/l in changes from baseline in 2-h OGTT-s-glucose. Descriptive data are presented as means and standard deviations or medians and quartiles (Q1–Q3) for continuous variables or as frequencies and percentages for categorical variables. We used paired t tests to evaluate differences in energy and nutrient intake between the groups. Differences between the groups in primary, secondary and other pre-specified outcomes were tested with a linear regression model (outcome variable ∼ intervention group + outcome variable at baseline), hereafter called crude model. We performed the same analysis adjusting for strata (age and sex) and weight change in addition to the outcome variable at baseline (outcome variable ∼ intervention group + outcome variable at baseline + age + sex + weight change), hereafter called the adjusted model. Skewed variables (fasting s-insulin, 2-h OGTT-s-insulin, HOMA-IR, TAG and weight) were log-transformed before analysis. Results from the regression analysis are presented as B-coefficients with 95 % CI or logB-coefficients with 95 % CI for skewed variables. P < 0·05 was considered significant. The models were checked for independence and normality of the residuals. Statistical analyses were performed in Stata/MP 16.1 (StataCorp LLC)(37).
Results
In total, 717 participants were assessed for eligibility, eighty-eight were randomly assigned, eighty-three received allocated interventions and seven were lost to follow-up. Thus, seventy-six participants completed the study. All participants had a capsule compliance >70 %. Two participants were non-compliant with the approved study protocol and were not included in the statistical analysis (Fig. 1). Baseline characteristics of the seventy-four participants included in the present study are shown in Table 2. The participants were 56 (Q1–Q3 48–64) years of age, with a mean BMI of 33·5 (SD 4·7) kg/m2, and 64 % were female.
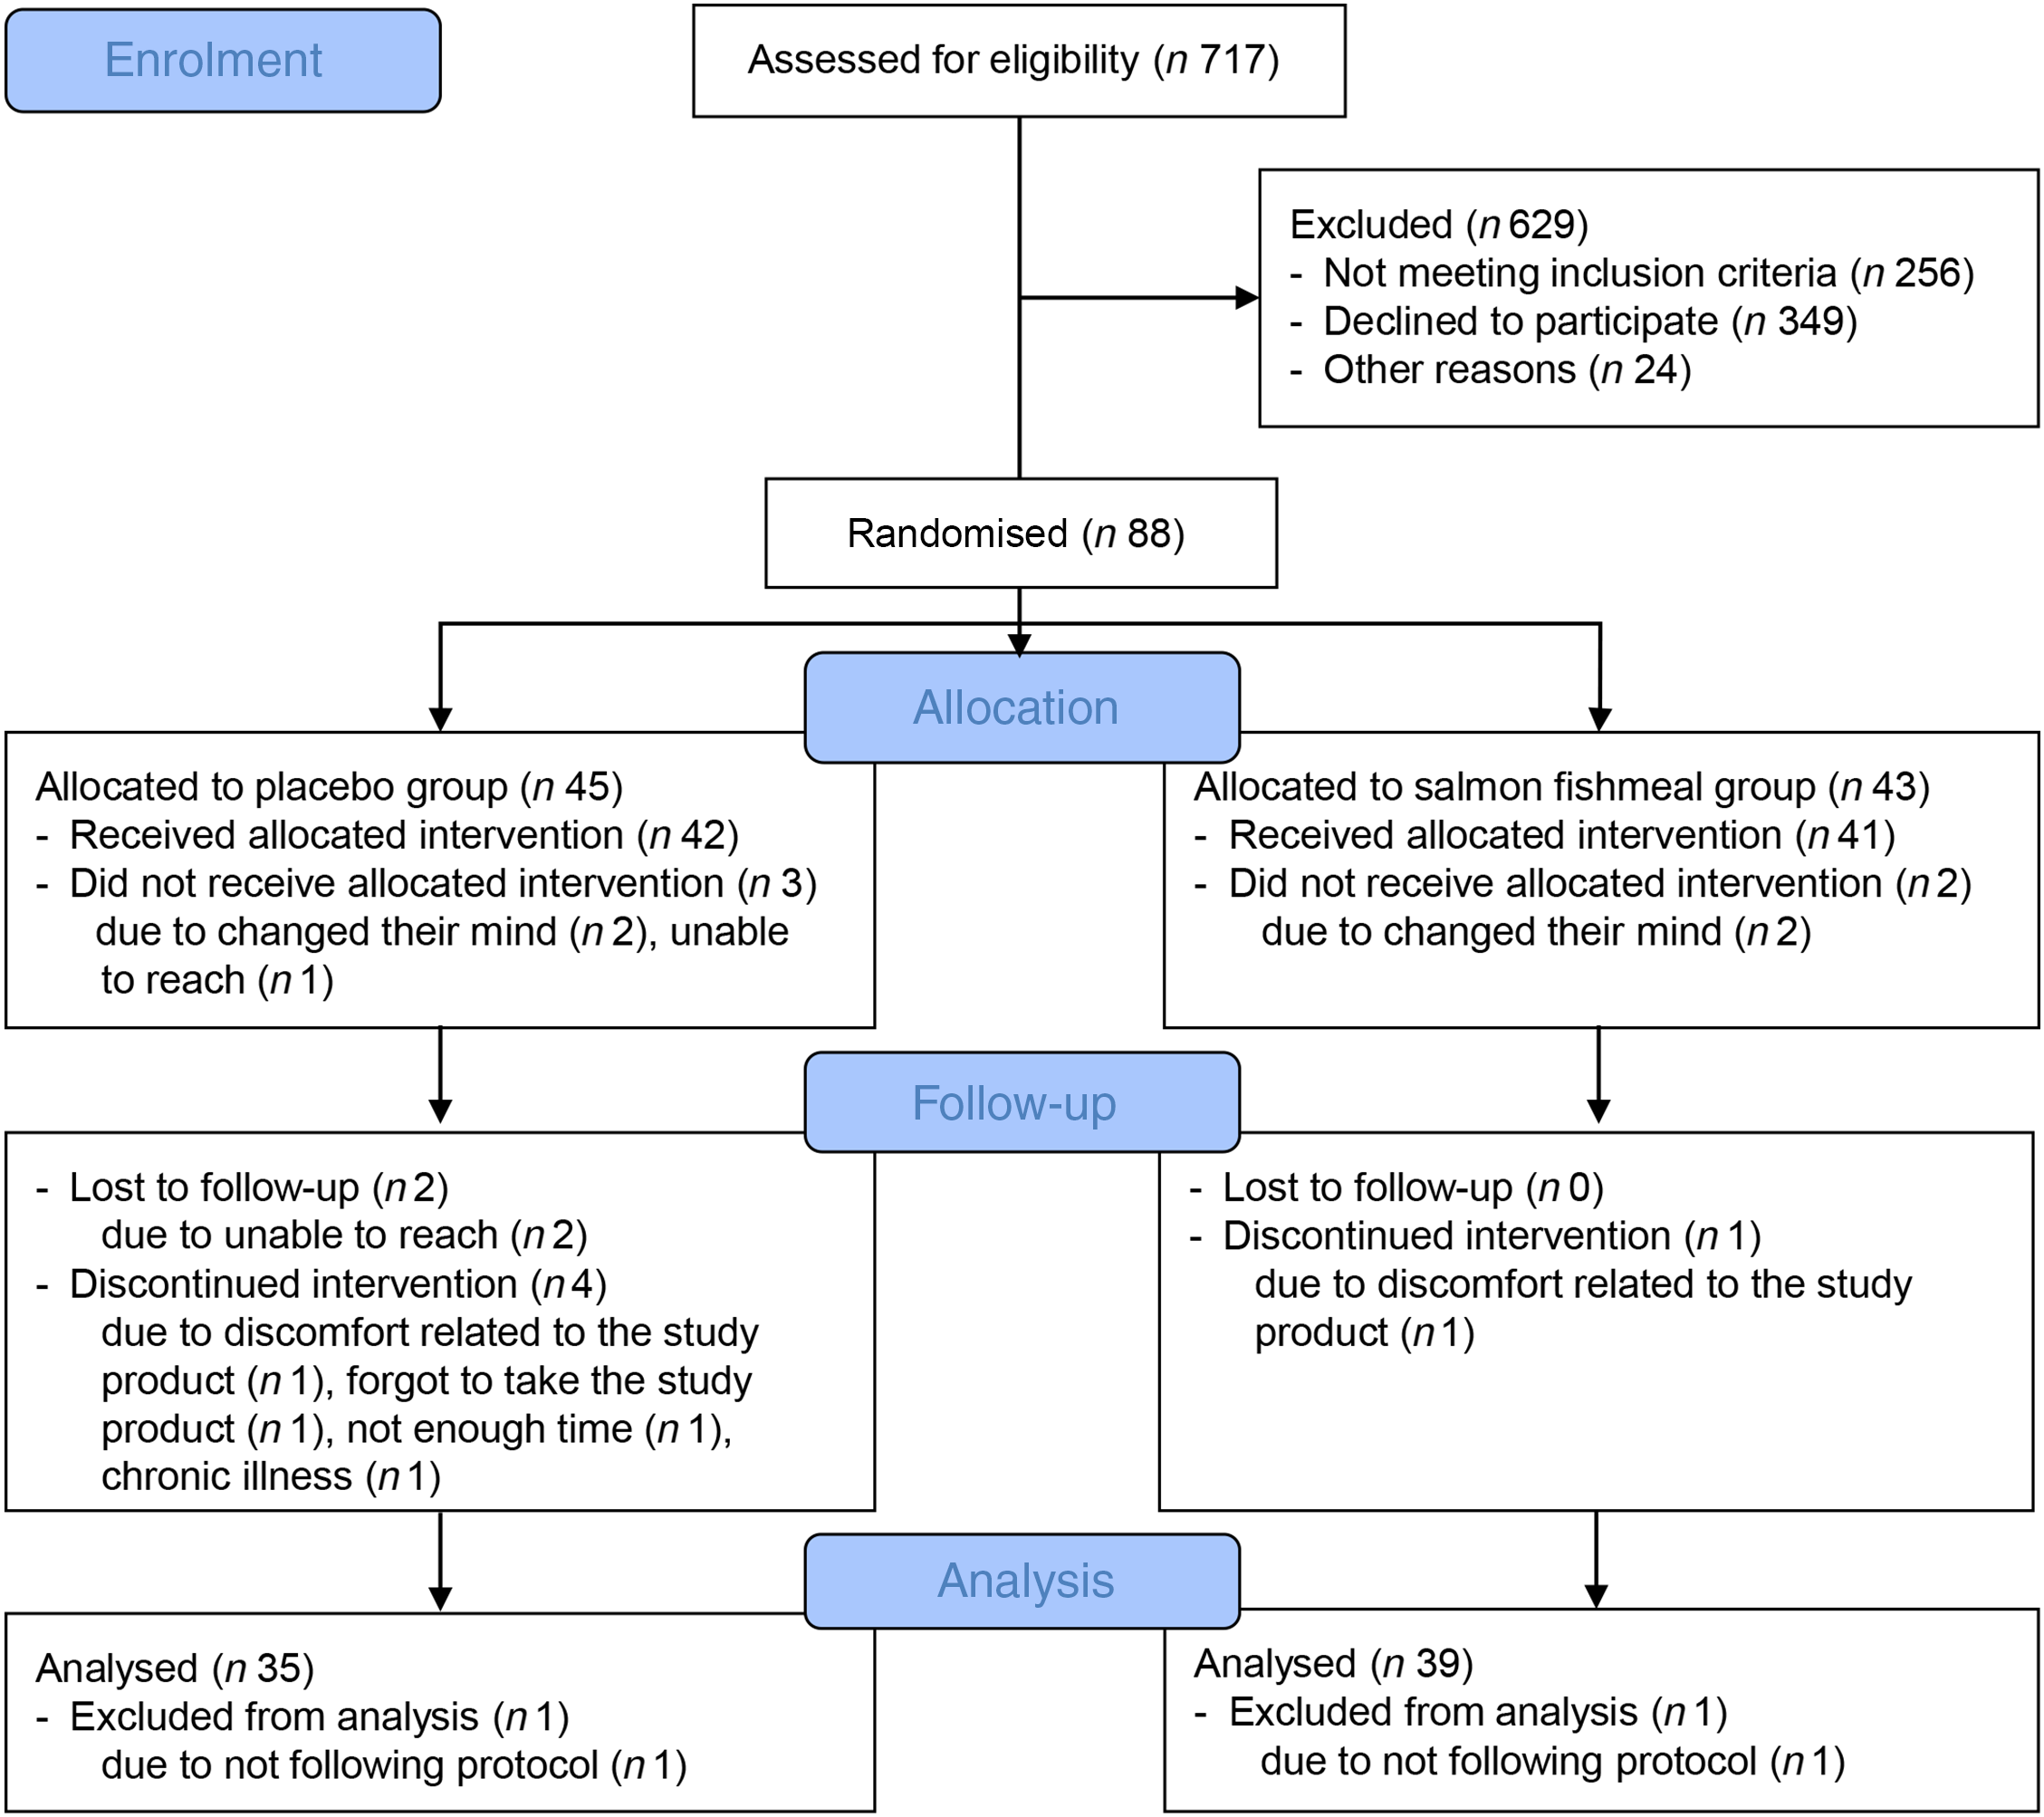
Fig. 1. Flow diagram of the study participants.
Table 2. Subject characteristics at baseline
(Mean values and standard deviations; median values and quartiles (Q1–Q3); frequencies and percentages)

hsCRP, high-sensitive C-reactive protein; eGFR, estimated glomerular filtration rate; ASAT, aspartate aminotransferase; ALAT, alanine aminotransferase; γ-GT, γ-glutamyl transferase.
* CVD history includes heart attack and angina.
Primary and secondary outcomes
At baseline, fasting s-glucose was 5·4 (SD 0·5) mmol/l in the fish protein group and 5·7 (SD 0·6) mmol/l in the placebo group, and 2-h OGTT-s-glucose was 5·8 (SD 1·4) mmol/l in the fish protein group and 6·3 (SD 1·5) mmol/l in the placebo group. During the intervention period, we found no statistically significant differences on fasting s-glucose, 2-h OGTT-s-glucose, fasting s-insulin, HOMA-IR or HbA1c, whereas 2-h OGTT-s-insulin was significantly increased in the crude model (logB 0·23 (95 % CI 0·01, 0·45), P < 0·05). Results on primary and secondary outcomes using both the crude and the adjusted model are shown in Table 3.
Table 3. Primary and secondary outcomes*
(Mean values and standard deviations; median values and quartiles (Q1–Q3); B-coefficients and 95 % confidence intervals)

s-glucose, Serum glucose; OGTT, oral glucose tolerance test; s-insulin, serum insulin; HOMA-IR, homeostatic model assessment of insulin resistance.
* Differences between the groups in primary and secondary outcomes were tested with a linear regression model. Skewed variables (fasting s-insulin, 2-h OGTT-s-insulin and HOMA-IR) were log-transformed before analysis. The regression coefficient expresses the mean difference between the groups. A negative regression coefficient in this table represents a reduction in the fish protein group compared with the placebo group, and a positive regression coefficient represents an increase.
† P for difference between the fish protein group and placebo group using crude values: end-of-study values adjusted for group and baseline values.
‡ P for difference between the fish protein group and placebo group using adjusted values: end-of-study values adjusted for group, baseline values, age, sex and weight change.
Other pre-specified outcomes
During the intervention, no significant difference were found for total cholesterol, LDL-cholesterol, HDL-cholesterol and TAG between the groups (Table 4). Median weight increase was 1·0 (Q1–Q3 −0·2 to 2·0) kg in the fish protein group and 0·4 (Q1–Q3 −0·8 to 1·3) kg in the placebo group (P = 0·08).
Table 4. Other pre-specified outcomes*
(Mean values and standard deviations; median values and quartiles (Q1–Q3); B-coefficients and 95 % confidence intervals)

SBP, systolic blood pressure; DBP, diastolic blood pressure.
* Differences between the groups in other pre-specified outcomes were tested with a linear regression model. Skewed variables (TAG and weight) were log-transformed before analysis. The regression coefficient expresses the mean difference between the groups. A negative regression coefficient in this table represents a reduction in the fish protein group compared with the placebo group, and a positive regression coefficient represents an increase.
† P for difference between the fish protein group and placebo group using crude values: end-of-study values adjusted for group and baseline values.
‡ P for difference between the fish protein group and placebo group using adjusted values: end-of-study values adjusted for group, baseline values, age, sex and weight change.
§ P for difference between the fish protein group and placebo group using adjusted values: end-of-study values adjusted for group, baseline values, age and sex.
|| Three participants had not taken their antihypertensive medication before one of the study visits and were excluded from the statistical analysis of SBP and DBP.
Energy and macronutrient intake
At baseline, median daily energy intake was 9295 (Q1–Q3 7931–11 760) kJ/d in the fish protein group and 9257 (Q1–Q3 7931–10 618) kJ/d in the placebo group. There were no significant changes in the macronutrient, sugar, fibre and energy intake between the groups during the intervention period (Table 5). The fish protein group reported a reduction in energy intake of 559 (Q1–Q3 −1278 to 462) kJ/d and the placebo group reported a reduction of 971 (Q1–Q3 −2828 to 417) kJ/d (P = 0·24). Contribution of energy and macronutrients from the study products are not included in the analysis of dietary data.
Table 5. Energy and nutrient intake*
(Median values and quartiles (Q1–Q3))

E%, percentage of total energy intake.
* Differences in energy and nutrient intake between the groups were tested with the Mann–Whitney test.
Systolic and diastolic blood pressure
We also measured systolic blood pressure and diastolic blood pressure. In both groups, 31 % of the participants used blood pressure-lowering drugs (Table 2). At baseline, systolic blood pressure was 119 (SD 13) mmHg and diastolic blood pressure was 71 (SD 10) mmHg in the fish protein group and 122 (SD 16) mmHg and 71 (SD 10) mmHg in the placebo group. During the intervention period, there were no significant changes in systolic blood pressure (P = 0·45) or diastolic blood pressure (P = 0·79) between the groups (Table 4).
Discussion
In the present study, we investigated the effects of a daily intake of salmon fish protein on several cardiometabolic risk markers among adults with increased risk of T2DM. We found no beneficial effect of salmon fish protein supplementation on markers related to glucose tolerance, serum lipids, weight or blood pressure compared with the placebo group. The present study does not support the hypothesis that daily intake of a salmon fish protein supplement (7·5 g/d) for 8 weeks improves glucose tolerance in persons with increased risk of T2DM.
To the best of our knowledge, this is the first clinical trial exploring the health effect of a fatty fish protein supplement in adults with elevated blood glucose levels.
Few clinical trials, of which three were randomised controlled trials (RCT) ongoing for 6–12 weeks, have investigated health effects of protein supplements from fatty fish(Reference Framroze, Vekariya and Swaroop26,Reference Hovland, Leikanger and Stokkeland31,Reference Nenseter, Østerud and Larsen32) . In line with the results in the present study, no between-group differences in markers related to glucose regulation or lipid metabolism were observed in overweight adults (n 77) assigned to 2·5 g of protein/d (8 weeks) from either herring, salmon, cod or casein/whey, except from lower glucose AUC in the casein/whey group than the salmon group(Reference Hovland, Leikanger and Stokkeland31) nor did Nenseter et al. observe improvement in risk factors for CHD in adults with hypercholesterolemia (n 70) from 10 g of fish powder/d (12 weeks) from herring in patients following the National Cholesterol Education Program Step I Diet(Reference Nenseter, Østerud and Larsen32). In contrast, an RCT on lean fish protein in overweight adults (n 34) assigned to a cod protein supplement (3 g/d for 4 weeks and 6 g/d for 4 weeks) demonstrated lower fasting glucose and glucose, insulin and C-peptide after a 2-h OGTT in the cod supplement group than the placebo group(Reference Vikoren, Nygard and Lied29). However, these findings were not supported in a later RCT conducted by the same research group in overweight or obese adults (n 42) consuming 6 g of protein/d (8 weeks) from cod residuals(Reference Vildmyren, Cao and Haug38). An RCT in overweight adults (n 110) on 1·4 or 2·8 g/d (90 d) of blue whiting protein hydrolysate given as part of a food supplement significantly improved body composition, decreased body weight, and increased cholecystokinin and glucagon-like peptide-1 compared with whey protein(Reference Nobile, Duclos and Michelotti28). Both doses provided equal results. None of the RCT using fish protein supplements has found between-group effects on markers related to glucose tolerance. However, investigating the acute effect of fish protein supplementation, a double-blind crossover post-prandial trial in healthy participants (n 41) found that 20 mg of cod protein hydrolysate/kg body weight consumed before a standardised breakfast meal reduced post-prandial insulin concentrations, without affecting blood glucose, compared with casein(Reference Dale, Jensen and Hausken25). In addition to the use of different protein doses between the studies, different fish species have different amino acid composition that may explain the inconsistent results. Including large amounts of fish in the diet, between-group effects are reported on insulin sensitivity and post-prandial C-peptide in studies with lean fish(Reference Ouellet, Marois and Weisnagel11,Reference Aadland, Graff and Lavigne12) . Salmon consumed as whole fillets (750 g/week) have shown improved post-prandial glucose response and less increase in C-peptide response in an RCT in overweight or obese adults (n 65) compared with cod fillet (8 weeks)(Reference Helland, Bratlie and Hagen39). In the present study, participants reported a protein intake of about 93 g/d (results not shown). In addition, the fish protein capsules provided 5·2 g of protein/d for participants in the fish protein group, the same protein amount as in approximately 25 g of salmon fillet (175 g/week). These results suggest that the daily dose of fish protein provided in the present study may be too low to detect an effect and indicate that fish protein may have to be consumed in larger amounts than what a supplement can provide.
In the present study, the participants in the fish protein group had a non-significant weight gain and less reduction in reported energy intake during the intervention period compared with the placebo group. In contrast, Framroze et al. found that 16 g of salmon protein hydrolysate/d consumed together with breakfast, in a 6-week RCT in overweight participants (n 48), reduced BMI by 5·6 % compared with whey protein isolate, which did not affect weight(Reference Framroze, Vekariya and Swaroop26). In addition, similar to the use of different fish species and protein doses, different protein sources used as control diets make it difficult to compare results. Most intervention studies have compared lean fish with fatty fish or a non-seafood diet containing equal amounts of protein from lean meat, poultry, eggs and dairy products.
Although daily intake of a salmon fish protein supplement did not improve the cardiometabolic risk markers we investigated in the present study, we did not detect any harmful effects of the supplement. The High Level Panel of Experts on Food Security and Nutrition has presented utilisation of by-products as one of the solutions to reduce food losses and waste(Reference Timmermans, Ambuko and Belik40). Thus, the potential for fish by-products utilised for human consumption should be further investigated, for example, adding fish protein to food products.
Norway is one of the world’s largest aquaculture and fishing nations. In 2018, 27 % of all catch from the fishery and aquaculture industry ended as by-products, mainly utilised for animal feed production(Reference Richardsen, Myhre and Nystøyl41). Only 13 % of the by-products are used for human consumption(Reference Richardsen, Myhre and Nystøyl41). In a sustainability perspective, it is important to explore available food resources at our disposal. With the expected growth in the aquaculture industry, protein-rich by-products will become even more available. Such by-products should ideally be utilised for human consumption(Reference Le Gouic, Harnedy, FitzGerald, Mérillon and Ramawat42).
Bastos et al. found that adding fish residue flour to wheat bread resulted in products with higher content of protein, essential fatty acids and minerals, and lower contents of carbohydrates(Reference Bastos, Tavares and de Sousa Gomes Pimenta43). The sensory acceptancy for bread with fish residue flour was better than or as good as bread without fish flour. Groups that could benefit from enriched products are those with increased protein needs, if ensuring high-quality protein in the final product.
The strengths of the FishMeal human intervention study is the randomised controlled double-blind design and the frequent follow-up of the participants. The inclusion of participants with increased risk of T2DM, and thus potentially high benefit of a supplement influencing glucose tolerance, is a strength compared with other studies on fish protein(Reference Dale, Jensen and Hausken25,Reference Vikoren, Nygard and Lied29,Reference Hovland, Leikanger and Stokkeland31,Reference Vildmyren, Cao and Haug38) . A strength of the study is also that we performed a post-prandial uptake study to investigate that the fish protein capsules were taken up by the body. The main limitation of the present study is that we did not fulfil our power calculations indicating that 100 participants needed to complete the study to detect a clinically relevant difference between the two groups of 0·4 mmol/l in 2-h OGTT-s-glucose at the end-of-study visit. However, an increase in 2-h OGTT-s-glucose of 0·48 mmol/l (not significant) from intake of fish protein among seventy-four participants with increased levels of either fasting s-glucose, 2-h OGTT-s-glucose or HbA1c decreases the risk of a type II error. In addition, the use of FFQ as a dietary registration method to register changes in the diet during the intervention must be pointed out as a limitation of the study. However, as the intervention consisted of taking a supplement and the participants were instructed not to change their dietary habits, we did not expect any dietary changes.
In conclusion, in the present study, a daily intake of 7·5 g of salmon fish protein did not affect glucose tolerance markers among participants with increased risk of diabetes. However, in a sustainability perspective, salmon fish protein utilised for human consumption could be a valuable protein supplement or ingredient.
Acknowledgements
The authors gratefully acknowledge the participants who volunteered to the present study. We would like to thank Anne Lene Nordengen, Anne Marte Wetting Johansen, Anne Randi Enget, Azita Rashidi, Ingunn Musum Jermstad, Jason Matthews, Jurate Saltyte-Benth, Kjetil Retterstøl, Linn Kristin Lie Øyri, Nada Abedali, Synne Risan Sævre and Viviana Paz Sandoval for their contribution in the conduct of the project.
The study received financial support from the University of Oslo and FHF – Norwegian Seafood Research Fund, Oslo, Norway.
K. S. H., I. O., K. T. D., T. S., S. M. U. and K. B. H. conceived and designed the study; K. S. H., I. O., M. H., N. A. S. and M. S. conducted the study; K. S. H., I. O., S. M. U. and K. B. H. performed the statistical analyses and interpreted the results; K. S. H., I. O., S. M. U. and K. B. H. wrote the manuscript and had primary responsibility for the final content. All authors have critically reviewed the manuscript.
During the past 5 years, S. M. U. has received research grants from Mills DA, TINE BA and Olympic Seafood, none of which are related to the content of this manuscript. During the past 5 years, K. B. H. has received research grants or honoraria from Mills DA, TINE BA, Olympic Seafood, Amgen, Sanofi and Pronova, none of which are related to the content of this manuscript. K. S. H., I. O., M. H., K. T. D., T. S., N. A. S. and M. S. have no conflicts of interest.
Supplementary material
To view supplementary material for this article, please visit https://doi.org/10.1017/S0007114521000040


