


Introduction
Rapid diagnosis is critical to monitoring herbicide-resistant weeds, allowing a proactive response before the dissemination of the resistance alleles. A common practice to evaluate the spread of herbicide resistance is to do routine and massive surveys of weed populations from different geographic locations (Evans et al. Reference Evans, Tranel, Hager, Davis, Schutte, Wu, Chatham and Davis2016; González-Torralva et al. Reference González-Torralva, Norsworthy, Piveta, Varanasi, Barber and Brabham2020; Westra et al. Reference Westra, Nissen, Getts, Westra and Gaines2019). These surveys have been done solely through time-consuming and labor-intensive greenhouse herbicide efficacy trials or a combination of greenhouse trials with molecular marker assays (Chatham et al. Reference Chatham, Wu, Riggins, Hager, Young, Roskamp and Tranel2015; Salas-Perez et al. Reference Salas-Perez, Burgos, Rangani, Singh, Refatti, Pivetam, Tranel, Mauromoustakos and Scott2017; Schultz et al. Reference Schultz, Chatham, Riggins, Tranel and Bradley2015; Varanasi et al. Reference Varanasi, Brabham, Norsworthy, Nie, Young, Houston, Barber and Scott2018; Wu et al. Reference Wu, Goldsmith, Pawlak, Feng, Smith, Navarro and Perez-Jones2020a). A more rapid assay requiring fewer technical skills (e.g., molecular assays) will enable more weed science labs to conduct weed resistance surveys regularly and more efficiently. Furthermore, the destructive nature of the greenhouse herbicide screens requires researchers to spray separate sets of plants, generate progeny, or create clones for other research activities, such as testing for multiple resistance or investigating resistance mechanisms. In contrast, a nondestructive herbicide-resistance diagnostic assay will give weed scientists more flexibility in weed resistance research and will simplify the process for weed surveys for multiple resistance.
Multiple replacements for the traditional greenhouse whole-plant assay have been explored, such as seed germination assays, agar-based seedling assays, pollen germination tests, and DNA-based assays (Burgos et al. Reference Burgos, Tranel, Strebig, Davis, Shaner, Norsworthy and Ritz2013). A rapid nondestructive assay with excised leaf disks was also used by previous researchers but was limited to herbicides with well-characterized modes of action and involved complicated quantification methods such as chloroplast extraction to measure enzymatic activities (Gerwick et al. Reference Gerwick, Mireles and Eilers1993; Hanson et al. Reference Hanson, Shrestha and Shaner2009; Shaner et al. Reference Shaner, Nadler-Hassar, Henry and Koger2005). To identify simpler and more cost-effective methods with lower technical requirements, we propose the use of photosynthetic efficiency (chlorophyll fluorescence) in quantitative characterization of herbicide response through a single weed leaf disk (Juneau et al. Reference Juneau, Qiu and Deblois2007; Lakra et al. Reference Lakra, Nutan, Das, Anwar, Singla-Pareek and Pareek2015). This assay is based on a commonly used plant stress measurement: the F v/F m test (Maxwell and Johnson Reference Maxwell and Johnson2000; Oxborough and Baker Reference Oxborough and Baker1997), where variable fluorescence (F v) is the difference between maximum fluorescence (F m) and minimum fluorescence (F o) as plants are exposed to different levels of modulated light during measurement. F v/F m ratio represents the maximum quantum yield, which indicates the probability that the light energy absorbed by plant leaves will be used for photosynthesis (Baker Reference Baker2008; Oxborough and Baker Reference Oxborough and Baker1997). The optimal F v/F m values for many plant species range from 0.79 to 0.84, and the greater the plant stress, the lower the F v/F m ratios are, as well as the leaf area that is actively photosynthesizing (Maxwell and Johnson Reference Maxwell and Johnson2000). To quantify herbicide stress using the F v/F m test, leaf disks of actively growing weed seedlings are excised and incubated in different doses of herbicide solutions on microplates. The plates are then scanned within 48 h in a chlorophyll fluorescence imager that returns both imaging and quantification data (e.g., leaf areas that are actively photosynthesizing, F v/F m values). Our hypothesis is that leaf disks from resistant plants are less affected by herbicide challenge and are thus able to maintain higher photosynthetic efficiency (e.g., higher F v/F m values and bigger leaf areas with open photosystem II [PSII] centers) compared with susceptible plants.
The goal of the current study is to validate the feasibility of using chlorophyll fluorescence (F v/F m ratios) to determine the resistance status of a plant and compare its prediction accuracies with the results from a whole-plant spray test. In the current study, we validated the assay on both contact and systemic herbicides from three herbicide modes of action: (1) fomesafen (protoporphyrinogen oxidase [PPO] inhibitor); (2) glyphosate (5-enolpyruvylshikimate-3-phosphate synthase inhibitor); and (3) dicamba (synthetic auxins). The assay was conducted on multiple populations of four weed species: waterhemp [Amaranthus tuberculatus (Moq.) Sauer], Palmer amaranth (Amaranthus palmeri S. Watson), goosegrass [Eleusine indica (L.) Gaertn.], and kochia [Bassia scoparia (L.) A.J. Scott]. We investigated the following key questions: (1) Is the assay able to detect resistance to both contact and systemic herbicides, including herbicides that do not directly target plant photosynthesis? (2) What are the discriminating doses that distinguish resistant plants from susceptible plants for each herbicide? (3) Is the assay able to distinguish resistant and susceptible plants at both population and individual-plant levels? Results from the validation studies and suggested usage and optimization strategies will also be discussed.
Materials and Methods
Plant Materials
About 250 plants from 23 Amaranthus spp. populations (19 A. palmeri and 4 A. tuberculatus) with varied fomesafen resistance levels (eight high-, eight moderate-, four low-resistance and three sensitive populations) were collected from eight U.S. states (TN, AR, OK, MS, AR, IL, IA, and MO) and used to validate the leaf-disk assay for fomesafen (4 to 16 plants per population). Forty-five plants from four glyphosate-resistant or glyphosate-sensitive A. palmeri or A. tuberculatus populations were used to validate the glyphosate leaf-disk assays on broadleaf weeds (Table 1). Details of the populations are listed in Supplementary Table S1. Eighty plants from five previously characterized glyphosate-resistant or glyphosate-sensitive E. indica populations from Malaysia and Missouri, USA (Baerson et al. Reference Baerson, Rodriguez, Tran, Feng, Biest and Dill2002; Yu et al. Reference Yu, Jalaludin, Han, Chen, Sammons and Powles2015), were used to validate the glyphosate leaf-disk assays for grass weeds. Forty-six plants from two previously characterized B. scoparia lines (9425 and WT) (Wu et al. Reference Wu, LeClere, Liu, Paciorek, Perez-Jones, Westra and Sammons2020b) were used to validate the leaf-disk assay for dicamba. The segregating 9425 B. scoparia line has an IAA16 mutation that endows dicamba resistance resulting in three genotypes: homozygous-resistant (RR), heterozygous-resistant (RS), and homozygous-susceptible (SS). Bassia scoparia plants were genotyped using the method described in LeClere et al. (Reference LeClere, Wu, Westra and Sammons2018). Our rationales for sample size calculation are listed in Supplementary Table S2.
Table 1. Comparison of the results from the leaf-disk assays and the whole-plant spray tests on four weed species across three herbicide sites of action.

a LD, leaf-disk assay, plants were considered resistant if F v/F m ≥ 0.2; WPS, whole-plant spray test, plants were considered resistant if spray injury <90%.
b Results from the two methods were considered concordant when the same resistance results were reported by both methods (e.g., a sprayed plant with <90% visual injury also had an F v/F m value ≥ 0.2).
c Highlighted in bold are discriminating doses with the most negative relationship between F v/F m values and herbicide spray injury data and lowest false-positive/false-negative results.
Resistance Characterization through Whole-Plant Spray Tests
Plants were grown at the Bayer CropScience glasshouse in St Louis, MO (29/26 ± 3 C day/night temperatures, 14/10 h day/night photoperiods, supplemental lighting to maintain ≥1,050 μmol m−2 s−1 light intensity). Plants at 8- to 10-cm height were sprayed with 560 g ha−1 of dicamba (XtendiMax®, Bayer CropScience, 700 Chesterfield Parkway W, St Louis, MO 63017, USA), 420 g ha−1 of fomesafen (Flexstar®, Syngenta Crop Protection, LLC, P.O. Box 18300, Greensboro, NC 27419, USA) with 1% v/v crop oil concentrate (COC), or 1,260 g ha−1 of glyphosate (Roundup PowerMax®, Bayer CropScience). Herbicides were applied using a research track sprayer calibrated to deliver 140 L ha−1 of herbicide solution at 276 kPa, moving at 2.57 km h−1. Dicamba was sprayed with a TTI spray nozzle (TeeJet® spray nozzles, TeeJet Technologies, 204 Kilcott Ct. Louisville, KY 40245, USA), while fomesafen and glyphosate were sprayed with a flat-fan nozzle (XR9501E, TeeJet®). Plant visual injury was evaluated at 14 or 21 d after treatment (DAT) using the scale of 0% to 100%, with 0% indicating no visual injury compared with untreated plants and 100% indicating plant death.
Resistance Characterization through Leaf-Disk Assays
Analytical reference standards of fomesafen (CAS no. 72178-02-0, 250 mg) and glyphosate (CAS no. 1071-83-6, 100 mg) were purchased from Sigma-Aldrich (Milwaukee, WI, USA). Analytical standards of dicamba were produced in house at Bayer CropScience). Stock solutions (10 mM) of different herbicides were dissolved in deionized water (glyphosate and dicamba) or acetone (fomesafen). These stock solutions were diluted in leaf-disk assay buffer for desirable doses (the final concentration of acetone in 100 µM fomesafen solution was 1%). The leaf-disk buffer was made up with 1 mM MES and 1% sucrose with a pH of 6.5 (CAS no. 1266615-59-1; CAS no. 57-50-1, Sigma-Aldrich, St. Louis, MO, USA) for desirable doses. The doses used for each herbicide are listed in Table 1.
At 24 h before herbicide was sprayed, leaf disks were excised from the youngest fully unfolded green leaves and used for the leaf-disk assay. Leaf punches were taken using disposable 4-mm (E. indica) and 5-mm (broadleaf) biopsy punches (4 mm: 33-34-P/25; 5 mm: 33-35; Integra™ Miltex®, Integra LifeSciences, 1100 Campus Road, Princeton, NJ 08540, USA). Only the 4-mm punch comes with plunger system, so a thin metal wire was used to gently remove the 5-mm leaf disks from the punch. A tweezer was used to gently place individual leaf disks onto 96-well microplates (cat. no. 92096, 96F, TPP Techno Plastic Products AG, Zollstraße 7, 8219 Trasadingen, Switzerland) prefilled with 200 µl per well of leaf assay buffer or herbicide solution. The leaf disks were allowed to float on the surface of the buffer or herbicide solution with the adaxial surface facing upward.
The leaf disks were then placed into a growth chamber programmed as follows: day/night temperature: 14/10 h; 25/24 C; humidity: 50%; and light intensity: 180 to 250 μmol m−2 s−1. Before data collection, the plates were wrapped in aluminum foil and dark adapted for 20 min. Photosynthetic efficiency indicators such as F v/F m values and leaf area of active PSII reaction center were measured through a chlorophyll fluorescence imager (Technologica CF Imager, Technologica Ltd, FOURWAYS Bromley Road, Frating, Colchester, Essex CO7 7DP, UK) (Figure 1). Data were exported from the CF imager and analyzed in Excel. To determine the best evaluation timing for different herbicides, we first did a time-course study to incubate and collect chlorophyll fluorescence data at multiple time points for up to 48 h. All dose–response studies were repeated, with majorities of the populations included in the repeated studies.

Figure 1. Overview of the study to validate the leaf-disk assay through the comparison with the whole-plant spray test. Two data points for each leaf disk were exported from the chlorophyll fluorescence imager: leaf area (mm2) and F v/F m values (0–0.8) (e.g., Cell A1, leaf area = 18.05 mm2, F v/F m = 0.636).
Data Visualization and Statistical Analysis
The data from the whole-plant spray tests and the leaf-disk assays were compared at both the individual plant and population levels (Figure 1). Scatter plots and regression lines showing the correlation between F v/F m values or leaf areas and visual injury from the spray tests were generated in R (v. 3.5.1, R Foundation for Statistical Computing, Vienna, Austria) using the ggplot2 package. Pearson’s correlation coefficients were calculated from the regression lines for each herbicide dose. Violin plots and box plots were generated for fomesafen, glyphosate (E. indica), and dicamba data to show the variance of the F v/F m values both before and after herbicide incubation. Bar charts showing means of F v/F m, spray injury, and leaf area for each Amaranthus population were also generated to compare the two herbicide diagnostic methods at the population level for fomesafen.
Phenotypic results from the leaf-disk assay were compared with whole-plant spray tests at discriminating doses at the individual plant level using the following standards: plants were identified as resistant if visual injury was <90%, F v/F m raw values were ≥0.2, or F v/F m values of the treated plants expressed as a percentage of the untreated control were >25%. Results from the two methods were considered concordant when the same resistance results were reported by both methods (e.g., a sprayed plant with <90% visual injury also had an F v/F m value ≥0.2).
Results and Discussion
Evaluation Timing for Fomesafen, Glyphosate, and Dicamba
The time course study that measured leaf-disk chlorophyll fluorescence at different time points during a 48-h incubation time suggests that the best incubation or evaluation timings for fomesafen, glyphosate, and dicamba were 4 to 24 h, 24 to 48 h, and 36 to 48 h, respectively (Figure 2). For a fast-acting herbicide like fomesafen, sensitive plants lost chlorophyll fluorescence signals rapidly. The separation among resistant and susceptible plants was observed as early as 4 h, while it took at least 24 to 36 h for glyphosate and dicamba to produce distinguishable symptoms. The order of how fast the herbicide symptoms developed for the leaf-disk assay was consistent with the whole-plant spray tests: fomesafen > glyphosate > dicamba. For PPO herbicides that directly target plant photosynthesis and inhibit the biosynthesis of chlorophyll (Beale and Weinstein Reference Beale, Weinstein and Dailey1990), the leaf disks of sensitive plants can be bleached due to chlorophyll degradation. This indicates that visual ratings might be conducted without subjecting the plates to CF imager scanning (Figure 3). However, the leaf disks of glyphosate- or dicamba-sensitive plants largely stayed green, even though chlorophyll fluorescence was absent (Figure 4; Supplementary Figures S1 and S2). These results also indicate that although the leaf-disk assay was built upon the photochemistry of the PSII system (Murchie and Lawson Reference Murchie and Lawson2013), it showed promise in detecting resistance to systemic herbicides that do not directly target plant photosynthesis.

Figure 2. Forty-eight-hour time course images of leaf-disk chlorophyll fluorescence and photos of plants sprayed with glyphosate, dicamba, and fomesafen. One leaf disk was sampled from each of the four sprayed plants (1–4) and chlorophyll fluoresence images were taken 12 h after dark incubation and 4, 8, 12, 24, 36, and 48 h after light incubation. The best evaluation timing for each herbicide was determined when distinguishable chlorophyll fluorescence signals produced by plants aligned with herbicide sensitivities determined through whole-plant spray tests.

Figure 3. Leaf-disk chlorophyll fluorescence images and photos of Amaranthus plants sprayed with fomesafen. Plants 1–11 represent individual plants from 11 different Amaranthus populations. The top panels are photos of the leaf disks taken before incubation and 24 h after being incubated in herbicide solutions under light. The middle panels are corresponding chlorophyll images for leaf disks in the top panel. The bottom panel shows photos of sprayed plants from which the leaf disks were sampled (4 leaf punches per plant).

Figure 4. Leaf-disk chlorophyll fluorescence images and photos of Eleusine indica populations sprayed with glyphosate. R-1, R-2, and S1–S3 represent two glyphosate-resistant and three sensitive E. indica populations, respectively; 1–4 represent leaf disks from four individual plants from each E. indica population. The top panels are photos of the leaf disks taken before incubation and 36 h after being incubated in herbicide solutions under light. The middle panels are corresponding chlorophyll images for the leaf disks in the top panel. The bottom panel shows photos of sprayed plants from which the leaf disks were sampled (4 leaf punches per plant).
Effective Doses for Fomesafen, Glyphosate, and Dicamba
Effective doses for different herbicides varied. For fomesafen, sensitive plants were unable to survive the lowest dose tested: the leaf disks of the resistant plants still had strong fluorescence at a dose up to 100 µM, while the leaf disks of the sensitive plants had weak fluorescence signals at the lowest dose of 10 µM (e.g., plants 3 and 8 in Figure 3). Results from the leaf-disk assay largely agreed with the phenotypes of sprayed plants determined 14 d after herbicide treatment (Figure 3). For glyphosate, strong correlation between the two methods was only observed for E. indica but not Amaranthus (Figure 4; Supplementary Figures S1 and S3). Glyphosate at 250 µM clearly separated the two resistant E. indica populations from the three sensitive populations. The less-resistant R-1 line also yielded weaker chlorophyll fluorescence signals compared with the R-2 line, indicating the sensitivity of the glyphosate leaf-disk assay to distinguish E. indica populations with varying levels of resistance (Figure 4). For dicamba, no difference was observed at 250 µM. All the RR plants and some RS plants survived the highest dose of 800 µM, while none of the SS or WT plants produced chlorophyll fluorescence signals, suggesting 800 µM can be used as a discriminating dose for dicamba-resistant and dicamba-susceptible B. scoparia plants with the known IAA16 mutation (Supplementary Figure S2). However, more fine-tuned dose–response studies might be needed to identify a dose that distinguishes between RR and RS plants.
Correlation between Fv/Fm Values and Herbicide Spray Injuries
Regression analysis (Figure 5) confirmed that there were significant negative correlations between the F v/F m values and the herbicide injuries for fomesafen, glyphosate (E. indica), and dicamba. For fomesafen (Figure 5A), the slopes of the regression lines were significant across all doses, with 10 µM having the strongest negative correlation (R = −0.41, P < 0.0001). For dicamba (Figure 5B), the slopes of the regression lines were only significant for the highest dose of 800 µM, with a negative slope value of −0.44 (P = 0.0023). For glyphosate, none of the regression lines for Amaranthus were significant (Figure 5C), indicating the response of the leaf disks did not align with the response of the whole plant in the spray tests. In contrast, significant regression relations were observed for E. indica with slopes ranging from −0.77 to −0.92 (Figure 5D) and 250 µM having the most negative slope (P < 0.0001). Similar results were observed for F v/F m expressed as percentage of untreated plants, as well as leaf area data (Supplementary Figure S3).The 10, 250, and 800 µM doses were thus used as discriminating doses for fomesafen, glyphosate (E. indica), and dicamba, respectively, for our down-stream analysis at both the individual plant and population levels.
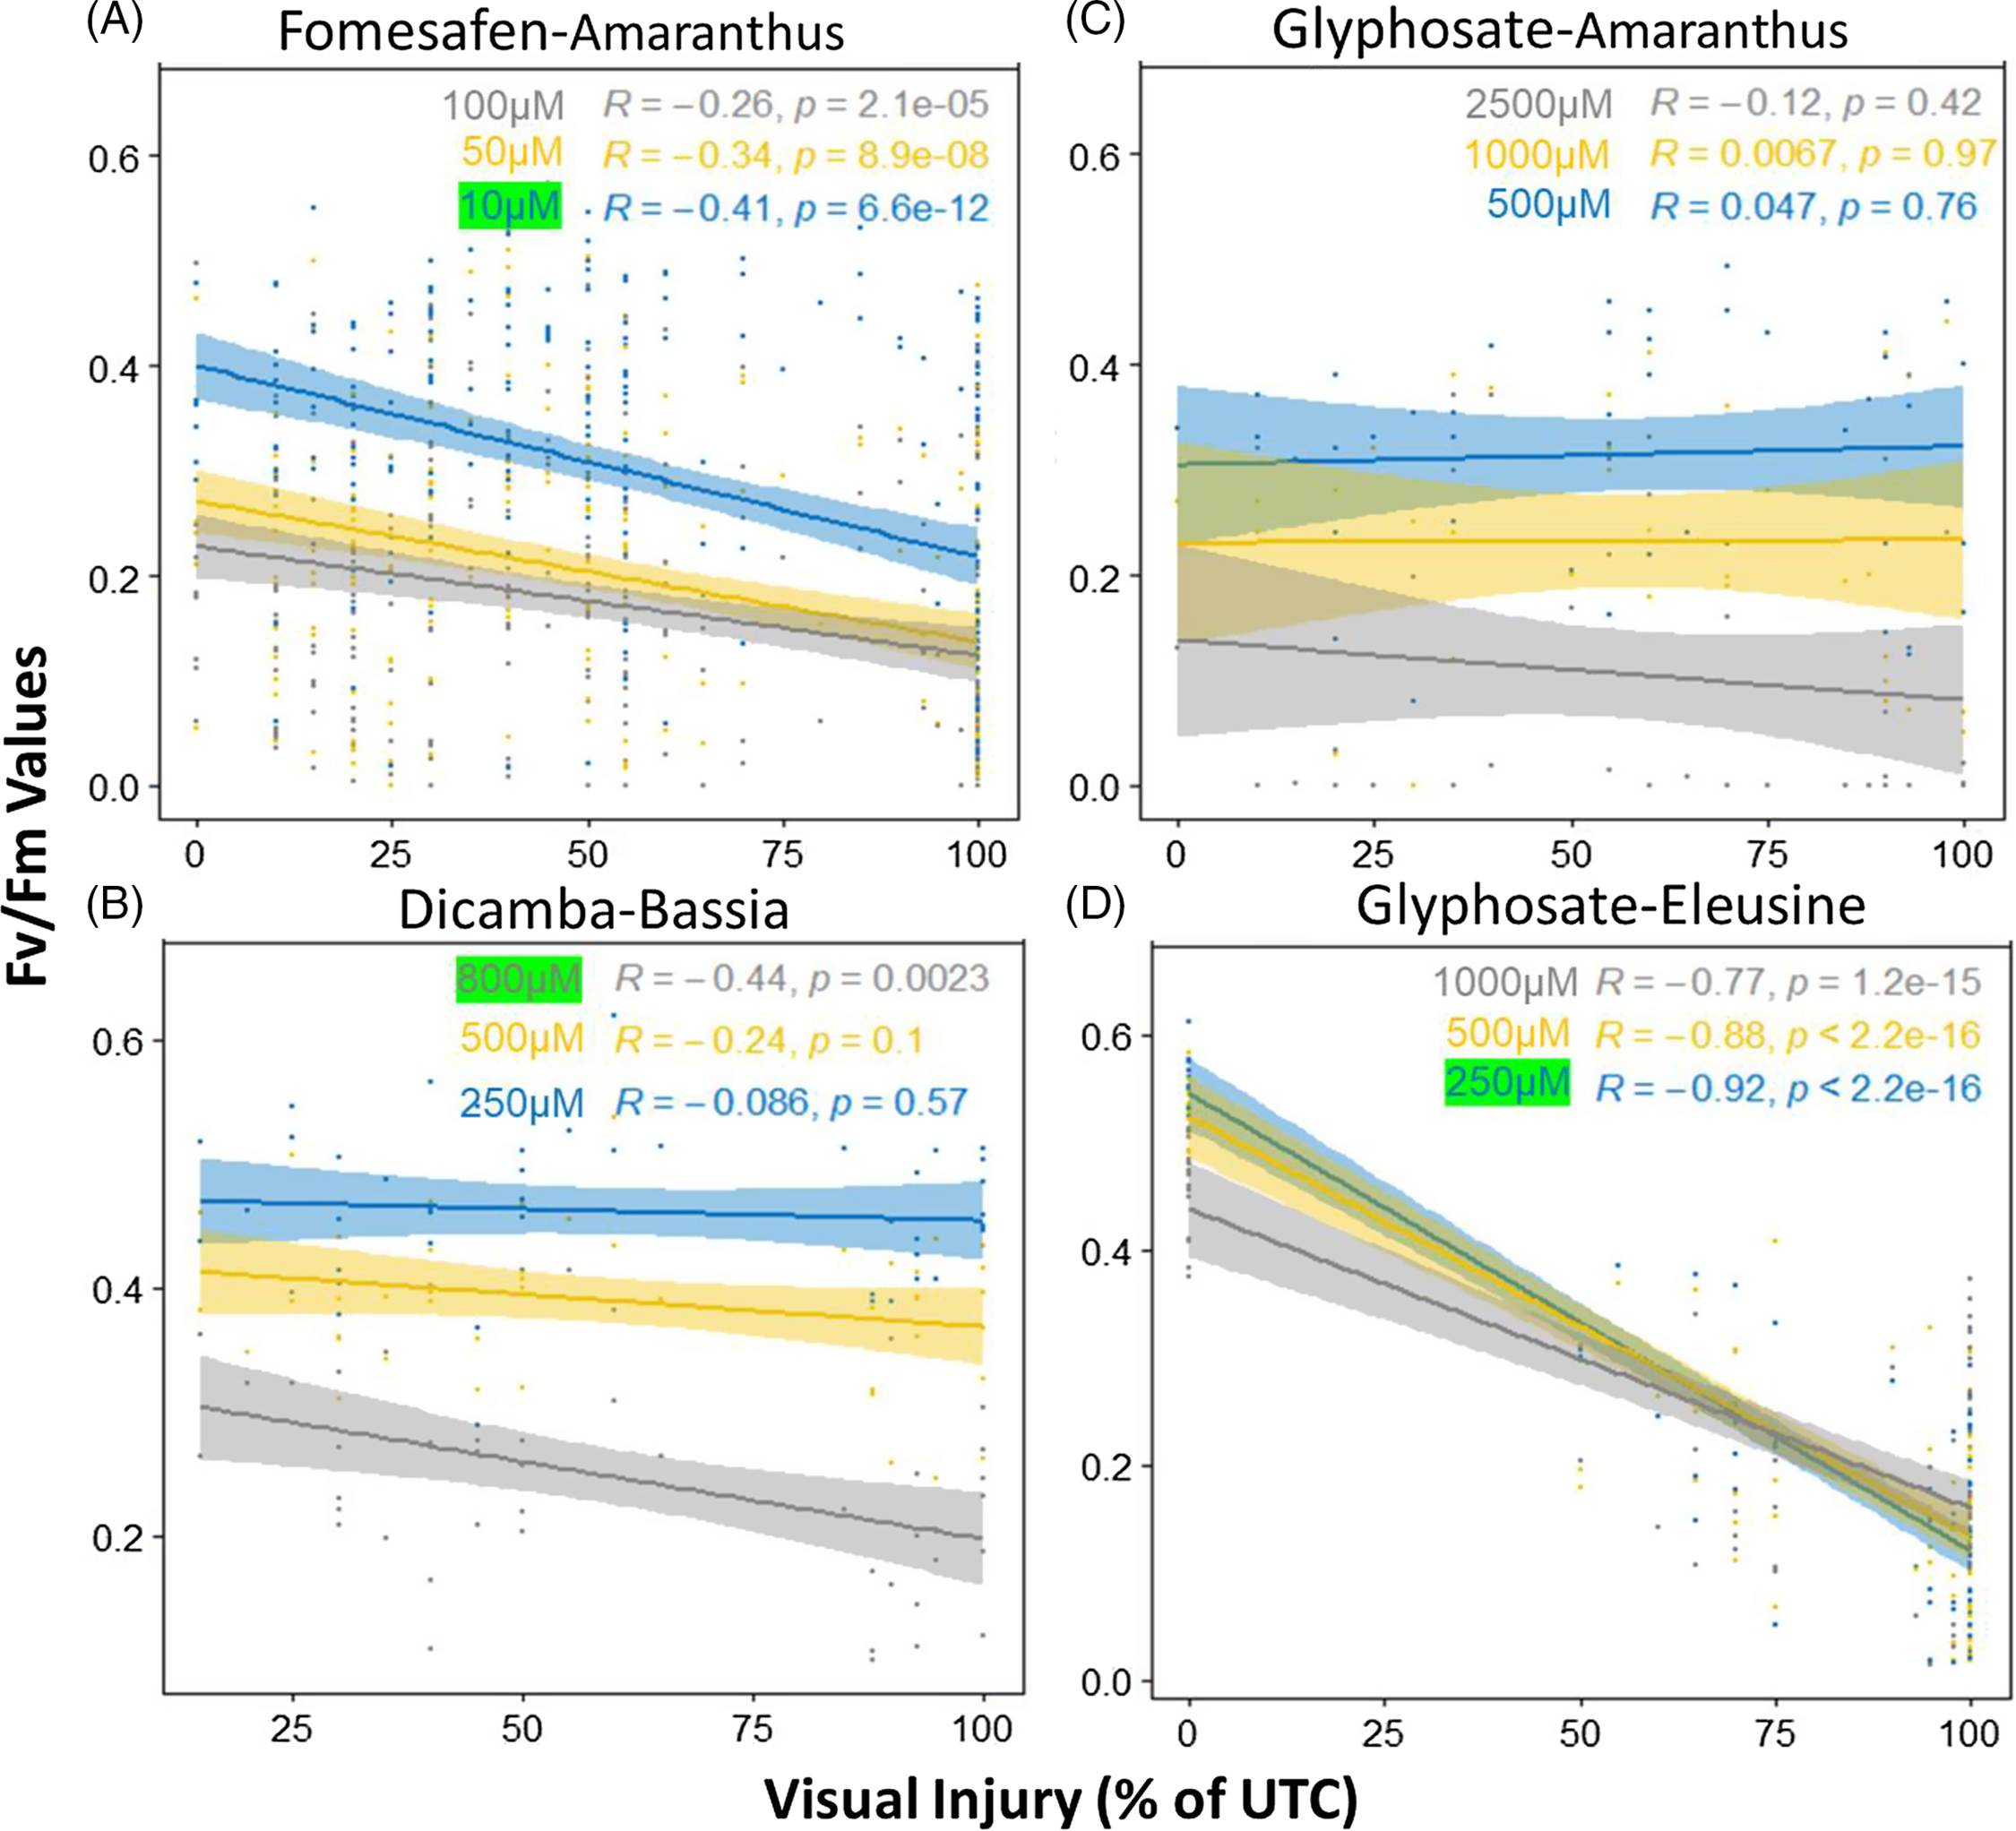
Figure 5. Regression lines showing the correlation between the F v/F m values with spray visual injuries. (A) Fomesafen–Amaranthus doses: 0, 10, 50, 100 µM; (B) dicamba–Bassia scoparia doses: 0, 250, 500, 800 µM; (C) glyphosate–Amaranthus doses: 0, 500, 1,000, 2,500 µM; (D) glyphosate–Eleusine indica doses: 0, 250, 500, 1,000 µM. In each figure, different-colored regression lines indicate doses from low to high: blue, yellow, and gray.
The differences between the glyphosate leaf-disk assay on E. indica and Amaranthus might be related to different genetic diversity and biological response to glyphosate in different species. For example, Cañero et al. (Reference Cañero, Cox, Redondo-Gómez, Mateos-Naranjo, Hermosín and Cornejo2011) showed that glyphosate treatment had no effect on photosystem II photochemistry of young olive (Olea europaea L.) plants and observed no reduction in F v/F m values. However, Vivancos et al. (Reference Vivancos, Driscoll, Bulman, Ying, Emami, Treumann, Mauve, Noctor and Foyer2011) observed rapidly inhibited photosynthesis and decreased F v′/F m′ values in glyphosate-sensitive soybean [Glycine max (L.) Merr.]. Furthermore, the lower genetic diversity in a monoecious grass weeds compared with outcrossing dicot weeds like Amaranthus (Chandi et al. Reference Chandi, Milla-Lewis, Jordan, York, Burton, Zuleta, Whitaker and Culpepper2013; Shukla et al. Reference Shukla, Srivastava, Suneja, Yadav, Hussain, Rana and Yadav2018), might also contribute to the more uniform leaf-disk herbicide response we observed.
It is also possible that as a simplified testing system that focuses on the target organelle of the plants (chloroplast), the leaf-disk assay is more effective in detecting target site–based resistance (TR) than non–target site based resistance (NTR). Interestingly, for the E. indica, B. scoparia, and Amaranthus populations we tested for glyphosate, dicamba, and fomesafen, target-site mutations were the main underlying resistance mechanism (Baerson et al. Reference Baerson, Rodriguez, Tran, Feng, Biest and Dill2002; LeClere et al. Reference LeClere, Wu, Westra and Sammons2018; Wu et al. Reference Wu, Goldsmith, Pawlak, Feng, Smith, Navarro and Perez-Jones2020a, Reference Wu, LeClere, Liu, Paciorek, Perez-Jones, Westra and Sammons2020b; Yu et al. Reference Yu, Jalaludin, Han, Chen, Sammons and Powles2015). If NTR mechanisms such as reduced uptake and translocation are involved (Heap and Duke Reference Heap and Duke2018; Sammons and Gaines Reference Sammons and Gaines2014), the response of the resistant and sensitive plants at the chloroplast/PSII system level might be similar and thus prevent the leaf-disk assay from capturing their differences.
The Sensitivities of the Leaf-Disk Assay in Distinguishing Resistance at the Population Level
To determine whether the leaf-disk assay can effectively distinguish resistant and sensitive weed populations, violin and box plots were projected to show the distribution and changes of the F v/F m values both before and after the incubation of herbicides at the discriminating doses (Figure 6). For the 23 Amaranthus populations tested for fomesafen, the majority of the populations had starting F v/F m values ranging from 0.4 to 0.6, with a few populations having lower F v/F m values (∼0.3), indicating these populations might be associated with a lower fitness. Higher F v/F m values were observed for E. indica (0.45 to 0.7) and B. scoparia (0.5 to 0.7) in general. This indicates that converting final F v/F m values of treated plants to a percentage of the untreated plants might be necessary to account for the variance of the starting values of F v/F m in different weed populations, or different threshold values might be set to distinguish resistant versus susceptible plants from different populations.

Figure 6. Violin and box plots showing F v/F m values before and after herbicide treatment and spray injuries across different weed–herbicide combinations. “F v_F m_treated” represent the F v/F m values of distinguishing dose: fomesafen (Amaranthus) 10 µM, glyphosate (Eleusine indica) 250 µM and dicamba (Bassia scoparia) 800 µM. Twenty-three Amaranthus populations were included for the fomesafen assay: eight high- (HR), eight moderate- (MR), and four low-resistance populations (LR) and three sensitive (S) populations. Five E. indica populations were included for glyphosate, two resistant (R-1, R-2) and three sensitive populations (S-1, S-2, S-3). Four B. scoparia genotypes with or without the resistance-endowing mutation were included for dicamba: homozygous- (RR), heterozygous-resistant (RS), homozygous sensitive (SS), and WT. UTC, untreated control.
Herbicide incubation significantly reduced F v/F m values. For fomesafen, low resistance and sensitive populations were consistently associated with lower F v/F m values, while highly and moderately resistant populations were able to maintain F v/F m values around 0.2 to 0.5 after herbicide treatment (Figure 6; Supplementary Figure S4). We also calculated the means of F v/F m and spray injuries across all 23 Amaranthus populations we tested (Figure 7). Based on different resistance levels, the 23 populations were divided into four categories: high- (HR-1 to HR-8, <50% spray injury), moderate- (MR-1 to MR-8, 50% to 80% spray injury), and low-resistance (LR-1 to LR-4, 80% to 90% spray injury) and sensitive (S-1 to S-3, >90% spray injury). Using a sustained 25% F v/F m signal (that of an untreated leaf) as our threshold value, the fomesafen leaf-disk assay (10 µM dose) clearly separated all the high-resistance and most moderate-resistance populations (Figure 7). However, the two methods yielded different results for the low-resistance and sensitive populations, with some susceptible populations having higher F v/F m than observed for the resistant plants (e.g., LR-3, S-1)

Figure 7. Bar charts showing means of F v/F m values, leaf areas, and spray injuries across different fomesafen doses and Amaranthus populations. Each figure represents means of F v/F m, actively photosynthesizing leaf area expressed as percentage of untreated leaf, and spray injury data across different fomesafen doses (10, 50, 100 µM) for 23 Amaranthus populations: eight high- (HR), eight moderate- (MR), and four low-resistance populations (LR) and three sensitive populations (S). The dashed lines indicate the threshold values that were used to distinguish resistant vs. susceptible plants: 25% spray visual injury or F v/F m values expressed as percentages of untreated plants. UTC, untreated control.
Similar trends were observed for glyphosate in E. indica and dicamba in B. scoparia. The F v/F m values were two to three times higher in the two resistant E. indica populations compared with the three sensitive populations (Figure 6). Slightly more overlaps were observed for different dicamba-resistant and dicamba-sensitive B. scoparia populations (Figure 6). Because only B. scoparia populations with TR were used in the current study, more research is needed to expand the application of this assay to more diverse B. scoparia field populations. Overall, our results indicate that the leaf-disk assay was effective in distinguishing resistant and sensitive populations for all the three herbicides tested.
The Sensitivities of the Leaf-Disk Assay in Distinguishing Resistance at the Individual Plant Level
Further comparison of the two diagnostic methods for resistance showed similar results at the individual plant level compared with the population-level characterization, but with a higher level of variance (Table 1). For the 241 plants sprayed with fomesafen, results from the two methods aligned with each other for 85.5% of the plants (10 µM). Among the remaining 14.5%, 7.9% could be attributed to false-positive results from the leaf-disk assay (e.g., plants with >90% spray injury [identified as sensitive], but F v/F m values >0.2 [identified as resistant]) and 6.6% could be attributed to false-negative results (Table 1; Figure 8; Supplementary Figures S5–S7). For the 80 E. indica plants prayed with glyphosate, the two methods aligned with each other in 92.3% of the plants (250 µM), and of the remaining 7.7%, 1.3% could be attributed to false-positive results from the leaf-disk assay, and 6.4% could be attributed to false-negative results (Table 1; Supplementary Figure S8). Higher discrepancies were observed for the dicamba assay in dicamba–B. scoparia and glyphosate–Amaranthus combinations, for which the two assays only aligned in 71.7% (800 µM) and 71.1% (500 µM) of the cases, respectively (Table 1). Slightly lower concordant rates were observed for F v/F m expressed as percentage of untreated plants (Supplementary Table S3). Comparing concordant rates of data collected at different time points also indicates that evaluation timing and reliable resistant and susceptible controls are critical and will influence the accuracies of the assay (Supplementary Figure S9). Longer incubation time might be needed for some susceptible populations to fully responded to herbicide challenges (i.e., plants with higher leaf chlorophyll concentrations or leaves not in good contact with the herbicide solution).

Figure 8. Leaf-disk chlorophyll fluorescence images and visual injuries of individual Amaranthus plants sprayed with fomesafen. Plants 1–12 in each panel represent an individual plant from 12 different Amaranthus populations (4 replications × 12 populations = 48 plants in total). For each plant, four leaf disks were challenged with different doses of fomesafen (0, 10, 50, 100 µM) and chlorophyll images were taken 24 h after being incubated in herbicide solutions under light. Visual injuries of each plant evaluated 14 d after application of 1X rate of fomesafen are indicated at the top of each panel and colored coded based on resistance levels. The panels on the right are the same images as those in the left panels but with the quantitative data. False-negative (low F v/F m values for resistant plants) and false-positive (high F v/F m values for susceptible plants) results from the leaf-disk assay are highlighted in cyan and magenta rectangles, respectively.
The comparison of two resistance diagnostic methods through regression models, as well as concordant rates at both population and individual levels, suggests more work is needed to improve and optimize the leaf-disk assay for higher sensitivity and prediction accuracies, especially for systemic herbicides such as glyphosate and dicamba. Though characterization of plant stress response through chlorophyll fluorescence emission is a powerful tool, studies have pointed out the potential pitfalls for interpreting the chlorophyll fluorescence data, especially when focusing on a single parameter (Juneau et al. Reference Juneau, Qiu and Deblois2007). Logan et al. (Reference Logan, Adams and Demmig-Adams2007) have suggested using it cautiously as a rapid, preliminary method of assessing plant responses to stress in conjunction with other characterization methods. In the case of a herbicide-resistance survey, an initial screen of all weed accessions with the leaf-disk assay followed by whole-plant spray tests or molecular marker assays could be an intermediate approach to leverage the advantages of this rapid method. Follow-up studies on the resistant accessions identified by the leaf-disk assay can effectively exclude false-positive results.
Future Research Directions on Optimizing the Assay
In the current study, we report a nondestructive leaf-disk assay based on chlorophyll fluorescence emission to enable the detection of resistance to both systemic and contact herbicides within ∼48 h. We demonstrated the feasibility of the assay to rapidly detect resistance to glyphosate, dicamba, and fomesafen in both broadleaf and grass weeds and showed good correlation between data from the greenhouse spray test and the leaf-disk assay. However, the current concordant rates could be improved by optimizing the assay in multiple ways: (1) conduct more fine-tuned dose–response studies across diverse field weed populations to identify more robust discriminating doses for each herbicide (e.g., dicamba–B. scoparia); (2) determine whether dose response is a better proxy than a single dose in making the correct calls for resistance (Supplementary Figure S7, top left panel, plant 9); (3) conduct the assays on resistant weeds with both TR and NTR mechanisms to confirm whether this assay’s applicability is limited to resistant weeds with a TR mechanism; and (4) investigate whether better algorithms could be used to convert the CF images into F v/F m values and leaf area data, as suggested by previous researchers (Rousseau et al. Reference Rousseau, Belin, Bove, Rousseau, Fabre, Berruyer, Guillaumès, Manceau, Jacques and Boureau2013). Furthermore, future research could also focus on validating the assay on other herbicide sites of action as well as herbicide mixtures. Nevertheless, the current study demonstrated the promise of the leaf-disk assay as a rapid tool to survey herbicide-resistant weeds, and it is worthy of more optimization to improve its sensitivity.
Acknowledgments
The authors would like to Jenny Krebel, Megan Gilley, and Jeff Haines for plant propagation and herbicide application. This research received no specific grant from any funding agency or the not-for-profit sector. No conflicts of interest have been declared.
Supplementary Material
To view supplementary material for this article, please visit https://doi.org/10.1017/wsc.2021.15


