


Introduction
The evolution of herbicide-resistant weeds poses a threat to crop yield and herbicide efficacy (Powles and Yu Reference Powles and Yu2010). Herbicide resistance has increased in incidence and is a problem worldwide. There are currently 252 known weed species with populations that are resistant to one or more herbicides (Heap Reference Heap2017). Many of these populations exhibit multiple-herbicide resistance, which is resistance to more than one unique herbicide mechanism of action. Herbicide-resistance mechanisms can be grouped into two main categories: target site and non–target site (Powles and Yu Reference Powles and Yu2010). Target-site mechanisms involve changes to the gene encoding the target site of the herbicide, such as a mutation or amplification of the gene. Non–target site mechanisms include herbicide metabolism, altered translocation, or sequestration (Powles and Yu Reference Powles and Yu2010). The non–target site mechanisms have been more challenging to understand, as there are hundreds of candidate genes that could be involved. This effort is hampered by the scarcity of sequence data for most weed species. Many populations that exhibit multiple-herbicide resistance have one or more non–target site mechanisms responsible for resistance. Although it is a challenge to identify genes associated with this type of resistance, there has been some success.
Cytochrome P450s, glutathione S-transferases (GSTs), and ABC transporters are three classes of enzymes typically associated with herbicide metabolism (Van Eerd et al. Reference Van Eerd, Hoagland, Zablotowicz and Hall2003). In rice barnyardgrass [Echinochloa phyllopogon (Stapf) Koso-Pol.], a common weed of rice in California, resistance to the acetolactate synthase (ALS) inhibitors bensulfuron and penoxsulam was attributed to an increase in expression of two cytochrome P450s, CYP81A12 and CYP81A21 (Iwakami et al. Reference Iwakami, Endo, Saika, Okuno, Nakamura, Yokoyama, Watanabe, Toki, Uchino and Inamura2014). Overexpression of either of these two cytochrome P450s in Arabidopsis conferred resistance to the two herbicides (Iwakami et al. Reference Iwakami, Endo, Saika, Okuno, Nakamura, Yokoyama, Watanabe, Toki, Uchino and Inamura2014). Similarly, in soybean [Glycine max (L.) Merr.] and rice (Oryza sativa L.), herbicide tolerance has been attributed to cytochrome P450 activity. Transfer of CYP71A10 from soybean to tobacco (Nicotiana tabacum L.) rendered the transgenic plants resistant to linuron, a photosystem II inhibitor (Siminszky et al. Reference Siminszky, Sheldon, Corbin and Dewey2000). In rice, a single base-pair deletion in a cytochrome P450 resulted in a loss of tolerance to bentazon (Pan et al. Reference Pan, Zhang, Liu, Zhang, Wu, Zhu and Tu2006). Fenoxaprop-P resistance in some blackgrass (Alopecurus myosuroides Huds.) and rigid ryegrass (Lolium rigidum Gaudin) populations has been attributed to an increase in expression of a GST (Cummins et al. Reference Cummins, Wortley, Sabbadin, He, Coxon, Straker, Sellars, Knight, Edwards, Hughes, Kaundun, Hutchings, Steel and Edwards2013). Treatment of the resistant weeds with the herbicide and a GST inhibitor severely reduced herbicide resistance. Transformation of Arabidopsis with the GST conferred resistance (Cummins et al. Reference Cummins, Wortley, Sabbadin, He, Coxon, Straker, Sellars, Knight, Edwards, Hughes, Kaundun, Hutchings, Steel and Edwards2013). Enzymes such as ABC transporters can transport glutathione conjugates, and transport of a metolachlor conjugate by an ABC transporter has been documented (Lu et al. Reference Lu, Li, Drozdowicz, Hortensteiner, Martinoia and Rea1998; Tommasini et al. Reference Tommasini, Vogt, Fromenteau, Hortensteiner, Matile, Amrhein and Martinoia1998).
Progress in understanding non–target site resistance has also been made by using RNA-seq analysis to compare expression between sensitive and resistant plants before and after herbicide treatment (An et al. Reference An, Shen, Ma, Yang, Liu and Chen2014; Duhoux et al. Reference Duhoux, Carrere, Gouzy, Bonin and Delye2015; Gaines et al. Reference Gaines, Lorentz, Figge, Herrmann, Maiwald, Ott, Han, Busi, Yu, Powles and Beffa2014; Gardin et al. Reference Gardin, Gouzy, Carrere and Delye2015; Leslie and Baucom Reference Leslie and Baucom2014). This technique is a means of identifying candidate genes for further study and has been employed for a few weed species. Comparison of glyphosate-resistant and glyphosate-susceptible tall morningglory [Ipomoea purpurea (L.) Roth] lines revealed 19 genes of interest, including a cytochrome P450 and a kinase that were upregulated (Leslie and Baucom Reference Leslie and Baucom2014). An et al. (Reference An, Shen, Ma, Yang, Liu and Chen2014) identified many genes of interest in paraquat-resistant goosegrass (Eleusine indica L. Gaertn.), including several related to transport, polyamines, and scavenging of reactive oxygen species. Two studies have examined resistance in L. rigidum (Duhoux et al. Reference Duhoux, Carrere, Gouzy, Bonin and Delye2015; Gaines et al. Reference Gaines, Lorentz, Figge, Herrmann, Maiwald, Ott, Han, Busi, Yu, Powles and Beffa2014). The first investigated pyroxsulam resistance and identified two cytochrome P450s, one glycosyltransferase, and one GST that were of interest (Duhoux et al. Reference Duhoux, Carrere, Gouzy, Bonin and Delye2015). In the second study, diclofop resistance was studied, and four genes, two cytochrome P450s, one nitronate monooxygenase, and one glucosyltransferase, were identified as potentially being associated with resistance (Gaines et al. Reference Gaines, Lorentz, Figge, Herrmann, Maiwald, Ott, Han, Busi, Yu, Powles and Beffa2014). In ALS inhibitor–resistant A. myosuroides , three cytochrome P450s, one peroxidase, and one disease-resistance protein were associated with resistance (Gardin et al. Reference Gardin, Gouzy, Carrere and Delye2015). By using differential expression, these studies were able to identify candidate genes for further research in determining non–target site resistance mechanisms in these weeds.
Members of the Echinochloa genus include some of the worst weeds of rice (Muenscher 1955). Many populations belonging to members of this genus have evolved multiple-herbicide resistance (Heap Reference Heap2017). Populations of late watergrass [Echinochloa oryzicola (Vasinger) Vasinger] in California have evolved resistance to acetyl coenzyme A carboxylase (ACCase) inhibitors and ALS inhibitors (Fischer et al. Reference Fischer, Bayer, Carrier, Ateh and Yim2000). A population of early watergrass [Echinochloa oryzoides (Ard.) Fritsch] in Turkey exhibited similar resistance (Altop et al. Reference Altop, Mennan, Streibig, Budak and Ritz2014). Multiple-herbicide resistance has also been reported in junglerice [Echinochloa colona (L.) Link] and barnyardgrass [Echinochloa crus-galli (L.) P. Beauv.] (Heap Reference Heap2017). In Sunflower County, MS, a grower identified a population of E. colona that was difficult to control. Within this population, a biotype was identified that has resistance to imazamox (an ALS inhibitor), fenoxaprop-P-ethyl (an ACCase inhibitor), quinclorac (an auxin mimic), and propanil (a photosystem II inhibitor). These herbicides represent four different mechanisms of action, making it difficult for the grower to control this population. The ALS- and ACCase-inhibitor resistances in the biotype have been confirmed to be non–target site mechanisms (Riar et al. Reference Riar, Norsworthy, Srivastava, Nandula, Bond and Scott2013; Wright et al. Reference Wright, Nandula, Grier, Showmaker, Bond, Peterson, Ray and Shaw2016). The goal of this research was to use an existing RNA-seq data set (Wright et al. Reference Wright, Sasidharan, Koski, Rodriguez-Carres, Peterson, Nandula, Ray, Bond and Shaw2017) to compare this resistant biotype with a biotype that was sensitive to all four herbicides. Using differential gene expression analysis, quantitative PCR, and single-nucleotide polymorphism (SNP) analysis of cytochrome P450 families, a list of 30 candidate genes for involvement in resistance was identified.
Materials and Methods
Dose Responses
The resistant E. colona biotype (R) was identified in a rice field in Sunflower County, MS. The sensitive E. colona biotype (S) was propagated from a single plant that had no known prior exposure to herbicides. Plants were grown in Metromix 360® potting soil (Sun Gro Horticulture, Bellevue, WA) and kept under a 12-h photoperiod day with day and night temperatures of 24 and 21 C, respectively. Herbicide treatments were applied in a spray chamber with a 8002E nozzle at a 220-kPa pressure and 187 L ha−1 spray volume. R and S plants were treated at the 2- to 3-leaf stage. Imazamox was chosen for this study, as it is a more potent ALS inhibitor than imazethapyr, even though the field in which the R biotype originated was treated with imazethapyr. Imazamox (Beyond®, BASF, Research Triangle Park, NC) and propanil (RiceShot®, RiceCo, Memphis, TN) were applied with 0.25% v/v nonionic surfactant (Induce®, Helena Chemical, Collierville, TN), and quinclorac (Facet, BASF) with 1% v/v crop oil concentrate (Agri-Dex, Bayer CropScience, Research Triangle Park, NC). Treatment rates were: 13, 26, 53, 110, and 210 g ai ha−1 for imazamox; 3,400, 6,700, 13,000, 27,000, and 54,000 g ai ha−1 for propanil; and 280, 560, 1,100, 2,200, and 4,500 g ai ha−1 for quinclorac. For imazamox and quinclorac, a second dose response was performed in which malathion was applied with the herbicide at 1,000 g ai ha−1 (propanil was not treated with malathion, because the resistance mechanism in Echinochloa sp. has been well studied [Hirase and Hoagland Reference Hirase and Hoagland2006; Yih et al. Reference Yih, McRae and Wilson1968]). Plants were returned to the greenhouse following treatment. After 3 wk, they were rated for injury on a scale of 0% to 100%, with 0 being no injury and 100 being plant death. The dose responses for imazamox and quinclorac were performed in triplicate, and propanil in duplicate. The injury data were subjected to ANOVA in SAS v. 9.4 (SAS Institute, Cary, NC) using PROC GLM. Influence of malathion on herbicide injury with imazamox and quinclorac was also determined by ANOVA. ED50 values (herbicide dose required to cause a 50% inhibition in growth of treated plants) were calculated using Sigma Plot (Systat Software, San Jose, CA). The data were plotted using a sigmoidal three-parameter equation of the form:
 $$y\,{\equals}\,a/\left\{ {{\rm 1}{\plus}{\rm exp}\left[ {{\minus}\left( {x{\minus}x_{0} } \right)/b} \right]} \right\}$$
The percent control is represented by y, the herbicide concentration by x, the upper asymptote by a, the slope by b, and the ED50 by x 0. Regression models of respective biotype pairs were compared using a t-test.
Differential Gene Expression Analysis
Differential gene expression analysis was performed by aligning RNA-seq reads with an E. colona leaf transcriptome (Wright et al. Reference Wright, Sasidharan, Koski, Rodriguez-Carres, Peterson, Nandula, Ray, Bond and Shaw2017; transcriptome accession number GFJI00000000). Briefly, the transcriptome was assembled by pooling Illumina HiSeq2000 reads from 12 RNA samples: 3 RNA extractions from R plants treated with imazamox, 3 R untreated, 3 S imazamox treated, and 3 S untreated. For this study, Genedata Analyst v. 9.1 (Genedata, Lexington, MA) was used to generate a list of transcripts that were upregulated in R compared with S or in S compared with R in the absence of herbicide treatment. This was performed as a pairwise analysis. The TPM (transcripts per million) values were analyzed using the two-group exact test algorithm option in Genedata Analyst. The TPM values were used as input, and significantly differentially expressed transcripts were identified using an exact combinatorial test model. This model is based on a negative binomial distribution. The results were filtered so that only transcripts that exhibited a 3-fold change in expression and had a P-value less than 0.05 were included for further analysis.
qPCR Analysis
R and S plants and plants from two other biotypes, 1998 and 2002 (Azlin Seed, Leland, MS), were grown under the conditions described above. At the 2- to 3-leaf stage, the second leaf was harvested from five to six plants for each biotype. The RNeasy Plant Mini Kit (Qiagen, Valencia, CA) was used for RNA extractions. The tissue was homogenized in 900 μl RLT buffer (Qiagen) using a mortar and pestle. Following extraction with the RNEasy Plant Mini Kit, the RNA was DNase treated. The reactions consisted of the RNA sample, 1X RDD buffer, and 2.7 U DNase. After a 30-min incubation at room temperature, the RNA was purified using the RNeasy Plant Mini Kit. The quantity and quality of RNA were determined by A260 readings, A260/A280, and gel electrophoresis. RNA was then converted to cDNA using the High Capacity cDNA Reverse Transcription Kit (Fisher Scientific, Hampton, NH). Reactions consisted of 2 µg RNA, 4 mM dNTPs, 1X random primers, 1X buffer, and H2O added to a final volume of 20 µl. The reactions were incubated at 25 C for 10 min, 37 C for 2 h, and 85 C for 5 s.
qPCR was performed using the ABI7500 real-time PCR system (Thermo Fisher Scientific, Waltham, MA). Reactions consisted of 25 ng RNA, 15 µM primers, 2X power Sybr green master mix (Fisher Scientific), and H2O added to a final volume of 50 µl. Three technical replicates were performed for each sample and primer pair. Efficiency was determined for each primer pair and melt-curve analyses were performed. Malate dehydrogenase was included as a reference gene. Primer sequences are given in Table 1. Cycle conditions were 50 C for 2 min; 95 C for 10 min; 40 cycles of 95 C for 15 s, 55 C for 30 s, and 72 C for 30 s. Data were analyzed according to the standard curve method in ABI User Bulletin #2 (http://www3.appliedbiosystems.com/cms/groups/mcb_support/documents/generaldocuments/cms_040980.pdf). Significant differences between biotypes for each transcript and trial were determined using JMP v. 11 (SAS Institute), specifically using the software to perform a Student’s t-test.
Table 1 Primers used in qPCR for comparison of Echinochloa colona biotypes.

Characterization of Gene Families and SNP calling
Transcripts previously annotated as either cytochrome P450s, GSTs, or ABC transporters were extracted from the annotated E. colona transcriptome (Wright et al. Reference Wright, Sasidharan, Koski, Rodriguez-Carres, Peterson, Nandula, Ray, Bond and Shaw2017). BLASTx was used to identify coding regions in each transcript and homology to known members of the gene families. Transcripts with premature stop codons were labeled as pseudogenes. To identify SNPs in the cytochrome P450s, Illumina reads were assembled to the annotated cytochrome P450 transcripts in Geneious v. 7.1.9 (Kearse et al. Reference Kearse, Moir, Wilson, Stones-Havas, Cheung, Sturrock, Buxton, Cooper, Markowitz, Duran, Thierer, Ashton, Mentjies and Drummond2012) and were manually inspected for polymorphisms.
Results and Discussion
Dose–Response Assays
Dose–response assays were performed for the R and S plants for imazamox, quinclorac, and propanil (Figure 1). It has already been established that the R biotype has an 11-fold greater resistance to fenoxaprop-P-ethyl than the S biotype (Wright et al. Reference Wright, Nandula, Grier, Showmaker, Bond, Peterson, Ray and Shaw2016). For imazamox and quinclorac, the dose responses were performed in both the presence and absence of the insecticide malathion, a cytochrome P450 inhibitor. If malathion causes a reduction in resistance when applied with the herbicide, this would suggest involvement of a cytochrome P450 in the resistance mechanism. This is what was observed for imazamox and quinclorac. When only imazamox was present, the R and S biotypes had ED50 values of 28 and 11 g ai ha−1, respectively, which were significantly different (P<0.0001). When malathion was applied with imazamox, these values shifted to 11 for R and 10 g ai ha−1 for S. Control, averaged across herbicide dose, increased from 75% and 90% for R and S in the absence of malathion, respectively, to 95% and 99% for R and S in the presence of malathion, respectively. Thus, the R biotype is indistinguishable from the S when malathion is applied with the herbicide, indicating that a cytochrome P450 may be important for resistance. With quinclorac, the ED50 values for R and S were 811 and 448 g ai ha−1, respectively, which were significantly different (P=0.0016). In the presence of malathion they dropped to 216 and 218 g ai ha−1 for R and S, respectively. Control, averaged across herbicide dose, increased from 61% and 78% for R and S in absence of malathion, respectively, to 92% and 98% for R and S in presence of malathion, respectively. This reduction in resistance for quinclorac when malathion was applied also indicates possible involvement of a cytochrome P450 in resistance. However, it would be necessary to conduct additional research to confirm this, including identification and comparison of herbicide metabolites in R and S plants as well as isolation and testing of cytochrome P450s suspected of being involved in the resistance mechanism.
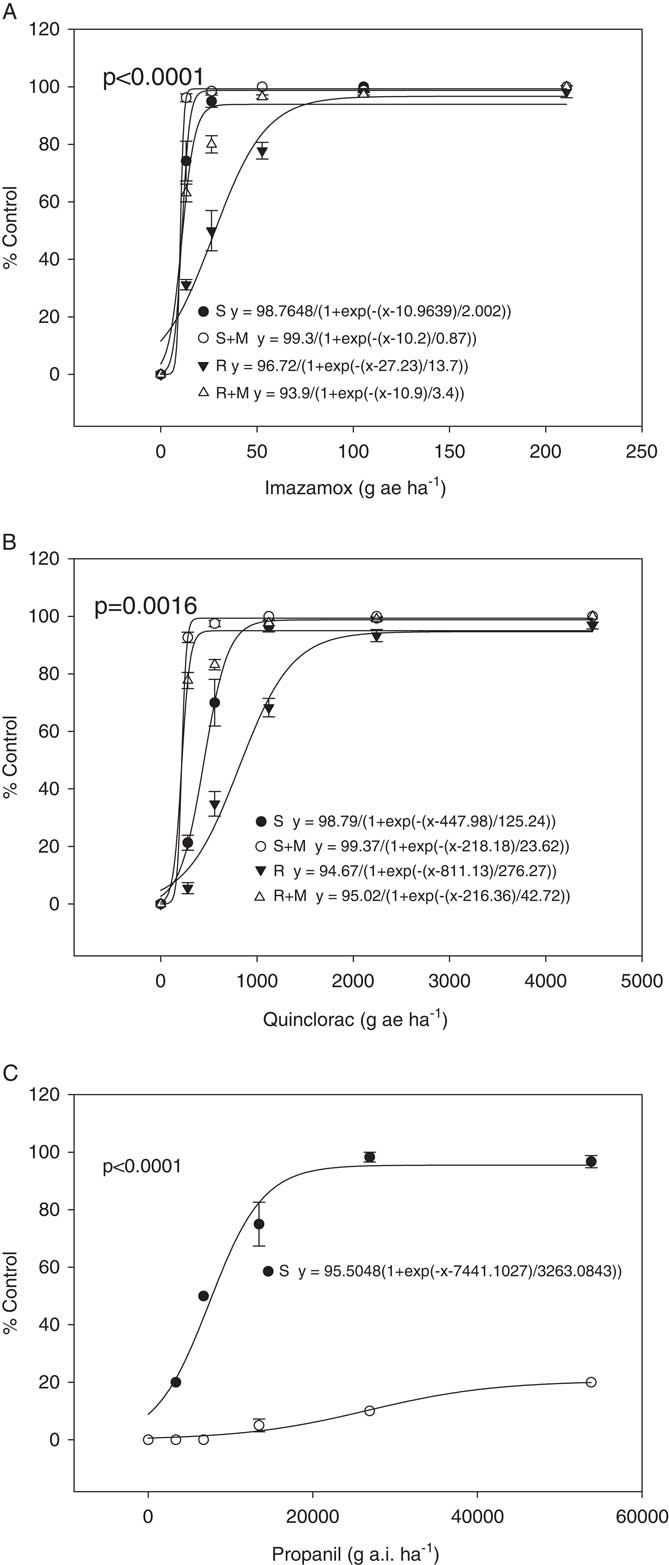
Figure 1 Dose responses for R and S biotypes of Echinochloa colona. Herbicides applied are (A) imazamox, (B) quinclorac, and (C) propanil. The “M” in the imazamox and quinclorac dose responses indicates treatment with malathion.
For the propanil dose response, an ED50 value could not be calculated for the R biotype because the R biotype showed only a marginal reduction in growth at the highest rate tested (Figure 1). ED50 for the S biotype was 7,441 g ai ha−1. A t-test showed significant difference (P<0.0001) between the two biotypes in response to propanil dose response. In rice, propanil tolerance is due to metabolism of the herbicide by an aryl acylamidase that in Echinochloa spp. shows insufficient activity to detoxify the herbicide (Yih et al. Reference Yih, McRae and Wilson1968). Where propanil resistance has evolved in E. colona and E. crus-galli, the resistance mechanism has been shown to be an increase in the activity of this amidase (Hirase and Hoagland Reference Hirase and Hoagland2006; Leah et al. Reference Leah, Caseley, Riches and Valverde1994). However, no gene has been linked specifically with propanil resistance in Echinochloa spp. or with tolerance in rice.
Non–target site resistance to ALS inhibitors, such as imazamox, has been established in Echinochloa spp. (Riar et al. Reference Riar, Norsworthy, Srivastava, Nandula, Bond and Scott2013; Yun et al. Reference Yun, Yogo, Miura, Yamasue and Fischer2005). Only one study in E. oryzicola has linked a specific gene with non–target site ALS-inhibitor resistance. Overexpression of two cytochrome P450s, CYP81A12 and CYP81A21, was observed only in plants resistant to the ALS inhibitors bensulfuron and penoxsulam (Iwakami et al. Reference Iwakami, Endo, Saika, Okuno, Nakamura, Yokoyama, Watanabe, Toki, Uchino and Inamura2014). When these cytochrome P450s were cloned into Arabidopsis and overexpressed, they conferred herbicide resistance (Iwakami et al. Reference Iwakami, Endo, Saika, Okuno, Nakamura, Yokoyama, Watanabe, Toki, Uchino and Inamura2014). In rice, a different cytochrome P450 was linked to bispyribac sodium tolerance (Saika et al. Reference Saika, Horita, Taguchi-Shiobara, Nonaka, Nishizawa-Yokoi, Iwakami, Hori, Matsumoto, Tanaka, Itoh, Yano, Kaku, Shimizu and Toki2014). The indica variety, but not the japonica, exhibited tolerance. A cytochrome P450, CYP72A31, which was functional only in indica, was cloned into japonica. Overexpression of the transgene resulted in resistance (Saika et al. Reference Saika, Horita, Taguchi-Shiobara, Nonaka, Nishizawa-Yokoi, Iwakami, Hori, Matsumoto, Tanaka, Itoh, Yano, Kaku, Shimizu and Toki2014).
With regard to quinclorac resistance, no specific cytochrome P450 has been confirmed to have a role in resistance (Yasour et al. Reference Yasour, Milan, Eckert and Fischer2011). In resistant plants, increased levels of β-cyanoalanine synthase are observed and are suspected to be involved in the mechanism by preventing a toxic accumulation of cyanide within the plant (Yasour et al. Reference Yasour, Milan, Eckert and Fischer2011). However, it has not been determined whether there are any point mutations in the β-cyanoalanine synthase nucleotide sequence or whether there has been any change in gene expression that could account for resistance.
Differential Gene Expression between R and S Biotypes
Differential gene expression analysis was used to compare only untreated plants to identify any inherent differences in expression between R and S plants that may contribute to resistance. Genedata Analyst was used for the differential expression analysis. Only the untreated samples were focused on here, as another study (Wright et al. Reference Wright, Sasidharan, Koski, Rodriguez-Carres, Peterson, Nandula, Ray, Bond and Shaw2017) found that the response to imazamox treatment was similar between R and S plants. In this study, the differential gene expression analysis identified 170 transcripts that were upregulated in R compared with S and 160 that were upregulated in S compared with R (Supplementary Tables S1 and S2). A subset of these were annotated. The range in fold change was large. For transcripts upregulated in S, it was 3.3 to 1,217, and for R it was 3.6 to 1,037. The threshold for fold change was set at 3, so differences in expression with fold-change values below the threshold were not included in subsequent analysis. Additionally, 562 transcripts were identified as being expressed only in S and 507 were expressed only in R according to expression estimates. Of these, only 53 of the transcripts in S were annotated, and only 33 were annotated in R (Supplementary Tables S3 and S4).
As the S and R biotypes are not isogenic, most of the differentially expressed transcripts are likely due to genetic variation between biotypes that is unrelated to the multiple herbicide–resistance traits. In an attempt to eliminate differentially expressed transcripts unrelated to multiple-herbicide resistance, qPCR analysis for 16 selected candidate transcripts was performed on R, S, and two additional, unrelated, biotypes, 1998 and 2002. Due to the large number of potential target transcripts, it was impossible to examine all by qPCR. Because multiple members of some families were differentially expressed, representatives were chosen. Some, like the kinase (TR26963) that exhibited over a 1,000-fold increase in expression in R compared with S, were chosen because they stood out. The two additional biotypes selected for comparison, 1998 and 2002, were sensitive to imazamox, fenoxaprop-P-ethyl, and quinclorac but resistant to propanil (unpublished data). For all but three transcripts, the result was similar to that of the O-methyltransferase (Figure 2). For many, like the O-methyltransferase, the difference between R and S was preserved (increased expression in R in this case), but the difference did not stand out when compared with the other two biotypes. There were three exceptions to this trend. There was a GST that was only expressed in R and not S. When qPCR was performed on the two additional biotypes, there was no expression in 1998 in both trials, but 2002 had some expression in the first trial. The transcript that exhibited the greatest differential expression between S and R was the TR26963 kinase described above that was upregulated in R. When qPCR was performed on all four biotypes, both trials showed very high expression in R relative to 1998 and S, with a more modest increase compared with 2002. The third transcript that stood out encoded an F-box protein. This transcript was downregulated in R relative to all three biotypes (Figure 2).
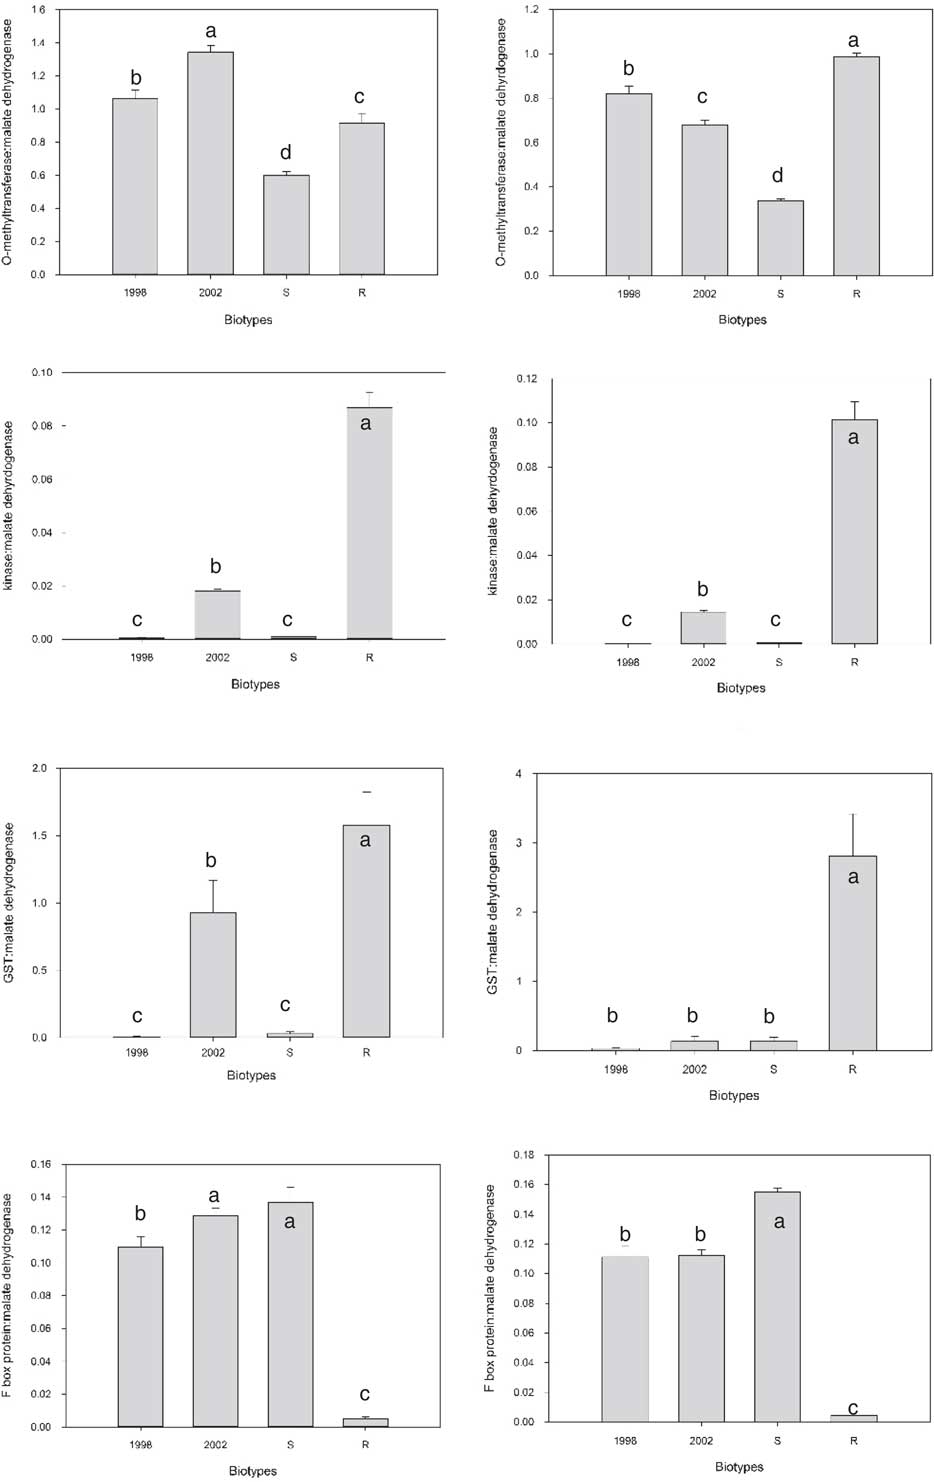
Figure 2 Comparison of gene expression in the absence of herbicide treatment for four transcripts in four Echinochloa colona biotypes. Trial 1 is on the right and Trial 2 is on the left. Letters indicate which samples are significantly different from one another.
GSTs have been linked to herbicide resistance in other weeds. Cummins et al. (Reference Cummins, Wortley, Sabbadin, He, Coxon, Straker, Sellars, Knight, Edwards, Hughes, Kaundun, Hutchings, Steel and Edwards2013) found that increased expression of a GST was involved in resistance to multiple herbicides in some populations of A. myosuroides and L. rigidum. Treatment with a GST inhibitor reduced resistance in these populations (Cummins et al. Reference Cummins, Wortley, Sabbadin, He, Coxon, Straker, Sellars, Knight, Edwards, Hughes, Kaundun, Hutchings, Steel and Edwards2013). The Mississippi R E. colona biotype was treated with fenoxaprop-P-ethyl in the presence and absence of the same inhibitor; however, the inhibitor had no effect on resistance (Wright et al. Reference Wright, Nandula, Grier, Showmaker, Bond, Peterson, Ray and Shaw2016). The R biotype is resistant to three other classes of herbicides, and the GST may have some role in those resistances.
Kinases have not been previously linked to non–target site resistance, but the high level of expression observed in the R biotypes relative to the other three biotypes warrants further investigation. Kinases are a very large and diverse family—more than 900 have been annotated in Arabidopsis (Zulawski et al. Reference Zulawski, Schulze, Braginets, Hartman and Schulze2014). As many pathways within the cell require kinase activity, it is possible that the large increase in expression in the R biotype may have a role in resistance.
Downregulation of an F-box protein was recently shown to be associated with non–target site resistance in American sloughgrass [Beckmannia syzigachne (Steud.) Fernald] (Pan et al. Reference Pan, Wang, Cai, Gao, Zhao and Dong2016). This study investigated miRNAs in plants resistant and sensitive to fenoxaprop-P-ethyl. The corresponding miRNA for the F-box protein was upregulated (Pan et al. Reference Pan, Wang, Cai, Gao, Zhao and Dong2016). It is not known how F-box proteins might be involved in resistance mechanisms. They are a diverse family of enzymes involved in many processes, chiefly by interacting with specific proteins in an E3 ubiquitin ligation complex that targets proteins for degradation (Stefanowicz et al. Reference Stefanowicz, Lannoo and Van Damme2015). It is possible that the reduction in the F-box transcripts leads to a reduction in targeting of a subset of proteins for degradation and, as with the increased kinase expression, could lead to the alteration of a cellular pathway and resistance. The products of these transcripts will require further study.
SNP Analysis of Cytochrome P450s
The reduction in resistance level caused by malathion in the dose–response study suggests that at least one cytochrome P450 may have a role in the resistance mechanism(s) present in the R biotype. Surprisingly, the differential gene expression analysis and subsequent qPCR did not identify a cytochrome P450 as being significantly upregulated in the R biotype. It is possible that cytochrome P450 involvement in resistance may not result from an increase in expression of a cytochrome P450, but instead a change in sequence may have altered the activity of a cytochrome P450 with respect to imazamox metabolism. To identify cytochrome P450s of interest, members of the family were examined for point mutations. RNA-seq reads from R and S were separately assembled to the annotated cytochrome P450 transcripts and manually inspected for the presence of SNPs. There was considerable variation, given that these biotypes are not isogenic and the species is hexaploid. However, some SNPs of interest were identified (Table 2). Transcripts 26477c1_g1 and 67928c5_g1 (designated 86B1 and 71A1, respectively) were particularly interesting, because at all reads assembled in S there was a premature stop codon, yet in R the stop codon was present in only one of 22 reads for TR26477c1_g1 and absent in TR67928c5_g1, suggesting that a functional product may be produced in R but not S. This is similar to what was found in the rice study described earlier (Saika et al. Reference Saika, Horita, Taguchi-Shiobara, Nonaka, Nishizawa-Yokoi, Iwakami, Hori, Matsumoto, Tanaka, Itoh, Yano, Kaku, Shimizu and Toki2014). There were also several nonsynonymous point mutations that were present in R but not S. These cytochrome P450s are candidates for further study in determining the resistance mechanism in this biotype. This type of analysis may also be applied in future studies to examine other gene families of interest in this biotype.
Table 2 Annotated cytochrome P450 transcripts with single-nucleotide polymorphisms (SNPs) unique to untreated resistant (R) or sensitive (S) Echinochloa colona biotypes.

a Cytochrome P450 designations are based on BLASTn results.
b The amino acid changes generated in nonsynonymous SNPs. These SNPs appeared primarily only in the S or R biotypes.
Characterization of Gene Families Associated with Metabolic Resistance
Finally, as no prior characterization of gene families associated with metabolic resistance has been performed in the Echinochloa genus, the cytochrome P450, GST, and ABC transporter families were examined. As described earlier, cytochrome P450s have been directly associated with metabolic resistance in rice (Pan et al. Reference Pan, Zhang, Liu, Zhang, Wu, Zhu and Tu2006; Saika et al. Reference Saika, Horita, Taguchi-Shiobara, Nonaka, Nishizawa-Yokoi, Iwakami, Hori, Matsumoto, Tanaka, Itoh, Yano, Kaku, Shimizu and Toki2014) and E. oryzicola (Iwakami et al. Reference Iwakami, Endo, Saika, Okuno, Nakamura, Yokoyama, Watanabe, Toki, Uchino and Inamura2014). To characterize this family in E. colona, all transcripts annotated as cytochrome P450s were selected from the E. colona transcriptome. There were 444 transcripts identified as cytochrome P450s (Supplementary Table S5). Of these, 75 were confirmed as pseudogenes due to the presence of a premature stop codon in the coding sequence. This transcript number is greater than in I. purpurea, which had 289 annotated cytochrome P450s (Leslie and Baucom Reference Leslie and Baucom2014). Recently, a draft genome of E. crus-galli was completed, and 917 genes in that genome were identified as cytochrome P450s (Guo et al. Reference Guo, Qiu, Ye, Jin, Mao, Zhang, Yang, Pen, Wang, Jia, Lin, Li, Fu, Liu, Chen, Shen, Wang, Chu, Wu, Wu, Xia, Zhang, Zhou, Wang, Wu, Song, Wang, Shu, Aoki, Yumot, Lou, Qian, Yamaguchi, Yamane, Kong, Timko, Bai and Fan2017). This is many more than were detected in E. colona; however, the cytochrome P450 count in E. colona is based on a transcriptome, which requires that the genes be expressed to be detected. Until a genome is completed for E. colona, it will not be known whether the number of cytochrome P450s is greater than that detected in the transcriptome.
There were 123 transcripts annotated as GSTs (Supplementary Table S6). Of these, 22 were labeled as pseudogenes due to a premature stop codon. This is a higher number of GSTs than reported for barley (Hordeum vulgare L.) or rice, which had 84 and 59 annotated GSTs, respectively (Rezaei et al. Reference Rezaei, Shobbar, Shahbazi, Abedini and Zare2013; Soranzo et al. Reference Soranzo, Gorla, Mizzi, de Toma and Frova2004). This is also a larger number of GSTs than described for Arabidopsis, which had 47 (Wagner et al. Reference Wagner, Edwards, Dixon and Mauch2002). It is, however, far less than the 277 identified for E. crus-galli (Guo et al. Reference Guo, Qiu, Ye, Jin, Mao, Zhang, Yang, Pen, Wang, Jia, Lin, Li, Fu, Liu, Chen, Shen, Wang, Chu, Wu, Wu, Xia, Zhang, Zhou, Wang, Wu, Song, Wang, Shu, Aoki, Yumot, Lou, Qian, Yamaguchi, Yamane, Kong, Timko, Bai and Fan2017). Again, these counts in E. crus-galli are based on a draft genome, so the number presented here for E. colona may underestimate the actual number of GSTs in this species.
For the ABC transporters, there were 278 annotated transcripts, of which 75 were pseudogenes (Supplementary Table S7). Based on BLASTx searches, 15 transcripts belonged to family A, 56 to family B, 66 to family C, 6 to family D, 7 to family E, 10 to family F, 108 to family G, and 10 to family I. This is a greater number than both rice and Arabidopsis, which had 121 and 129 ABC transporters, respectively (Garcia et al. Reference Garcia, Bouige, Forestier and Dassa2004; Sanchez-Fernandez et al. Reference Sanchez-Fernandez, Davies, Coleman and Rea2001).
The R biotype of E. colona identified in Sunflower County, MS, exhibits resistance to herbicides representative of four different mechanisms of action. For two of these herbicides, imazamox and quinclorac, resistance was reduced when the herbicide was applied with a cytochrome P450 inhibitor, malathion. Although the differential expression analysis and qPCR did not identify any cytochrome P450s as differentially expressed, they did identify a GST and kinase as being significantly upregulated and an F-box protein as being significantly downregulated in the R plants. The absence of a differentially expressed cytochrome P450 prompted an SNP analysis of the family that identified several SNPs of interest. Additional work is necessary to determine whether these transcripts produce functional protein products and what role those products may have in resistance. Some of this work may be achieved by using RNAi technology to knock down specific genes in the resistant or sensitive plants and determine how this reduction in expression affects herbicide resistance. Other work may involve following the metabolic fate of these herbicides in resistant and sensitive plants.
Acknowledgements
Funding provided by BASF for this research is greatly appreciated. The authors appreciate the use of the facilities and equipment at USDA-ARS for this research. The authors would like to thank Dr. Chuan-yu Hsu for assistance in optimizing the RNA extraction protocol. No conflicts of interest have been declared.
Supplementary materials
To view supplementary material for this article, please visit https://doi.org/10.1017/wsc.2018.10


