


Globally, non-communicable diseases such as CVD and type 2 diabetes are increasingly being recognized as major causes of morbidity and mortality, especially in low-income regions such as sub-Saharan Africa(Reference Murray and Lopez1). The burden of non-communicable diseases is growing in South Africa where a complex mix of both overnutrition and undernutrition can be found(Reference Jinabhai, Taylor and Sullivan2). This has resulted in nutrition-related conditions such as underweight and overweight/obesity coexisting in South African primary schools(Reference Armstrong, Lambert and Lambert3).
The National Food Consumption Survey(Reference Steyn, Labadarios and Maunder4) reported that nearly one in five South African children between the ages of 1 and 9 years was stunted, and one in ten was underweight for age. In contrast, the survey also reported that 17·1 % of the sample was either overweight or obese.
Several barriers to the promotion of good nutrition in schools in low-income communities have been identified. These include lack of access to adequate, nutritious and affordable food, together with the easy availability of inexpensive foods of low nutritive value from food shops (known as tuck shops in South Africa) or street vendors(Reference Vorster, Oosthuizen and Jerling5, Reference Temple, Steyn and Myburgh6).
A study(Reference Temple, Steyn and Myburgh6) carried out in fourteen Cape Town schools found that, although most learners ate breakfast before school, a much smaller proportion (41–56 %) carried food to school in the form of a lunchbox. Learners who did not carry a lunchbox to school would either not eat anything during the school day or would buy food from food shops or vendors. Items commonly sold at schools were found to be energy dense, such as chips/crisps, sweets/candy and soft drinks, and high in fat, such as potato chips/crisps and fat-rich cakes.
Schools are an established setting for health promotion activity(7) and provide an opportunity to improve the health of learners, school personnel, families and members of the community, at the same time supporting basic human rights such as education and health(8). Furthermore, there is an opportunity to influence young people in their formative years regarding their current and future health. The knowledge gained at school is an important contribution to the development of health knowledge, attitudes and behaviours (KAB)(Reference Symons, Cinelli and James9, Reference Steyn, Lambert and Parker10).
‘HealthKick’ is a primary-school-based nutrition and physical activity interventional programme(Reference De Villiers, Murphy and Sauls11) that aims to promote healthy eating habits in children, parents and teachers as a means of reducing the risk of chronic diseases (particularly type 2 diabetes). In addition, the programme is structured to promote the development of an environment within the school and community that facilitates the adoption of a healthy lifestyle. As part of the formative assessment, the nutritional status, eating patterns and determinants of behaviour of grade 4 learners from sixteen schools were measured. One of the specific aims was to identify factors associated with lunchbox behaviour.
Experimental methods
Study sample
Two of the seven educational districts in the Western Cape were purposively selected: a rural and an urban district. Eight schools from quintiles 1 to 3 in each district were purposively selected. ‘Quintile’ is a ranking structure used by the Western Cape Education Department, with schools in quintile 1 representing the poorest and schools in quintile 5 representing the wealthiest. Schools were paired within each district and randomly categorized as intervention and control. Schools were matched on geographical location, quintile allocation and number of learners enrolled. All grade 4 learners were given consent forms for parents and learners to complete. In schools with only one class, all grade 4 learners were included. In schools with more than one grade 4 class, data were collected from fifty to sixty learners. The study sample comprised 717 girls and boys between the ages of 10 and 12 years.
Knowledge, attitudes and behaviour
Learners completed a questionnaire assessing their nutritional KAB. The questionnaire was developed by the research team and was informed by questionnaires from Pathways(Reference Stevens, Story and Ring12), as well as by a recent study conducted in the Western Cape(Reference Steyn, Lambert and Parker10, Reference Mchiza13). The English questionnaires were translated into local first languages, Afrikaans and Xhosa. Each learner completed a questionnaire that was administered by trained fieldworkers in the learner's first language.
Dietary intake
Dietary intake was determined by means of an unquantified 24 h recall. Trained fieldworkers recorded what learners had consumed the previous day. Food consumed was recorded as: (i) breakfast at home; (ii) snack before school; (iii) snack at first break: lunchbox; (iv) snack at first break: vendor/food shop; (v) meal from the National School Nutrition Programme (NSNP); (vi) snack at second break: lunchbox; (vii) snack at second break: vendor/food shop; (viii) snack on the way home, after school; (ix) meal at lunch time (home, after care, with a friend); (x) snack during early afternoon; (xi) snack during late afternoon; (xii) meal at supper time (at home or with a friend); and (xiii) snack after supper.
For the purpose of the present study, ‘lunchbox’ referred to any food item brought from home and consumed during the first and/or the second break at school; ‘food shop/vendor’ referred to a small, food-selling retailer operating on the school premises; ‘NSNP’ referred to a government-funded nutritional programme that provides food to eligible learners.
The data were used to generate a dietary diversity score (DDS) and a meal score (MS). The DDS was defined as the number of food groups consumed during a 24 h period(Reference Hatloy, Torheim and Oshaug14, Reference Kennedy and Nantel15), with nine reflecting the greatest variety. The food groups were classified according to the recommendations by FAO(Reference Kennedy and Nantel15): (i) cereals, roots, tubers; (ii) vitamin A-rich fruit and vegetables; (iii) other fruits; (iv) other vegetables; (v) legumes, pulses, nuts; (vi) oils and fats; (vii) meat, poultry, fish; (viii) dairy; and (ix) eggs.
The MS identified the number of meals consumed during a 24 h period, with six meals reflecting the highest score. Food consumed before school was classified as meal 1, namely, breakfast; food consumed at first break was meal 2, namely, morning snack; food consumed at second break, on the way home or on arrival at home was meal 3, namely, lunch; food consumed as an early and late afternoon snack was meal 4; meal 5 comprised supper or dinner; and meal 6 comprised an evening snack.
Anthropometry
Height and weight of each learner were measured by trained fieldworkers. Learners were weighed (in kg to the nearest 0·01 kg) without shoes and jerseys using a digital scale. Height was measured (in cm to the nearest 0·1 cm) using a stadiometer, which was placed on an even surface. Learners stood on its base without shoes, with heels together, looking straight ahead. The same measurement protocol was used for all learners. The anthropometric measurements were used to generate Z-scores (a measure of the distance in standard deviations of a sample from the mean) and BMI percentiles using the SAS statistical software package version 9·1 (SAS Institute Inc., Cary, NC, USA) and the WHO 2007 SAS macro package.
Ethical approval
The study proposal was submitted and approved by the Research Ethics Committee of the Faculty of Health Sciences, University of Cape Town (Ref no. 486/2005). Approval for the research was obtained from the Western Cape Education Department. Parents gave written informed consent for their children to participate. All information was confidential and participants were not identified by name.
Data analysis
Data analysis was carried out using the STATA/SE statistical software package version 10·0 (StataCorp., College Station, TX, USA). Data were collected over a period of 6 weeks, which resulted in some missing information for learners who were not at school on all the data collection days. Data were reported on the basis of lunchbox and food shop/vendor behaviour.
A multiple correspondence analysis was carried out on all questions contributing to each of the three measures (nutritional knowledge, nutritional self-efficacy(Reference Schwarzer and Renner16) and standard of living) individually. The Burt matrix approach(Reference Greenacre17) was used and the percentage of variability in the first two dimensions of each score was assessed. Questions that contributed very little to the variability were dropped from the model. Scores were generated for nutritional knowledge (knowledge score; maximum = 4·75), nutritional self-efficacy(Reference Schwarzer and Renner16) (self-efficacy score; maximum = 5·16) and for standard of living (standard-of-living score; maximum = 4·56) using the ‘predict’ function. Nineteen questions about nutritional knowledge, fourteen questions about self-efficacy v. barriers to nutrition and ten questions on standard of living from the KAB were included in the knowledge, self-efficacy and standard-of-living scores (Fig. 1).
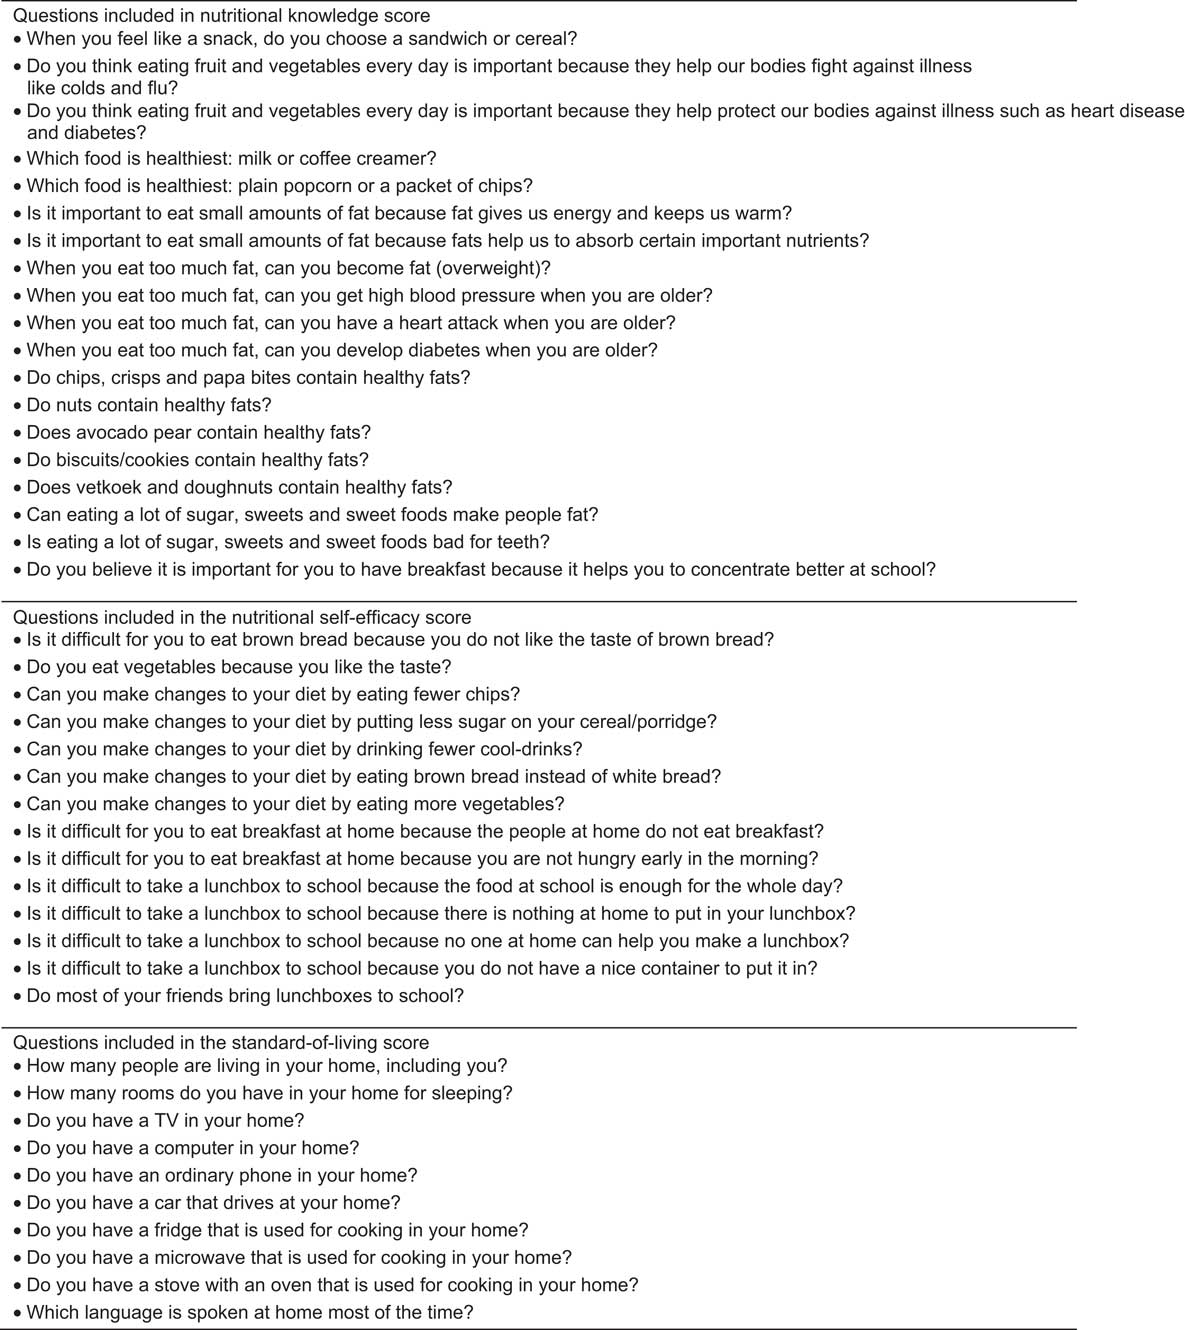
Fig. 1 Questions included in scores for nutritional knowledge, self-efficacy and standard of living
Multiple logistic regression was used to model the effect of several predictor variables on the binary response variable – lunchbox behaviour.
Results
The study sample comprised 717 grade 4 learners. The day before testing, 493 (69 %) of them carried a lunchbox to school, whereas 349 (49 %) had consumed at least one item purchased from the school food shop or vendor. Of those learners who did not carry a lunchbox to school, 135 (60 %) consumed an item purchased at the tuck shop or from a vendor and 134 (60 %) consumed food provided by the NSNP. Most learners ate breakfast in the morning (>90 %), regardless of whether or not they carried a lunchbox to school.
Statistically significant differences were observed when comparing learners who carried a lunchbox to school with those who did not (Table 1a). Those carrying a lunchbox to school were predominantly from an urban school (P = 0·0001) and did not consume a food shop/vendor item (P = 0·0001), nor did they consume food from the NSNP (P = 0·0001). Furthermore, these learners were younger (P = 0·0001), had a lower knowledge score (P = 0·0004) and higher standard-of-living (P = 0·0001) and self-efficacy scores (P = 0·0113), as well as higher DDS (P = 0·012) and MS (P = 0·0001), compared with those who did not carry a lunchbox to school.
Table 1a Sample characteristics of grade 4 learners by lunchbox behaviour

*P < 0·05, ***P < 0·001.
Learners who consumed items purchased from a food shop/vendor were also significantly different from those who did not (Table 1b). Learners who consumed food shop/vendor items had a higher DDS (P = 0·0110), MS (P = 0·0001) and standard-of-living score (P = 0·0001) compared with those who did not. Learners’ weight (P = 0·0036), BMI percentiles (P = 0·0020) and BMI-for-age were significantly lower in the lunchbox group compared with those who did not carry a lunchbox (Table 1c). No statistically significant differences were observed with respect to learners’ height, height-for-age and gender. In all, 19 % of the total sample was stunted, 2 % was underweight and 21 % was either overweight or obese.
Table 1b Sample characteristics of grade 4 learners by food shop/vendor behaviour

*P < 0·05, ***P < 0·001.
Table 1c Anthropometric measurements of grade 4 learners

*P < 0·05, **P < 0·01, ***P < 0·001.
Learners’ DDS were also significantly different (Table 2, Figs 2a and 2b). Most learners carrying a lunchbox to school had a DDS > 4 (56·2 %), as did those who consumed an item from the food shop/vendor (57·9 %).
Table 2 Dietary diversity distribution of grade 4 learners

***P < 0·001.

Fig. 2 Distribution of (a) dietary diversity scores (DDS 1–9) and (b) daily meal scores (MS 1–6) of learners by lunchbox behaviour (▪, no lunch box; ![]() , lunch box)
, lunch box)
The most popular lunchbox item was bread based. Most lunchboxes contained white bread (59 %), with a few lunchboxes containing brown bread (31 %) and other food items (8 %). Sandwich fillings consisted of processed meat (36 %), cheese (21 %), meat/chicken/fish (13 %), jam/syrup/honey (10 %), peanut butter (7 %), only margarine (6 %) and eggs (4 %). Only 9 % of lunchboxes contained a fruit.
Logistic regression was used to determine the best set of variables that would predict whether a learner would carry a lunchbox to school. The variables with the best predictive power were standard-of-living score (OR = 2·01; P = 0·0001), BMI percentile (OR = 0·42; P = 0·006), DDS (OR = 1·35; P = 0·0001) and age (OR = 0·76; P = 0·022; Table 3). All variables included were statistically significant at the 5 % level.
Table 3 Logistic regression of determinants of lunchbox behaviour in grade 4 learners

*P < 0·05, **P < 0·01, ***P < 0·001.
Discussion
The present study describes what grade 4 learners from low-income settings in the Western Cape consumed while at school. Of particular interest is their behaviour with regard to lunchboxes and food shops.
The findings show that most learners (69 %) in the present study carry a lunchbox to school. This is higher than the 41–56 % that was previously reported in a study conducted on high-school students in Cape Town(Reference Temple, Steyn and Myburgh6). No data are currently available on lunchbox behaviour for primary-school children.
Learners who did not carry a lunchbox to school had a significantly higher knowledge score compared with those who did not. These findings are consistent with a study conducted among adult South Africans(Reference Peltzer18) that found that nutritional knowledge did not influence healthy everyday food choices, but contradicts a recent study conducted among mid-adolescents(Reference Venter and Winterbach19) that found that dietary knowledge is associated with healthier eating. Birch and Fisher(Reference Birch and Fisher20) suggest that children's eating behaviour is influenced by many factors such as past exposure to food, accessibility of food, role modeling, taste and smell and child-rearing practices. Since this sample represents children from disadvantaged settings, their lunchbox behaviour may be completely unrelated to their knowledge of nutrition; however, it may largely be influenced by the financial situation within the family. This assumption is supported by the standard-of-living score, which is significantly higher in learners who carried a lunchbox to school compared with those who did not. Moreover, barriers identified in the KAB questionnaire found that learners had difficulty in carrying a lunchbox to school because of a lack of food available at home. This further highlights how the family's financial situation affects the learners’ lunchbox behaviour.
As expected(Reference Schwarzer and Renner16), the more self-efficacious learners displayed better nutritional behaviour regarding lunchboxes. These learners identified fewer barriers to healthy eating and were more prepared to make healthier food choices in the future. However, one of the limitations of the present study involves the use of a self-efficacy score that was not validated. This may indicate that the relationship between self-efficacy and lunchbox behaviour may not be as strongly associated as was found in the present study.
Although only 2 % of the sample was underweight, more than 20 % of them were either overweight or obese and 19 % were stunted. These findings are consistent with results from the National Food Consumption Survey (NFCS) conducted in 1999(Reference Steyn, Labadarios and Maunder4) that found a 17·1 % prevalence of combined overweight and obesity and a 19 % prevalence of stunting in children aged 1–9 years.
Contrary to our expectations, learners who consumed items from a food shop/vendor had a lower standard-of-living score compared with those who did not. A recent study in rural South Africa(Reference Temple, Steyn and Fourie21) concluded that healthier food choices were considerably more expensive than the unhealthy alternatives available. It appears that lower-income households may not always have enough money to buy items needed to prepare a healthy lunchbox but may have enough money to pay for the cheaper, energy-dense snack items commonly sold at school food shops.
The findings also show that younger learners are more likely than older learners to carry a lunchbox to school. Perhaps younger learners have parents who prepare their lunchbox, whereas older learners are given the responsibility of preparing it themselves. This speculation is supported by barriers identified by learners in the KAB analysis, which found that more than half of the learners had no one to assist them in preparing a lunchbox, or it may simply be a matter of social acceptability that resulted in more of the younger learners carrying a lunchbox to school. Barriers to carrying a lunchbox need further investigation since no data are currently available to support or contradict this assumption.
DDS is used as an indicator of the micronutrient adequacy of the diet(Reference Kennedy and Nantel15, Reference Steyn, Nel and Nantel22). According to Steyn et al.(Reference Steyn, Nel and Nantel22), children with a DDS of <4 should be regarded as being at risk of being food insecure and micronutrient deficient. Moreover, these children are more likely to be underweight for age. The present study found similar DDS to those found by Steyn et al.(Reference Steyn, Nel and Nantel22) using data from the NFCS (mean DDS = 3·58). This key finding highlights the contribution of school lunchboxes to the micronutrient adequacy of schoolchildren.
Conclusions
The results from the present study indicate that lunchboxes play an important role in the nutritional status of school-aged children. Learners who carry a lunchbox to school are more likely to consume a diet adequate in nutrients and are less likely to be overweight or obese, whereas learners who do not carry a lunchbox to school are more likely to eat unhealthy snack foods sold at tuck shops or by vendors.
However, the lower standard-of-living score found in learners who did not carry a lunchbox to school suggests that learners from disadvantaged settings may not have control over their lunchbox behaviour and that the provision of nutritionally adequate meals to these schoolchildren is essential.
Although the prevalence of overweight and obesity is consistent with findings from a national study, the prevalence in the present study sample is still of concern because of the disadvantaged setting from which the sample has been drawn. Furthermore, the dietary behaviour of these learners was not optimal and warrants attention in terms of nutritional health promotion, especially with regard to the importance of a healthy lunchbox.
Acknowledgements
The present project was funded by the World Diabetes Foundation, the Medical Research Council and by the Human Sciences Research Council. The authors have no conflict of interest to declare. Z.A. participated in the study, conducted the data analyses and wrote the paper; A.d.V. was the project manager and was involved in all aspects of the study; N.P.S. and E.V.L. were the principal investigators and co-authors; C.E.D. is a postdoctoral fellow and was involved in all aspects of the study; J.F., L.D. and J.H. participated in all phases of the study.


