


Investigations examining the relationship between the food environment and health depend on secondary sources of information to supply characteristics of local food access. Relatively little is published on the validity and reliability of these sources( Reference McKinnon, Reedy and Morrissette 1 ).
In a recent review by Kelly and colleagues( Reference Kelly, Flood and Yeatman 2 ), methods used to validate the location of food outlets obtained from secondary data range from list cross-referencing( Reference Maddock 3 – Reference Jilcott, McGuirt and Imai 6 ) to direct observation( Reference Cummins and Macintyre 7 – Reference Sharkey, Johnson and Dean 14 ). Correspondence between sources was reported as percentage match or agreement( Reference Jilcott, McGuirt and Imai 6 , Reference Cummins and Macintyre 7 , Reference Creel, Sharkey and McIntosh 9 , Reference Sharkey and Horel 10 , Reference Lake, Burgoine and Greenhalgh 13 , Reference Sharkey 15 ), sensitivity( Reference Paquet, Daniel and Kestens 11 – Reference Lake, Burgoine and Greenhalgh 13 ) or positive predictive value (PPV)( Reference Daniel, Paquet and Auger 12 , Reference Lake, Burgoine and Greenhalgh 13 , Reference Cummins and Macintyre 16 ). Validation studies reporting correspondence statistics have generally been performed in North America( Reference Maddock 3 , Reference Wang, Gonzalez and Ritchie 4 , Reference Jilcott, McGuirt and Imai 6 , Reference Creel, Sharkey and McIntosh 9 – Reference Daniel, Paquet and Auger 12 , Reference Sharkey, Johnson and Dean 14 , Reference Sharkey 15 , Reference Sharkey, Horel and Han 17 ) or the UK( Reference Burgoine, Lake and Stamp 5 , Reference Cummins and Macintyre 7 , Reference Lake, Burgoine and Greenhalgh 13 , Reference Cummins and Macintyre 16 ). To our knowledge, there are no other published validation studies of the food environment elsewhere. We are interested in investigating the quality of secondary lists in Denmark, as there tends to be a strong tradition in using public registry information, but less emphasis on its validation. Therefore, our aim was to evaluate to what extent food outlet addresses from various sources can be confirmed by direct observation.
Methods
Data were collected as part of a study examining food outlet exposure in Copenhagen( Reference Svastisalee, Nordahl and Glumer 18 ). We obtained a combined total of 202 addresses of all food outlets trading in 2006 within fourteen Copenhagen school districts. Addresses were initially obtained from the Danish Central Business Registry (CVR)( 19 ), which is the national tax registry (n 159) used to list all legally operating businesses. Food outlets were selected within postal codes of fourteen school districts in Copenhagen, and by business categories drawn by European business codes or Nomenclature des Activites Economiques (NACE) codes( 20 ). Additionally, we cross-referenced the tax registry for absence or presence using several sources of address information obtained for or referenced for 2006: (i) Teledanmark( 21 ), a telephone company (n 189); (ii) Google Maps Denmark (http://www.googlemaps.dk; n 172); (iii) Krak Denmark (http://www.krak.dk; n 171), a web-based business search engine; and (iv) Stockmann Company( 22 , 23 ) (n 109), a commercial address supplier that publishes annual information on large chain supermarkets and food kiosks (single-owned and chain stationary convenience stores). Addresses were geocoded and categorized according to NACE descriptions.
We conducted an on-site food outlet inventory in fourteen Copenhagen school districts by using a combined address list derived from five sources of information. Gamma statistics (Goodman–Kruskal's gamma) were performed to determine a summary level of concordant and discordant pairs between secondary sources and field data, establishing statistical significance at the 0·05 level. We also calculated the PPV, sensitivity and percentage agreement( Reference Hoehner and Schootman 24 ) in order to maintain comparability with other studies. We use the same categorization for PPV as Paquet and colleagues( Reference Paquet, Daniel and Kestens 11 ): <0·30 (poor), 0·31–0·50 (fair), 0·51–0·70 (moderate), 0·71–0·90 (good) and >0·91 (excellent). Gamma coefficients were evaluated according to Kreiner( Reference Kreiner 25 ): >0·30 (strong), 0·15–0·30 (moderate) and <0·15 (weak).
Results
A total of 147 of 202 food outlets were present, while fifty-five were absent from field survey (Table 1). Approximately 25 % of kiosks and 27 % of fast-food outlets (hot dog stands and grill bars) were found in the field, while another 26 % of kiosks and 27 % of fast-food outlets were absent.
Table 1 Frequency and percentage of food outlet classifications in fieldwork, Copenhagen, Denmark, 2006
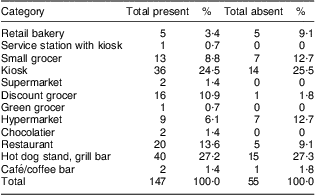
| Category | Total present | % | Total absent | % |
| Retail bakery | 5 | 3·4 | 5 | 9·1 |
| Service station with kiosk | 1 | 0·7 | 0 | 0 |
| Small grocer | 13 | 8·8 | 7 | 12·7 |
| Kiosk | 36 | 24·5 | 14 | 25·5 |
| Supermarket | 2 | 1·4 | 0 | 0 |
| Discount grocer | 16 | 10·9 | 1 | 1·8 |
| Green grocer | 1 | 0·7 | 0 | 0 |
| Hypermarket | 9 | 6·1 | 7 | 12·7 |
| Chocolatier | 2 | 1·4 | 0 | 0 |
| Restaurant | 20 | 13·6 | 5 | 9·1 |
| Hot dog stand, grill bar | 40 | 27·2 | 15 | 27·3 |
| Café/coffee bar | 2 | 1·4 | 1 | 1·8 |
| Total | 147 | 100·0 | 55 | 100·0 |
Compared with an ideal PPV (1·0), all data sources scored above 0·80 (Table 2), indicating a high proportion of addresses positively identified on the street. There was strong and significant positive concordance between the field and Google Maps (γ = 0·87) and Krak.dk (γ = 0·89), with Stockmann having the highest correspondence with field survey (γ = 0·98). Sensitivity values were highly significant, ranging between 0·74 (Teledanmark) and 0·93 (Stockmann), indicating moderate to high concordant pairs. In correspondence with field findings, the tax registry had the lowest percentage of agreement (0·64), while Stockmann had the highest (0·91).
Table 2 Comparability of sources of food outlet data against fieldwork, by type and by agreement statistics, Copenhagen, Denmark, 2006
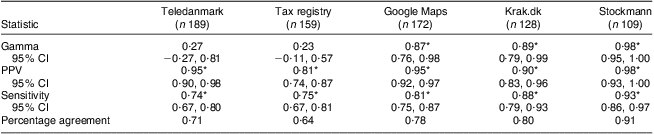
| Teledanmark | Tax registry | Google Maps | Krak.dk | Stockmann | |
| Statistic | (n 189) | (n 159) | (n 172) | (n 128) | (n 109) |
| Gamma | 0·27 | 0·23 | 0·87* | 0·89* | 0·98* |
| 95 % CI | −0·27, 0·81 | −0·11, 0·57 | 0·76, 0·98 | 0·79, 0·99 | 0·95, 1·00 |
| PPV | 0·95* | 0·81* | 0·95* | 0·90* | 0·98* |
| 95 % CI | 0·90, 0·98 | 0·74, 0·87 | 0·92, 0·97 | 0·83, 0·96 | 0·93, 1·00 |
| Sensitivity | 0·74* | 0·75* | 0·81* | 0·88* | 0·93* |
| 95 % CI | 0·67, 0·80 | 0·67, 0·81 | 0·75, 0·87 | 0·79, 0·93 | 0·86, 0·97 |
| Percentage agreement | 0·71 | 0·64 | 0·78 | 0·80 | 0·91 |
PPV, positive predictive value.
*Statistic (95 % CI) significant at <0·0001 level.
Discussion
Findings suggest that levels of correspondence between secondary data sources and field analysis were good to excellent and comparable with coefficients reported elsewhere( Reference Paquet, Daniel and Kestens 11 , Reference Lake, Burgoine and Greenhalgh 13 , Reference Cummins and Macintyre 16 ). Hoehner and Schootman( Reference Hoehner and Schootman 24 ) reported overall percentage agreement of 32·0 % using two databases of food outlet data in St. Louis, MO, USA, while we report higher values. Differences in percentage agreement between the studies may be attributed to study size and scope, and are thus not directly comparable. We included gamma statistics in the present analysis because we wanted to obtain robust measures of agreement, which allows us to examine the association of two groups containing a large number of ties. Gamma statistics were low when percentage agreement fell below 0·75, indicating that scores may be sensitive to distributional changes or low cell number, further illustrating the importance of examining frequency distributions of concordant and discordant pairs.
There are also several explanations for differences found between sources of address information. One difference may be related to why each source of address information is constructed in the first place. The tax registry for instance, as it is designed to list tax revenue, likely includes extraneous information such as a home address instead of a business address, if the operator owns a small business. Additionally, the registry chronicles all businesses ever having a tax number, but does not provide information on whether the business is actively operating. Characteristics based solely on the tax registry may result in an overestimation in the number of food outlets due to inclusion of either obsolete businesses or home addresses of owners( Reference Burgoine 26 ). In our case, tax registry information would have led to under-reporting of the food environment. We noted higher correspondence values for other secondary sources of address information (the telephone company, Krak.dk and Google Maps), while acknowledging that results could be affected by subscription status, leading to under-reporting in the number of food outlets if the vendor withdraws advertising services during sampling of addresses. However, secondary sources of business information such as the telephone company are still significant sources of food outlet information( Reference Burgoine 26 ). Lastly, we found very high correspondence using addresses purchased from Stockmann, which may indicate the reliability of purchased information. However, the information provided represents only high-revenue supermarkets as well as outlets listed as food kiosks. Thus, a considerable number of small independent supermarkets or fast-food outlets will not be represented.
Study limitations include the use of a small study sample, rather than a city-wide census, and we have not considered other potential contexts such as rural or urban differences. While area deprivation may affect percentage agreement as shown by Cummins and Macintyre( Reference Cummins and Macintyre 16 ), we were unable to stratify the analysis due to sample size limitations. Additionally, we cannot rule out misclassification bias. Business categorizations tend to be broader within the tax registry and may not reflect actual items sold by food outlets, making it even more necessary to conduct field surveys. Overall strengths include an examination of a wide variety of food outlets, providing a varied representation of the spatial distribution of the neighbourhood food environment. Our study used a variety of sources of secondary information, providing us with a reliable estimation of food outlets in the field.
Conclusion
The current study demonstrates that address information used to characterize the food environment should be used with caution and correspondence between secondary address sources and field observations vary. While there may not be a single source used to characterize food environments in Denmark, the use of combined sources is recommended.
Acknowledgements
This work was made possible through grants funded by the Danish Graduate School in Public Health Science (GRASPH) at the University of Copenhagen; the Danish Health Fund (grant number 2007B057); the Danish Heart Foundation (grant number 07-4-B195-A1547-22388F); and the Nordea Fund. The authors declare that there are no conflicts of interest. C.M.S., B.E.H. and P.D. were responsible for conception of the study, study design and setup. C.M.S. carried out data collection, analyses and drafting of the manuscript. B.E.H. and P.D. assisted with drafting the manuscript and provided additional commentary.


