


CVD are increasing throughout the world and cause 16·7 million deaths each year, 80 % of which occur in low- and middle-income countries. Most cardiovascular risk in the Southern Cone of Latin America (Argentina, Chile and Uruguay) could be explained by tobacco use, abnormal lipids, abdominal obesity and high blood pressure, as shown in the INTERHEART Latin American study that included 3125 cases and controls from different Latin American countries( Reference Lanas, Avezum and Bautista 1 ). In Argentina, recent estimates have shown that there were more than 600 000 disability-adjusted life years and almost 400 000 years of potential life lost due to CHD and stroke in 2005. Modifiable risk factors explained 75·0 % of fatal and non-fatal acute CHD and stroke events, 75·5 % of costs for acute events and 70·7 % of disability-adjusted life years lost( Reference Rubinstein, Colantonio and Bardach 2 ).
Nutritional exposures are considered risk factors for CVD as well as other non-communicable and infectious diseases( Reference Bhupathiraju and Tucker 3 , Reference Popkin 4 ). FFQ are often used in epidemiological studies to investigate the relationship between diet and disease because they are easy to administer, less expensive than other methods and can, at least theoretically, assess dietary intake over an extended period of time( Reference Molag, de Vries and Ocke 5 ). Usually FFQ are not considered an appropriate method of estimating actual nutrient intakes of individuals, but they can be used to rank people according to their intake. This information is useful to categorize nutritional exposures for epidemiological studies( Reference Thompson and Subar 6 ).
FFQ may be administered by trained interviewers or self-administered, according to the needs of the study and the target population. Self-administered questionnaires reduce the administration costs but require more careful preparation and pre-testing( Reference Cade, Burley and Warm 7 ). Moreover, because FFQ are culture- and context-specific, it is important to document the reproducibility and validity of any new questionnaire and to measure the performance of previously tested questionnaires for use in substantially different populations( Reference Willett and Lenart 8 ).
In Argentina, Chile and Uruguay, several FFQ were developed to assess dietary intakes in adult populations and some of them have been tested by assessing validity, reproducibility or both( Reference Ronco, De Stefani and Boffetta 9 – Reference Dehghan, Martinez and Zhang 12 ). To our knowledge, no validation study of a self-administered FFQ has been conducted on adult populations in the Southern Cone of Latin America. Therefore, we adapted the self-administered FFQ developed by the US National Cancer Institute in order to assess food intake and dietary patterns of the CESCAS I Study population( Reference Rubinstein, Irazola and Poggio 13 ). CESCAS I is an ongoing observational prospective cohort study that aims to detect and follow CVD and its risk factors in a multistage probabilistic sample of 7600 adults from four mid-sized cities representing the Southern Cone of Latin America: Bariloche and Marcos Paz in Argentina, Temuco in Chile and Pando-Barros Blancos in Uruguay. Thus, the objective of the present study was to assess the reproducibility and validity of this tool among adults in these countries with the purpose of introducing it in CESCAS I and in further epidemiological and nutritional research studies in our region.
Experimental methods
Study design
The present study was an observational, analytic study that assessed validity and reproducibility (test–retest reliability) of an adapted self-administered FFQ in adult populations in Argentina, Chile and Uruguay. Reproducibility was evaluated by comparing the estimated nutrient intakes derived from the FFQ administered on two occasions: at the beginning of the study (FFQ1) and 3 months later (FFQ2). Inter-method reliability was assessed by comparing the estimated nutrient intakes derived from FFQ1 with the average of the estimated nutrient intakes derived from three (from two weekdays and one weekend day) 24 h dietary recalls (24HR), administered at baseline and at 3 and 6 months later. The selected days of the week and the order of administration day were randomly assigned. The first 24HR was applied in the first or second week following the date on which FFQ1 was completed. The second 24HR was administered between weeks 11 and 13. The third 24HR was administered between weeks 23 and 25.
The information collected in the first interview included baseline demographic data (age, gender and level of education) and self-reported weight and height. BMI was calculated from these data.
Participants
We included individuals between the ages of 21 and 74 years, both male and female, living in Argentina, Chile or Uruguay. We excluded individuals who were pregnant, illiterate, had cognitive impairment, or had changed their usual diet during the last year due to a new medical diagnosis.
Participants were recruited from primary-care centres in each country from September 2010 to February 2011. The enrolment of participants to the study was based on opportunistic sampling of people who attended the primary-care clinics. The study was conducted at the following centres: Hospital Italiano de Buenos Aires, Servicio de Medicina Familiar (Buenos Aires, Argentina); Centro de Salud Familiar Labranza (Temuco, Chile); and Unidad Docente Asistencial del Centro Cívico Salvador Allende, Dpto de Medicina Familiar y Comunitaria (Canelones, Uruguay).
Ethics statement
The study was conducted according to the guidelines laid down in the Declaration of Helsinki and all procedures involving human subjects were approved by the Comité de Ética de Protocolos de Investigación (CEPI) del Hospital Italiano de Buenos Aires (Argentina), the Comité de Evaluación Científica del Servicio de Salud Araucanía Sur (Chile) and the Comité de Ética de la Facultad de Medicina de la Universidad de la República (Uruguay). Written informed consent was obtained from all participants.
FFQ
We based the questionnaire on the Spanish version of the Dietary History Questionnaire I (DHQI) developed by the US National Cancer Institute( Reference Subar, Thompson and Kipnis 14 ). This is a self-administered FFQ developed for the Spanish-speaking population in the USA. The original structure of the questionnaire was maintained. However, the list of foods and beverages was modified to include only those frequently consumed in Argentina, Chile and Uruguay according to data obtained from the first National Nutrition and Health Survey conducted in Argentina( 15 ), food lists included in other FFQ already validated in these countries( Reference Navarro, Osella and Guerra 10 – Reference Dehghan, Martinez and Zhang 12 ) and expenditure survey data from Uruguay( Reference Bove and Cerruti 16 ). The food names and examples of brand names were adapted to the usual names of the foods and available brands in each country. Small, medium and large portion sizes were expressed in units and household measures like cups or spoons depending on the item. To ensure face and content validity, the food list, examples of brand names and portion sizes were checked by expert nutritionists from the three countries and were modified according to their indications. Later, a cognitive evaluation of the questionnaire was carried out through in-depth interviews in a sample of ten individuals, both male and female, with low educational level (primary school or less). Some questions were reformulated according to the results of the interviews and a short set of instructions was developed including the frequently asked questions. The adapted FFQ queries the frequency of intake for 126 separate food items during the last 12 months and asks the portion size for most of these by providing a choice of three sizes. For fifty-five of the 126 foods, between one and eight additional embedded questions are asked regarding factors such as seasonal intake, food type (e.g. low fat, lean, diet) and/or fat uses or additions. The questionnaire also includes seven additional questions about the use of low-fat or low-sugar foods, four summary questions and nine dietary supplement questions.
A useful way of overcoming limited interviewer resources is to design a self-administered questionnaire including an opportunity for the responses to be reviewed and to clarify any doubts/queries in a face-to-face or telephone interview( Reference Cade, Burley and Warm 7 ). In the present study, as well as in CESCAS I, trained interviewers handed out the FFQ with written instructions and provided an oral explanation to participants. After clarifying any doubts, respondents were asked to complete the FFQ at home and return it one week later. At that time, the interviewer checked the completion of the questionnaire. Before the third month started, participants were contacted by telephone to arrange a new appointment at the health centre. The questionnaire and written instructions were sent via mail to be completed at home, preceding the interview.
24 h Dietary recalls
We collected three 24HR, including data from two weekdays and one weekend day. Due to feasibility, the dietary recalls were conducted in a period of 6 months, although the FFQ asked about intake during the last year. Also, the first 24HR was collected during the 6-month period between September and February, and for 65 % of the participants, a day representing summer and a day representing winter were collected, taking into account the greater variability of food intake in the year.
The 24HR were collected using the multiple-pass method( Reference Conway, Ingwersen and Vinyard 17 , Reference Conway, Ingwersen and Moshfegh 18 ) by personal interview at the primary-care centre. The method consisted of five steps: a quick list (the participant lists foods and beverages consumed); followed by questions regarding usually forgotten foods; time and occasion on which foods were consumed; descriptions of foods and amounts eaten, estimated by using a validated photograph album( Reference Vázquez and Witriw 19 , Reference López, Longo and Carballido 20 ); and a final review.
The list of codes for foods, beverages and dietary supplements was based on the ones used in the first National Nutrition and Health Survey conducted in Argentina( 21 , 22 ). It was completed with items from Chile and Uruguay and regularly updated when necessary during the data collection process.
Well-trained interviewers are crucial in administering a 24HR questionnaire because much of the dietary information is collected by asking probing questions( Reference Thompson and Subar 6 ). To standardize the procedures for data collection in the three countries, an Interviewer Manual was developed detailing the protocol for the interview, including standardized neutral probing questions to avoid leading the respondent to specific answers when he/she really does not know or remember. The manual also included standardized procedures for the post-interview activities like final estimation of food quantities (in grams). The interviewers, who were dietitians, were trained by senior nutritionists. They also reviewed all the collected data in terms of the completeness, consistency and food codification.
Estimated food and nutrient intakes and food composition database
Data from the FFQ were converted to an average daily intake for each food, beverage and supplement by considering the frequency of consumption and the portion size or amount of the food/beverage/supplement consumed. Information for each 24HR was summarized as a daily food intake and the average daily intake was calculated. Estimated intakes for energy, twenty nutrients, and fruits and vegetables were evaluated. For dietary Na intake, foods, beverages and supplements were taken into account, but Na from salt added while cooking or at the table was not estimated.
Energy and nutrient intakes were estimated using the LATINFOODS database( 23 ) and related data( 24 , Reference Schmidt-Hebbel, Pennacchiotti-Monti and Masson 25 ). When composition data regarding some foods and beverages were not available, information was completed with other sources including the database developed for the National Nutrition and Health Survey in Argentina( 22 ) and other published articles( Reference Navarro, Munoz and Lantieri 26 , Reference Peterson, Aguilar and Espeche 27 ). If no local, national or regional data were available for one or more selected nutrients for a particular food, we completed this information with information from the US Department of Agriculture's National Nutrient Database for Standard Reference, Release 21( 28 ), taking into account water and/or fat content according to international compilation guides( Reference Greenfield 29 ).
Statistical analysis
Descriptive statistics were calculated to assess demographic characteristics and BMI. Categorical variables were summarized by calculating absolute and relative frequencies. Numerical variables were summarized as mean and standard deviation or as median and interquartile range, depending on their distribution. Median nutrient/selected food group intakes were calculated. Crude, observed median intakes from the first FFQ (FFQ1) and second FFQ (FFQ2), and from FFQ1 and the 24HR, were compared using the sign test. Graphics (e.g. histogram, normal probability plot) and the Shapiro–Wilk test were used to assess normality of the nutrient and food group intakes. We used a log transformation, as necessary, to meet the assumption of normal distribution for nutrient and food intakes derived from both instruments.
To assess reproducibility between the first and second questionnaires (FFQ1 v. FFQ2), intra-class correlation coefficients (ICC) and 95 % confidence intervals were calculated.
To assess validity, Pearson product-moment correlations were used to compare nutrient/selected food group intakes obtained from FFQ1 with those from the average of the three 24HR. Correlations were obtained based on absolute nutrient/selected food group intakes and using energy-adjusted variables. Adjustment for total energy intake was made by using the residual method described by Willett( Reference Willett 30 , Reference Willett, Howe and Kushi 31 ). The correlation coefficients were corrected (de-attenuated) to account for random within-person error in the intake measurements obtained by 24HR( Reference Willett 30 ). The within-person and between-person variances of nutrient and food intakes were obtained from ANOVA on the three repeated days of dietary intake from the 24HR.
The degree of misclassification across categories between the FFQ and the 24HR was examined by dividing food consumption amounts and nutrient intakes into quintiles based on both methods( Reference Willett, Sampson and Stampfer 32 ). The proportions of participants correctly categorized into the lower and upper quintiles or into the lowest two or the highest two quintiles, and the proportion misclassified into extreme quintiles, were calculated.
The differences between individuals’ FFQ1- and 24HR-derived nutrient/food group intakes were also examined, as has been done in other validation studies( Reference Hebert, Gupta and Bhonsle 33 , Reference Hebert, Gupta and Bhonsle 34 ). Linear regression was also used to assess the agreement between the intakes derived from FFQ1 and the average of those obtained from the 3 d of 24HR( Reference Hebert, Gupta and Bhonsle 33 , Reference Hebert, Gupta and Bhonsle 34 ).
Statistical analysis was performed using the statistical software package Stata/SE 10·1 for Windows.
Results
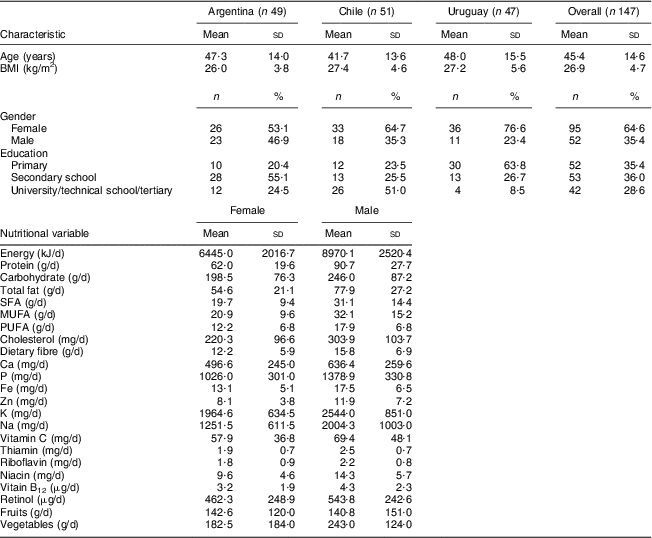
A total of 157 individuals, aged 21 to 74 years old, agreed to participate in the study and completed FFQ1 and the first 24HR. Of this sample, 149 also completed the three 24HR and FFQ2. A total of 147 participants, ninety-five women and fifty-two men, were included in the final analyses after data from two women were excluded because they got pregnant during the study period. Demographic characteristics of the participants and BMI by country can be seen in Table 1. Table 1 also shows 24HR-derived nutrient/food group intakes by gender. The mean height for men was 170 (sd 7) cm and the mean height for women was 156 (sd 6) cm; corresponding values for mean weight were 80 (sd 14) kg and 63 (sd 12) kg. Demographic characteristics of participants who did not complete the study (three from Argentina, three from Uruguay and two from Chile) were not different from those of the 147 who finished the study (P > 0·05; data not shown).
Table 1 Sociodemographic characteristics by country and nutritional variables by gender; adults (n 147) aged 21–74 years from the Southern Cone of Latin America (Argentina, Chile and Uruguay), September 2010 to February 2011
Reproducibility
Table 2 shows the observed median intakes for energy, twenty nutrients, percentage of energy from macronutrients and two food groups (fruits and vegetables) based on the first and second administration of the FFQ. Of the twenty nutrients analysed, for nine (protein, carbohydrate, dietary fibre, Ca, P, K, thiamin, riboflavin and retinol) and for vegetables and fruits, the estimated median intake from FFQ1 was greater than the estimate from FFQ2 (P < 0·05). The maximum difference between median intakes from both questionnaires was 19 % among the nutrients (for Ca) and 37 % among the food groups (for fruits). ICC that measure the reproducibility of the unadjusted estimated intakes from the FFQ spaced 3 months apart are also shown in Table 2. Estimated nutrient intake ICC ranged from 0·49 (for percentage of energy from protein) to 0·74 (for total fat). The ICC was 0·49 for vegetables and 0·62 for fruits.
Table 2 Reproducibility: median daily intakes of energy, nutrients, fruits and vegetables based on the first and second FFQ (FFQ1 and FFQ2) and intra-class correlation coefficients (ICC) between daily intakes from the first and second FFQ (FFQ1 v. FFQ2); adults (n 147) aged 21–74 years from the Southern Cone of Latin America (Argentina, Chile and Uruguay), September 2010 to February 2011
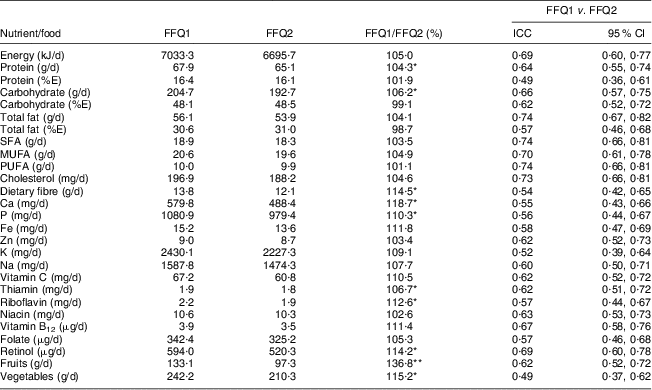
%E, percentage of energy.
*P < 0·05, **P < 0·01.
Validity
Difference scores, obtained by subtracting the FFQ1-derived scores from the 24HR-derived scores, are shown in Table 3. There was no significant difference between the mean intakes of macronutrients, fatty acids, cholesterol, Ca, Zn, Na, thiamin and niacin estimated by both methods. However, mean differences and/or sd in other nutrient intakes were larger (P < 0·05). Table 3 also shows the correlation between the estimates from FFQ1 and the average of the three 24HR. The correlation coefficients of the energy-unadjusted values varied from 0·26 for niacin to 0·52 for fruits. The mean correlation coefficient for energy, nutrients and the two food groups was 0·37. After energy adjustment, correlation coefficients ranged from 0·39 (for thiamin and cholesterol) to 0·59 (for carbohydrate), and was 0·46 for vegetables and 0·49 for fruits. After de-attenuation (correction of random within-person error), the mean energy-adjusted correlation coefficients improved to 0·66 among the nutrients and to 0·59 for vegetables and fruits. Table 3 also shows the results of the linear regression model obtained by performing the regression of FFQ1-derived nutrient/food group intakes v. those derived from the three 24HR.
Table 3 Validity: mean differences in intakes of energy, nutrients, vegetables and fruits based on the first FFQ (FFQ1) and the average of three 24 h dietary recalls (24HR), Pearson correlation coefficients and regression coefficients between both methods; adults (n 147) aged 21–74 years from the Southern Cone of Latin America (Argentina, Chile and Uruguay), September 2010 to February 2011
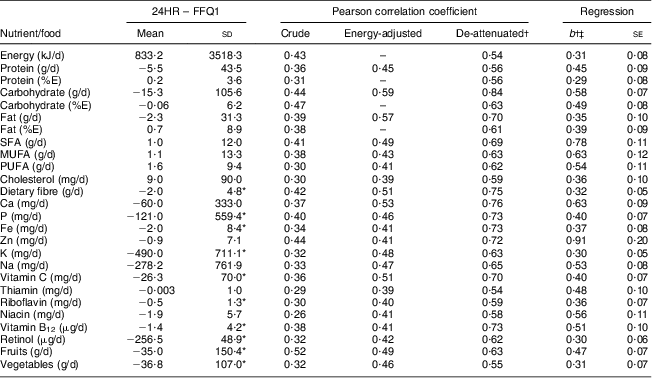
%E, percentage of energy.
*P < 0·05.
†Observed correlations were based on energy-adjusted values apart from energy and percentages of energy from macronutrients.
‡The regression coefficient is obtained by performing the regression of the specified FFQ-derived nutrient intake v. the 24HR-derived nutrient intake.
Cross-classification by quintile of energy-adjusted intakes from both methods is shown in Table 4. Overall, 66 % of participants in the lowest 24HR quintile were in the lowest one or two FFQ1 quintiles, and 62 % of those in the highest 24HR quintile were in the highest one or two FFQ1 quintiles. On average, only 4 % were misclassified into extreme quintiles.
Table 4 Validity: comparison of the first FFQ (FFQ1) with the average of three 24 h dietary recalls (24HR) for energy-adjusted nutrients and foods, based on cross-classification by quintile (%); adults (n 147) aged 21–74 years from the Southern Cone of Latin America (Argentina, Chile and Uruguay), September 2010 to February 2011

%E, percentage of energy.
†Energy and percentages of energy from macronutrients are based on energy-unadjusted data.
Discussion
We adapted a self-administered FFQ for adults in Argentina, Chile and Uruguay to assess dietary intake as a baseline measure in the CESCAS I Study. This questionnaire showed moderate to good validity (energy-adjusted r varied from 0·4 to 0·6, while de-attenuated r ranged from 0·5 to 0·8) and reproducibility (ICC varied from 0·5 to 0·7) for energy and twenty nutrient intakes and vegetable and fruit consumption. With regard to cross-classification into quintiles by the FFQ and 24HR, 64 % of participants in the lowest and upper 24HR quintiles were classified into the same or adjacent quintile according to their energy-adjusted intakes from FFQ1, thus making this tool acceptable to assess categories of food and nutrient intakes in this population.
Estimates of some of the nutrients, vegetables and fruits were higher in FFQ1 v. FFQ2. This could be due to a training effect or sensitized participants with respect to food consumption that may result in changing reported nutrient intakes over time, with more accurate answers on the second occasion( Reference Gibson 35 ). This conclusion is supported by the fact that many of the estimates of these nutrients were similar in FFQ2 and dietary recalls. Differences in the same direction have been observed in other studies in Argentina( Reference Navarro, Osella and Guerra 10 , Reference Dehghan, del Cerro and Zhang 11 ) but were not present in a Uruguayan study( Reference Ronco, De Stefani and Boffetta 9 ). Focusing on FFQ1 usually provides a conservative estimate of the true correlation between the questionnaire and the detailed method. It is a naïve ‘picture’ of the individual's diet which one would typically have for use in an epidemiological study( Reference Willett 30 , Reference Hebert, Gupta and Bhonsle 34 , Reference Gibson 35 ). On the other hand, our results compare well with other reproducibility studies where the correlation coefficients for nutrient intakes have typically ranged from 0·5 to 0·7, and correlations are somewhat higher for repeat administrations 1 month or less apart (compared with those administered 6 months to 1 year apart)( Reference Cade, Burley and Warm 7 , Reference Willett 30 ). A recent questionnaire developed for rural and urban populations in Argentina by the PURE Study Group( Reference Dehghan, del Cerro and Zhang 11 ) showed lower ICC between their questionnaires, administered 1 year apart, as compared with our study. These differences can be explained in part by the extension of the period between survey administrations. Navarro et al.( Reference Navarro, Osella and Guerra 10 ) developed another questionnaire in Argentina administered between 9 months and 1 year apart. Pearson coefficients, instead of ICC, for energy-adjusted values were computed and were higher than our values. In addition, Ronco et al.( Reference Ronco, De Stefani and Boffetta 9 ) developed a questionnaire for Uruguayan adults where Pearson coefficients were also calculated, with similar results to those tested in the present study. For studies assessing validity, correlation coefficients typically range from 0·5 to 0·7( Reference Willett 30 ), and coefficients lower than 0·4 may produce a significant attenuation of the association between exposure and event in epidemiological studies( Reference Sempos 36 ). In our study, energy-adjusted correlation coefficients ranged from 0·39 to 0·59 and improved after de-attenuation to >0·54, showing moderate to good validity. Our results were similar to the previous studies in Argentina and Chile which used questionnaires administered by trained interviewers( Reference Navarro, Osella and Guerra 10 – Reference Dehghan, Martinez and Zhang 12 ). Overall, we did not find significant differences in median intakes for energy, macronutrients, fatty acids, cholesterol, Ca, Zn, Na, thiamin, niacin and folate obtained by FFQ and dietary records. However, we should view these results with caution when interpreting absolute intakes for the other evaluated nutrients and food groups. Also, only two regression coefficients were closer to 1·0 in the analyses comparing the 24HR-derived scores with those from FFQ1. In some instances, difference scores were very large and FFQ1-derived scores were generally larger than the 24HR data. Even in instances where linear and rank order agreement were good, there were some large differences in the point estimates of the nutrient scores, as Hebert et al. have pointed out in previous studies( Reference Hebert, Gupta and Bhonsle 34 ). On the other hand, FFQ are generally used for ranking individuals according to food or nutrient intake rather than for estimating absolute levels of intake( Reference Thompson and Subar 6 ). In the present study, cross-classification by quintile was very good for most of the evaluated nutrients and foods, allowing the ranking of participants according to their intakes. Moreover, FFQ are widely used in epidemiological studies to assess the association between dietary intake and disease risk, and for estimating relative risks. In this regard, the degree of misclassification of individuals is more relevant than the quantitative scale on which the ranking is made( Reference Thompson and Subar 6 ).
We chose three 24HR as our reference method. One alternative, a multiple-day weighed record, has few correlated errors with the FFQ, but the process of keeping a diet record may alter food intake and represent more of a burden for the respondent( Reference Willett 30 ). It is logistically less feasible than the 24HR. Also, diet records, as well as dietary recalls and FFQ, rely on food composition databases to estimate nutrient intakes. The FFQ and the 24HR have some similar error sources, like the reliance on memory and the perception of portion size( Reference Cade, Burley and Warm 7 , Reference Willett 30 , Reference Gibson 35 ), although the FFQ relies on long-term memory and the 24HR on short-term memory. In addition, the 24HR method was interviewer-based using open-ended questions, whereas the FFQ was self-administered with closed-ended questions. Even when several days of dietary information are necessary to describe individual usual dietary intake, Stram et al.( Reference Stram, Longnecker and Shames 37 ) and Willett( Reference Willett 30 ) found that the greatest statistical efficiency is obtained with two to five data points per subject, combined with a statistical adjustment to remove the effects of within-person variation. We adopted this approach, but caution is necessary to interpret corrected correlation coefficients in nutrients with very low ICC between repeat measurements, such as cholesterol, due to the sample size of our study. Extending the collection period could have improved the validity of the reference method.
It is certainly possible to improve this questionnaire. In particular, analyses of the dietary recalls obtained in the present study as well as the availability of new data can be used to further define the specific intake of foods that contribute to the major variation in the nutrients of interest.
On the other hand, for practical considerations, we limited our study to adults from three cities in the Southern Cone of Latin America where CESCAS I, our population-based prospective cohort study, is taking place. Particularly in Temuco, Chile, participants included in our sample had higher educational status compared with participants from the other countries. However, since the CESCAS I Study is being conducted on a larger population-based sample of adults in Temuco, the food patterns will include a broader population with respect to educational attainment and thus will allow comparisons among the adult participants of the three countries.
Conclusion
To our knowledge, this is the first self-administered FFQ tested in adults living in Argentina, Chile and Uruguay and can be a useful and low-cost tool to assess diet as a determinant of the cardiovascular epidemic and other non-communicable diseases in future epidemiological research in the Sothern Cone of Latin America.
Acknowledgements
Sources of funding: Field work in Argentina was partially supported by the Comisión Nacional Salud Investiga, Ministerio de Salud de la República Argentina (N.E., Individual Carrillo-Oñativia Research Grant 2011). The Ministerio de Salud de la República Argentina had no role in the design, analysis or writing of this article. Conflicts of interest: There are no conflicts of interest. Authors’ contributions: N.E. and V.E.I. conceived and designed the study, conducted the analysis and wrote the manuscript. M.D.D. contributed to the analysis and critically reviewed the manuscript. M.B. and S.P.M.-O. conducted the field work in Uruguay and Chile, and critically reviewed the manuscript. A.L.R. and A.M.W. contributed to the design of the study and critically reviewed the manuscript. All authors approved the final version of the manuscript. Acknowledgements: The authors thank Rocío Suarez Eytel, Nutr., Natalia Tomma, Nutr. and Valentina Guillermo, Nutr. for the collection of the dietary data. Special thanks are due to Luz Gibbons, MSc and Laura Gutierrez, MSc for assistance with data management and Gabriela Cormick, MSc for her participation in the preliminary adaptation of the questionnaire and review of the manuscript. The authors also thank Emily Weaver for her review of the text.


