Childhood overweight and obesity is a global public health concern( Reference Abarca-Gómez, Abdeen and Hamid 1 ) which is linked to cardiovascular risk factors, type 2 diabetes, dental caries and other chronic diseases in adulthood( Reference Kumar and Kelly 2 ). In Latin America, 20 to 25 % of the population under the age of 19 years is overweight or obese( Reference Rivera, de Cossío and Pedraza 3 ). Specifically, 21 % of Costa Rican children aged 5–12 years were already affected in 2009( 4 ), and this percentage increased to 34 % by 2016( 5 ). Given the alarming number of children with overweight or obesity, its detrimental effects on health and the high burden for health systems, it is urgent to implement policies to prevent excess weight gain among children( Reference Corvalán, Garmendia and Jones-Smith 6 , Reference Tirado, Galicia and Husby 7 ).
Among the many factors that influence the development of overweight and obesity in children are a sedentary lifestyle, an unhealthy diet, various socio-economic factors and the food environment in which they live( Reference Kumar and Kelly 2 , Reference Popkin, Adair and Ng 8 ). Previously established research supports that television (TV) viewing is associated with obesity among children because it is a sedentary activity that also exposes them to food and drink advertisements that have a significant effect on their food preferences( Reference Hancox, Milne and Poulton 9 – Reference Cairns, Angus and Hastings 11 ). In Costa Rica, however, there is little research regarding the causes of excess weight gain in children. Studies have assessed differences in the built environment in which children interact( Reference Medina, Rojas and Retana 12 ), explored barriers and facilitators for healthy eating( Reference Gómez-Alpízar, González-Urrutia and Flores-Castro 13 ), and determined geographic differences in the prevalence of obesity( Reference Barrantes-Montoya, Calderón-Rodríguez and Morales 14 ).
Marketing of unhealthy foods and beverages (i.e. those high in energy density, saturated fat, sugar and/or sodium) has been shown to influence children’s food preferences and consumption, which is reflected in the increase of their energy intake and body weight outcomes( Reference Sadeghirad, Duhaney and Motaghipisheh 15 – Reference Goris, Petersen and Stamatakis 18 ). In May 2010, 192 Member States endorsed a resolution to globally restrict the marketing of food and non-alcoholic beverage products high in saturated fats, trans-fatty acids, free sugars and/or salt to children( Reference Kraak, Vandevijvere and Sacks 19 ), which is in line with recommendations from the WHO and the Pan American Health Organization (PAHO) who have called on national governments to take leadership and implement actions to restrict this type of marketing towards children( 20 , 21 ). Furthermore, in 2013, the ministers of health and representatives of the WHO Member States signed the Vienna Declaration, which included a commitment to take decisive action to reduce the exposure of children to unhealthy food marketing( 22 ). UNICEF has also called upon governments, civil society and the private sector to improve advertisement practices in Latin American countries( 23 ), while more recently in 2017 the Commission on Ending Childhood Obesity highlighted the need to implement the set of marketing recommendations that had been previously developed by the WHO( 24 ).
The International Network of Food and Obesity/non-communicable diseases Research, Monitoring, and Action Support (INFORMAS) is a global network that conducts work with the objective of monitoring, benchmarking and supporting actions to increase healthy food environments( Reference Swinburn, Sacks and Vandevijvere 25 ). Food promotion is one of the seven key aspects to monitor in relation to food environments. INFORMAS methodology was used for the present study.
Food marketing to children on TV has previously been assessed in several countries, including Argentina( Reference Allemandi, Castronuovo and Tiscornia 26 ), Brazil( Reference Kelly, Halford and Boyland 27 ), Chile( Reference Correa, Reyes and Taillie 28 ), Guatemala( Reference Cosenza, Morales-Juárez and Kroker-Lobos 29 ), Honduras( Reference Gunderson, Clements and Neelon 30 ), Mexico( Reference Rincón-Gallardo Patiño, Tolentino-Mayo and Monterrubio 31 ), the USA( Reference Powell, Schermbeck and Chaloupka 32 ), Canada( Reference Kelly, Halford and Boyland 27 ), New Zealand( Reference Vandevijvere, Soupen and Swinburn 33 ), Australia( Reference Kelly, Smith and King 34 ), South Africa( Reference Mchiza, Temple and Steyn 35 ), and several countries in Europe( Reference Kelly, Halford and Boyland 27 ) and Asia( Reference Kelly, Hebden and King 36 ). To our knowledge, only one small study in 2015, which was part of an undergraduate thesis, has explored TV food marketing to children in Costa Rica (C Bustamante, N Fonseca, M Guzmán et al., unpublished results), and therefore the extent of unhealthy food and beverage marketing to children remains unknown. Evidence such as the frequency of food advertising, the relative healthiness of products advertised and the marketing techniques used by the food industry could help justify the design of a policy by health authorities (i.e. Ministry of Health) and later serve as a baseline to measure progress achieved.
The objective of the present study was to analyse TV advertising of foods and beverages directed to children aged 4–11 years who live in Costa Rica, including: (i) the frequency of commercials; (ii) the type and nutritional quality of the foods and beverages that are promoted; and (iii) the persuasive marketing techniques used within those food and beverage advertisements.
Methods
The methodology of the present study (including sampling, recording and assessment of advertisements (ads)) was done in adherence to a standardized protocol suggested by the food promotion module of INFORMAS( Reference Kelly 37 ). This protocol was developed by the University of Auckland in 2014 and last updated in November 2017. Slight changes were made, which are specified throughout this section.
Data sampling and collection
The sampling frame was defined as the TV ads that were aired between September and November 2016 in San José, Costa Rica. We recorded TV programming on four channels (INFORMAS protocol( Reference Kelly 37 ) suggests a minimum of three): two national broadcast channels and two cable channels. A USB Advanced Television Systems Committee (ATSC) tuner was used to record and store the live programming in a computer for later analyses; no permissions were obtained to record and analyse programming.
For the national broadcast channels, the two with the highest overall ratings were selected (Teletica Channel 7 and Repretel Channel 6). The two cable channels (Cartoon Network and Disney Channel) were selected based on their popularity with children aged 4–11 years according to audience measurement data from Kantar IBOPE Media, a media research enterprise in Latin America( Reference Kantar 38 ). INFORMAS protocol uses a stratified sampling design approach, with weekdays and weekend days comprising the two strata. Furthermore, it is advised that four weekdays and four weekend days be selected from within a 3-month period( Reference Kelly 37 ). Therefore, TV data were recorded on four random weekdays (Monday, Tuesday, Thursday, Friday) and four random weekend days (two Saturdays and two Sundays), for a total of eight days of recording for each channel, in a schedule between 06.00 and 00.00 hours, and we aimed to record simultaneously on all four channels. Due to technical difficulties with equipment, recordings failed on three specific days: a Monday for Disney Channel, a Tuesday for Repretel Channel 6 and Disney Channel, and a Saturday for Teletica Channel 7. For these three instances, the next available day of its type was recorded. For example, the recording that failed on Monday was substituted by the next available Monday and so on. Public holidays when ads might have been higher or lower were excluded; this included 15 September (Independence Day) and 12 October (Culture Day). We obtained a total sample of 576 h of TV broadcasting (18 h over 8 d = 144 h/channel), between the months of September and November 2016.
Nutrient profile assessment of food and beverage advertisements
Once TV programming records were available, we identified food and beverage advertisements (F&B ads) from all available broadcasted ads (n 8980). F&B ads (n 1862) included those promoting: (i) a specific food or beverage product; (ii) a supermarket or convenience store; or (iii) a restaurant (see online supplementary material, Supplemental Fig. S1). The product being promoted in each ad was then uniquely coded. When a supermarket or restaurant ad displayed a specific food or beverage product, this product was also identified. If two or more products were shown in the same ad, the one with the greater presence (according to the criteria of the coder) was selected. If all products were equally present in the ad, then the first product displayed was selected. We excluded ads from the nutrient profile assessment if the main food or beverage being promoted was not included in the nutrient profile model used (n 240) or if the ad was for a supermarket (n 130) or a restaurant (n 19) without a specific food or beverage product being advertised, which resulted in 1473 F&B ads for analyses.
To classify ads into permitted and non-permitted to be marketed to children, we used the WHO Regional Office for Europe (WHO-EU) nutrient profile model( 39 ). To apply this model, foods are first classified into one of seventeen food groups. Certain food groups cannot be marketed to children under any circumstances. These include chocolate and confectionery (group 1), cakes and sweet biscuits (group 2), juices (group 4a), energy drinks (group 4c) and edible ices (group 5). Conversely, fresh/frozen meat and fish (group 13) and fresh/frozen fruit and vegetables (group 15) can be marketed without restriction. For the remaining ten food groups, maximum nutrient-level cut-off points (energy, sodium, total fat, saturated fat, total sugar, added sugar and artificial sweeteners) are applied to determine the eligibility of foods to be marketed to children. These nutrient-level cut-off points are established per 100 g of product, and the cut-off points and nutrients limited differ depending on the type of product. For example, for breakfast cereals (group 6), a maximum of 15 g of total sugars is permitted; whereas for bread, bread products and crisp breads (group 11), the total sugars cut-off point is 10 g; and for cheese (group 8), there is no cut-off point for total sugars. Supplemental Table S1 (online supplementary material) describes the food groups established by this model, as well as the thresholds for nutrients involved. The INFORMAS protocol suggests the use of one of three systems: (i) the core/non-core food-based system, which is explained in their protocol( Reference Kelly 37 ); (ii) the WHO-EU nutrient profile model( 39 ); or (iii) the PAHO Nutrient Profiling System( 40 ). We considered the WHO-EU nutrient profile model to be more appropriate for the present study, given that it was specifically developed for marketing restriction purposes and slightly less restrictive than the PAHO model, which would make future policy recommendations more achievable.
In brief, the assessment of each F&B ad (n 1473) involved first uniquely coding the products that were advertised in the ad. When all promoted products were uniquely coded (167 products), their nutrition composition was obtained through different means depending on whether the product was sold in Costa Rica. For products sold in Costa Rica (135 products), nutrition composition was mostly assessed by taking a picture of the nutrition facts panel label during a visit to a food outlet (ninety-nine products). However, for foods that do not tend to have a nutrition facts panel label (i.e. fruits, vegetables and meats), the Food Composition Table of Central America( Reference Menchú and Méndez 41 ) was used to assess their composition (thirty-six products). For products not sold in Costa Rica (thirty-two products), the nutrition facts panel was obtained from the company’s official website page for the product. The following step was determining to which food group the product being advertised belonged (out of the seventeen groups of the model) and applying the thresholds per 100 g of product once information was retrieved from the nutrition facts panel. Note that ads promoting products in categories that were non-permitted under any circumstance (groups 1, 2, 4a, 4c and 5), or conversely marketed without any restriction (groups 13 and 15), were also classified, but the process did not involve assessment of nutrient thresholds.
Persuasive marketing techniques
Persuasive marketing techniques( Reference Jenkin, Madhvani and Signal 42 ) that are commonly used to promote the consumption of foods and beverages to children on TV were assessed throughout all F&B ads. The presence or absence of twenty-eight marketing techniques in each ad was assessed, which were then collapsed into four more general categories for analyses: (i) promotional characters; (ii) premium offers; (iii) brand benefit claims; and (iv) brand health claims. One ad could contain more than one technique, and a general category was identified as present if one or more of the specific techniques within it was present. Supplemental Table S2 (online supplementary material) provides details of the twenty-eight techniques classified into the four categories. Note that these are the same categories used in the INFORMAS protocol data collection tool( Reference Kelly 37 ).
Two research assistants were trained by the first author (I.Z.-C.) on ad classification and marketing technique assessment. During training, examples of each technique were discussed and written materials were provided. After training, each of the two research assistants received an hour of TV programming (separate from study sample) to be watched and consequently coded. Their codes for the twenty-eight variables for marketing techniques were compared against reference coding provided by the investigator. Inter-rater reliability was tested via Cohen’s κ statistic, with reference coding serving as a gold standard with which each coder was compared. This process was repeated twice; coders achieved satisfactory inter-rater reliability across the twenty-eight techniques after a second round of assessments (Cohen’s κ = 0·8–1·0). Retraining was provided after the first round due to minor discrepancies on the type of marketing technique being utilized. Once training was completed, each research assistant was assigned a channel for which to code all ads (Repretel Channel 6 and Disney Channel); I.Z.-C. assessed and coded ads for the remaining two channels (Teletica Channel 7 and Cartoon Network).
Data analysis
Data entry for all 1862 F&B ads was completed with REDCap software( Reference University 43 ) using the double data entry feature to minimize manual data entry mistakes. Analyses were completed using the statistical software package Stata version 13.0 (2017).
We compared the mean F&B ads/h v. non-F&B ads/h for each channel, across types of day (weekend day v. weekday) using the Mann–Whitney two-sample statistic (Wilcoxon rank-sum test) at a 95 % CI. Weekday and weekend day estimates were derived separately. We also compared the frequency of F&B ads by food category and the overall frequency of permitted v. non-permitted ads according to the WHO-EU nutrient profile model( 39 ). To dichotomize ads as permitted or non-permitted, the nutrient content of each food and/or beverage product advertised, per 100 g, was compared against the corresponding thresholds of nutrients associated with the food group (Supplemental Table S1). For example, if the product being advertised was a breakfast cereal, the content of total fat, total sugars and total salt were compared with the thresholds of the nutrient profile model; if the product exceeded at least one of these, the ad was considered non-permitted.
A χ 2 test was used to evaluate whether the proportion of permitted v. non-permitted ads differed according to peak and non-peak child viewing times. Children’s peak viewing times were defined as the top four hours where a larger proportion of children were watching TV (all national channels combined) according to Kantar IBOPE Media( Reference Kantar 38 ) audience measurement data for a child aged 4–11 years. These times were 18.00–22.00 hours on weekdays and 19.00–23.00 hours on weekends. It is important to note that this analysis was done only for national broadcast channels, as data on viewing times were unavailable for cable channels.
Finally, we determined the presence of the twenty-eight marketing techniques in all 1862 F&B ads, stratified by channel type (cable v. national broadcast). Then, these twenty-eight techniques were collapsed into four categories, and for each of the four persuasive marketing technique categories, a χ 2 test was used to determine if the prevalence of use of the technique was different when comparing permitted v. non-permitted ads (n 1473). For this analysis, a marketing technique category was considered present in the ad if at least one of the techniques comprising it was used.
Results
Food and beverage advertising
A total of 8980 ads were identified throughout 576 h of TV programming, of which 1862 (20·7 %) were F&B ads (Table 1). F&B ads were defined as those with foods or beverages alone (n 1463), supermarkets or convenience stores (n 194), and restaurants (n 205). On average, both national broadcast channels had more F&B ads during weekdays with 3·9 (sd 0·4) F&B ads/h, in comparison to 1·7 (sd 0·3) ads/h on weekends (P < 0·05); while both cable channels presented more ads on weekend days, averaging 3·2 (sd 0·3) F&B ads/h during the week and 4·1 (sd 0·6) ads/h on weekends (however, this difference was not statistically significant).
Table 1 Ads on Costa Rican TV to which children aged 4–11 years are likely exposed, according to type and channel (n 8980)*

Ads, advertisements; TV, television; F&B ads, food and beverage advertisements.
* TV programming was recorded for four weekdays and four weekend days, between 06.00 and 00.00 hours (576 total hours), for four channels (two national and two cable), in San José, Costa Rica, between September and November 2016.
† Comparing weekend day with weekday, Mann–Whitney two-sample statistic.
Nutrient profile of foods and beverages advertised
From the 1862 F&B ads identified, 1473 (79·1 %) were classified according to the WHO-EU nutrient profile model( 39 ). The remaining ads corresponded to foods or beverages that are not included in the WHO-EU nutrient profile model such as alcohol, coffee or tea (n 240, 12·9 %); or supermarket or restaurant ads not depicting any specific food or beverage product (n 149, 8·0 %). Due to an excessive content of total fats, saturated fats, total sugars, artificial sweeteners, salt and/or energy, 91·1 % of F&B ads analysed were considered non-permitted (Table 2) according to the WHO-EU nutrient profile model.
Table 2 Key characteristics of F&B ads on Costa Rican TV to which children aged 4–11 years are likely exposed, by type of day, channel, viewing hour and WHO-EU marketing classification*

F&B ads, food and beverage advertisements; TV, television; WHO-EU, WHO Regional Office for Europe; ads, advertisements.
* TV programming was recorded for four weekdays and four weekend days, between 06.00 and 00.00 hours (576 total hours), for four channels (two national and two cable), in San José, Costa Rica, between September and November 2016.
† The following ads were excluded: ads with foods and beverages not included in WHO-EU nutrient profile model (n 240), supermarket ads without a specific food/beverage product (n 130) and restaurant ads without specific food/beverage product (n 19).
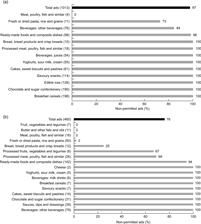
The food categories most frequently advertised were ready-made and convenience foods and composite dishes (e.g. pizza, hamburgers, pasta with sauce; 16·3 %), chocolates, confectionery and desserts (15·0 %), breakfast cereals (13·8 %), beverages (14·6 %), edible ices (8·6 %) and salty snacks (8·2 %). As displayed in Fig. 1(a) and (b), 97·3 and 76·1 % of F&B ads in cable and national channels, respectively, were classified as non-permitted.

Fig. 1 Percentage of F&B ads on Costa Rican TV to which children aged 4–11 years are likely exposed and for which marketing is non-permitted according to WHO-EU marketing classification: (a) cable channels and (b) national broadcast channels. Values in parentheses indicate the numbers of ads analysed; values on the right indicate the percentages of ads that were considered non-permitted. TV programming was recorded for four weekdays and four weekend days, between 06.00 and 00.00 hours (576 total hours), for four channels (two national and two cable), in San José, Costa Rica, between September and November 2016 (F&B ads, food and beverage advertisements; TV, television; WHO-EU, WHO Regional Office for Europe; ads, advertisements)
As shown in Fig. 2(a) and (b) for weekdays and weekend days, respectively, the hourly frequency of F&B ads considered non-permitted was higher than those considered permitted at any given time in national channels. Similar results were observed for cable channels (data not shown) in which, at any given time, the frequency of non-permitted ads was higher than the frequency of permitted ads.

Fig. 2 Comparison of average hourly number of F&B ads on Costa Rican TV national broadcast channels to which children aged 4–11 years are likely exposed, according to WHO-EU marketing classification (![]() , permitted;
, permitted; ![]() , non-permitted), on: (a) weekdays and (b) weekend days.
, non-permitted), on: (a) weekdays and (b) weekend days. ![]() indicates the estimated child audience (4–11 years). TV programming was recorded for four weekdays and four weekend days, between 06.00 and 00.00 hours (576 total hours), for four channels (two national and two cable), in San José, Costa Rica, between September and November 2016 (F&B ads, food and beverage advertisements; TV, television; WHO-EU, WHO Regional Office for Europe)
indicates the estimated child audience (4–11 years). TV programming was recorded for four weekdays and four weekend days, between 06.00 and 00.00 hours (576 total hours), for four channels (two national and two cable), in San José, Costa Rica, between September and November 2016 (F&B ads, food and beverage advertisements; TV, television; WHO-EU, WHO Regional Office for Europe)
Persuasive marketing techniques of food and beverage advertisements
As displayed in Table 3, almost all (98·2 %) F&B ads analysed (n 1862) used a brand benefit claim when promoting the product. The use of promotional characters, which included cartoons, amateur sportspersons and ‘for kids’ images (e.g. a child, a lunchbox, a toy image), was also prevalent, particularly among cable channels (95·1 %).
Table 3 Proportion of F&B ads on Costa Rican TV to which children aged 4–11 years are likely exposed, according to marketing technique used and by type of channel* , †
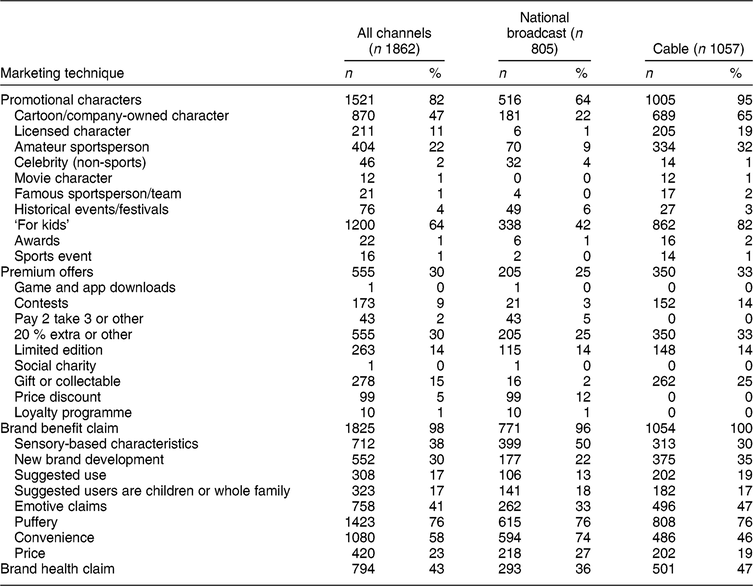
F&B ads, food and beverage advertisements.
* TV programming was recorded for four weekdays and four weekend days, between 06.00 and 00.00 hours (576 total hours), for four channels (two national and two cable), in San José, Costa Rica, between September and November 2016.
† Advertisements could contain one or more marketing technique.
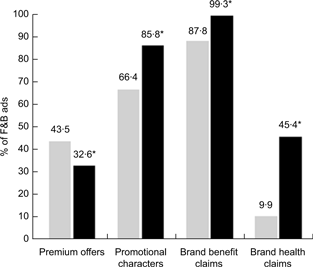
Figure 3 shows that F&B ads considered non-permitted were significantly more likely to include a brand benefit claim, promotional characters or a brand health claim in their marketing, whereas permitted products were more likely to include a premium offer (P < 0·05). Specifically, promotional characters, brand benefit claims and brand health claims were present in 86, 99 and 45 % of non-permitted ads (v. 66, 88 and 10 % of permitted ads). Premium offers were present in 33 % of non-permitted ads and 43 % of permitted ads.

Fig. 3 Proportion of F&B ads (n 1473) on Costa Rican TV to which children aged 4–11 years are likely exposed and that displayed each type of persuasive marketing technique, according to WHO-EU marketing classification (![]() , permitted;
, permitted; ![]() , non-permitted). One ad could have more than one technique present; *P < 0·05 (χ
2 test for differences between permitted and non-permitted within each marketing technique). TV programming was recorded for four weekdays and four weekend days, between 06.00 and 00.00 hours (576 total hours), for four channels (two national and two cable), in San José, Costa Rica, between September and November 2016 (F&B ads, food and beverage advertisements; TV, television; WHO-EU, WHO Regional Office for Europe; ad, advertisement)
, non-permitted). One ad could have more than one technique present; *P < 0·05 (χ
2 test for differences between permitted and non-permitted within each marketing technique). TV programming was recorded for four weekdays and four weekend days, between 06.00 and 00.00 hours (576 total hours), for four channels (two national and two cable), in San José, Costa Rica, between September and November 2016 (F&B ads, food and beverage advertisements; TV, television; WHO-EU, WHO Regional Office for Europe; ad, advertisement)
Discussion
Two main findings resulted from the present work: (i) advertising of unhealthy foods and beverages is high on TV channels most viewed by children; and (ii) a high proportion of F&B ads use persuasive marketing techniques targeted to children. Hence, we can assume that children are highly exposed unhealthy F&B ads. For example, if children in Costa Rica watch TV for 2 h/d, they would be exposed to thirty-four to ninety-two unhealthy F&B ads/week. Over 90 % of the foods and beverages that were advertised did not comply with the nutritional quality standards of the WHO-EU nutrient profile model, and therefore should not be advertised. The present study is the first to our knowledge to examine the frequency and nutritional quality of foods and beverages advertised in Costa Rica, as well as the persuasive marketing techniques used to promote them.
Our results are similar to what previous research has found in other settings, in which the nutritional content of products advertised on TV is frequently high in total fat, saturated fat, sugars and sodium( Reference Allemandi, Castronuovo and Tiscornia 26 , Reference Kelly, Halford and Boyland 27 , Reference Cosenza, Morales-Juárez and Kroker-Lobos 29 – Reference Kelly, Hebden and King 36 ). Contrary to this, food categories with a healthier nutrient content, such as fresh fruits and vegetables, meats, poultry and fish, and similar, often represent less than 5 % of all ads. A high proportion of the F&B ads in our study had persuasive marketing techniques targeted to children. It has been well documented that the advertising of foods and beverages is usually accompanied by powerful marketing strategies, mainly in foods of low nutritional quality( Reference Jenkin, Madhvani and Signal 42 ). Most of these techniques are misleading, as they attribute properties to the advertised foods that they likely do not have, and children, who lack the cognitive development to differentiate the persuasive intention behind the ad, are at a disadvantage when establishing their preferences( Reference Folta, Goldberg and Economos 44 , Reference Carruth, Skinner and Moran 45 ). There is evidence showing that children are particularly vulnerable to the effects of acute exposure to food advertising, which supports policy action to reduce children’s exposure to unhealthy food advertising( Reference Boyland, Nolan and Kelly 46 ).
The relevance of our results goes beyond the context of Costa Rica. By including two channels that were family oriented, we were able to assess food and beverage marketing not only in child-directed programmes, but also in family programmes that might also be observed by children. Furthermore, by recording from 06.00 to 00.00 hours, it was possible to assess F&B ads at different moments of the day, and not only during children’s peak viewing times.
The percentage of Costa Rican children who are overweight or obese nearly doubled between 2009 and 2016, from 21 to 34 %( 4 , 5 ), which should motivate towards implementing public health actions accordingly. The aetiology of obesity in children is complex and multifactorial( Reference Kumar and Kelly 2 ), and therefore initiatives should address not only the individual, but also the community and the broader environment in which the child develops. Restricting food advertising is a key factor in the overweight and obesity prevention framework( Reference Hawkes, Jewell and Allen 47 ), especially when there is evidence showing the impact of advertisement restrictions on the nutritional status of children. In the USA, reducing exposure to food advertising on TV was associated with a 12 % decrease in total unhealthy food consumption, a 5·6 % reduction in weight, and a 6·8 and 6·0 % decrease in the prevalence of obesity in boys and girls, respectively( Reference Veerman, Van Beeck and Barendregt 48 ). Another study estimated that restricting fast-food restaurant TV advertising would reduce overweight by 18 % in children aged 3–11 years in the USA( Reference Chou, Rashad and Grossman 49 ).
In Costa Rica, ‘commercial propaganda’ promoting the consumption of any type of food and beverage is prohibited in public schools, via decree Nº 36910( 50 ). Additionally, regulation Nº 36868-S includes a chapter on food advertising, but it is unclear in its scope and reach, stating that food advertising should not mislead the Ministry of Health’s dispositions in health, nutrition and hygiene education( Reference de Salud 51 ). However, Costa Rica currently lacks any type of regulation for TV advertising of foods and beverages directed at children. Such regulation could focus on the type of programmes in which ads are broadcast (such as programmes dedicated to children), the type of product (restriction of all F&B ads or only those that exceed certain nutrients) or the content of the ads( Reference Kelly, Smith and King 34 ).
Other Latin American countries have already approved food marketing restrictions. For example, the Chilean Food and Marketing Law 20606 established that foods high in total energy, saturated fats, sugars or sodium should not be advertised to children under the age of 14 years. This law defined advertising as any form of promotion, communication, recommendation, propaganda or information with the intention to increase the consumption of such products( Reference de Salud and de Chile 52 ). For advertising on TV and movie theatres specifically, Law 20869 states that it is prohibited any time between 06.00 and 22.00 hours( Reference de Salud and de Chile 53 ). Mexico also implemented a set of regulations in 2014 to restrict unhealthy food and beverage marketing to children on TV and in movie theatres( 54 ). A set of thresholds are set for energy, sodium, saturated fats and sugar on twelve different food and beverage categories, which are not permitted to be advertised. These products, however, can be promoted during specific schedules (Monday–Friday: from 00.00 to 14.30 hours, and from 19.30 to 23.59 hours; Saturday and Sunday: from 00.00 to 07.00 hours, and from 19.30 to 23.59 hours).
Considering our results, we propose that the most effective policy option would be restricting F&B ads on TV for most of the day (e.g. between 06.00 and 22.00 hours) and on all channels, but applicable only to F&B ads that surpass established nutrient limits within a nutrient profile model. Careful consideration should be given to which nutrient profile model would be best to use. Different models have been developed, including the one by PAHO( 40 ) and the one proposed by WHO-EU( 39 ). The model developed by PAHO was designed for multiple applications, including regulation of marketing, front-of-package labelling, and fiscal policies related to foods and beverages( 40 ); whereas the model proposed by WHO-EU( 39 ) was designed specifically for the purpose of restricting marketing to children. In either case, these profiles are tools that can help determine nutrient cut-off points for which a regulatory policy would apply. PAHO’s model is attractive due to the simplicity of its approach. Foods are first classified into one of the four NOVA food groups, a classification system that was developed by the University of São Paulo, based on the extent of processing a food has undergone( Reference Monteiro, Cannon and Moubarac 55 ): (i) natural product; (ii) culinary ingredient; (iii) processed food; or (iv) ultra-processed food. If part of the latter two groups, then the content of sodium, free sugars, total fat, saturated fat, trans fat and other sweeteners is compared against a cut-off point, regardless of the type of food or beverage. WHO-EU’s profile, on the other hand, classifies foods and beverages into seventeen food groups, and the cut-off points differ depending on the food group classification. We considered the WHO-EU nutrient profile model to be more appropriate for the present study, given that it was specifically developed for marketing restriction purposes and that it is also slightly less restrictive than the PAHO model.
Ideally, such regulation should be mandatory at the national level, for both national broadcast and cable channels. It is increasingly recognized that voluntary regulations may not be sufficient, and that more transparent and applicable regulation may be required to reduce the omnipresence of unhealthy foods and beverages( Reference Powell, Harris and Fox 56 , Reference Théodore, Tolentino-Mayo and Hernández-Zenil 57 ). The Ministry of Health of Costa Rica could lead the design of this policy, with input from key stakeholders such as academia and civil society. The policy could be framed within the National Strategy for Non-Communicable Diseases and Obesity 2013–2021( Reference de Salud 58 ), that already includes a goal related to the creation of such regulation.
The present study does not go without limitations. First, we were unable to gain access to child audience data per hour for cable channels (i.e. specific times of day when children view more often); hence, the analysis that included the audience variable was limited to national channels. However, it is worth mentioning that national broadcast channels are viewable by the majority of the population, while only 56 % of households have a cable subscription( Reference de Telecomunicaciones 59 ). This suggests that the audience data on cable TV channels might not have been representative of all children in Costa Rica. Second, the original sample design was a random selection of days; however, due to technical and logistical complications, it was impossible to complete the recordings in such way (with recordings failing on three of the eight randomly selected days). Due to lack of regulation in Costa Rica for any given day of the week and the overwhelmingly large proportion of non-permitted F&B ads, we do not anticipate that our results would have been different if we had a true random sample of days. Third, the assessment of the persuasive marketing techniques was likely influenced by subjectivity of the raters and it is hard to ensure that all raters agree on the same type of technique used by an ad. The INFORMAS protocol suggests the recoding of a proportion of the recorded TV hours by a different coder, to then calculate reliability. However, due to lack of resources, this was done only post-training with a small selection of recordings (1 h, approximately ten F&B ads) and this selection was not part of our actual sample. We tried to minimize the effect of subjectivity by training and retraining of research assistants involved in the assessment. Additionally, the instrument used for our study had previously been used in Guatemala, a country in which inter-rater reliability was also verified using the same procedure as ours( Reference Cosenza, Morales-Juárez and Kroker-Lobos 29 ). Lastly, our study included only TV advertisements, leaving out exposures such as Internet advertising through social media or games. However, 80 % of the Costa Rican population above 5 years of age reports watching TV daily, indicating that this is a common activity( 60 ).
Conclusion
Children living in Costa Rica are exposed to an overabundance of TV marketing of unhealthy foods and beverages daily and there appeared to be a tendency of over-advertising during children’s peak viewing hours. Due to the link between food marketing, preferences and consumption, our findings help justify the need for regulatory actions by national authorities. As a guideline to design and implement such regulation, a nutrition profile system, such as that of WHO-EU which has previously been used in other contexts, could be useful for establishing criteria. Finally, regulatory strategies must be supported by other public health actions to promote healthy eating environments, as TV contributes to children’s exposure to food and beverage advertising but is just one of many factors involved in the current childhood obesity epidemic.
Acknowledgements
Acknowledgements: The authors are thankful for the financial support provided by the International Development Research Centre (IDRC). They also thank Diana Guzmán and Fiorella Piedra, who collaborated with coding of ads; and Dina Roche for assistance with data management. Finally, the authors thank the Institute of Nutrition of Central America and Panama and the School of Public Health at the University of Costa Rica for general support. Financial support: This study was supported by a research training grant from the IDRC-CRDI (number #107213002). The IDRC had no role in the design, analysis or writing of this article. Conflict of interest: None of the authors has any conflict of interest with respect to this manuscript. S.V. is a Deputy Editor for Public Health Nutrition. Authorship: All authors participated in study design; I.Z.-C. acquired, analysed and interpreted the data; I.Z.-C. and M.L.J. drafted the manuscript; M.L.J., S.V., M.R.-Z. and M.F.K.-L. assisted in the analysis and interpretation of the results and provided critical intellectual feedback to help revise the manuscript. All authors read and approved the final manuscript. Ethics of human participation: No human subjects were involved in this study.
Author ORCID
Melissa L Jensen 0000-0002-9830-076X; María F Kroker-Lobos 0000-0001-8631-3101
Supplementary material
To view supplementary material for this article, please visit https://doi.org/10.1017/S1368980019000776