


Ireland has an unacceptably high prevalence of childhood obesity, with an estimate that 25 % of 9-year-olds live with overweight/obesity(1). Though there are some indications that the prevalence may be stabilising(2), it remains at a level that imparts significant health-related risk.
The current epidemic of overweight and obesity represents a public health crisis with the potential to reverse recent favourable trends in life expectancy(2,3) and undermine the financial viability of health systems worldwide. While effective government policies and actions are essential to increase the healthiness of food environments, monitoring the degree of implementation of the policies and actions and impact of these policies is essential to ensuring progress towards better nutritional health. One policy measure introduced by the Irish government was a tax on sugar-sweetened beverages (SSB) from 1 May 2018. Though evidence from other sectors, including alcohol and tobacco, supports the use of fiscal measures as legitimate strategies in the public health toolkit, the support for and effectiveness of this tax is controversial and is a subject of debate both nationally and internationally(Reference Godlee4–Reference Sassi6). Several countries have chosen to use taxes on foods and non-alcoholic beverages in an attempt to improve the quality of people’s diets(7,Reference Redondo, Hernández-Aguado and Lumbreras8) and reduce the prevalence of obesity. Some recent evidence from a number of countries indicates positive population health and economic benefits of such a tax(Reference Sarlio-Lähteenkorva and Winkler5,Reference Briggs, Mytton and Kehlbacher9–Reference Gulland11) .
Essential to measuring the impact of this fiscal measure is a baseline from which to benchmark. The aim of the current article is to provide evidence of consumption levels of SSB in Ireland prior to the introduction of a tax; to identify the energy contribution of SSB to overall energy intake; and to explore the association between SSB consumption and weight in a cross-sectional sample of children living in Cork, Ireland. This will provide baseline data from which the tax impact on SSB consumption can be assessed in the short and long terms.
Methods
Study design and sample
Details of the Cork Children’s Lifestyle Study (CCLaS) are described elsewhere(Reference Keane, Kearney and Perry12). In summary, the study recruited children in third and fourth classes (years 5 and 6 of enrolment to primary school) between April 2012 and June 2013. Schools from the urban area were recruited using probability proportionate-to-size and purposive sampling. All schools in the rural area were invited to participate. At the school level, twenty-seven out of forty-six schools participated (response rate 58·6 %), and 1075 out of 1641 children participated (response rate 65·5 %) in the study. The present study only includes children with completed food diaries and who had a plausible energy intake (n 724).
Dietary assessment
Participating children completed a consecutive 3-d food diary developed for the purposes of this study(Reference Keane, Kearney and Perry12). Diaries were completed over weekdays (Monday–Friday) and weekend days (Saturday and Sunday). Overall, 45 % (n 327) of children with plausible energy intake had at least one weekend data collection day. All data reported here refer to a daily average of 3-d consumption. Each food item the child reported in their food diary was entered into the nutritional analyses software, NetWISP version 4 (Tinuviel software). All diaries were completed and data entered according to a specifically developed standard operating procedure (SOP). Ten per cent of diaries were double-entered, and all data cleaning was conducted according to a study-specific SOP.
Assessment of sugar-sweetened beverage intake
SSB intake was assessed from food diaries. The type and quantity of SSB was reported by the child. The nutritional software’s output provided information for quantity (ml), kilojoules and sugars per day from each food/drink type. SSB consumers were identified using NetWISP’s food item categorisation. The McCance and Widdowson 7th edition(13) and the Irish Food Composition nutrient databases(Reference Black, Ireland and Møller14) were used for analysis in NetWISP. Diet carbonated soft drinks were disaggregated from the beverage category and excluded from this SSB category. The beverages that contributed to overall SSB are carbonated soft drinks, juices or cordials and energy drinks. Each beverage category was checked to verify that the drink items contained within it had added sugar. All beverages included contained 5 g sugar/100 ml. The volume (ml) of each beverage category was summed to generate an overall SSB amount, and this was then divided by the number of food diary days the child actually completed. SSB consumption was analysed as a continuous variable (ml/d), and for multivariate regression analyses, it was collapsed into a categorical variable: ‘non consumers’, those who had no reported SSB consumption over the food diary days; ‘low consumers’, less than one standard household glass (200 ml/d); and ‘high consumers’, those with reported consumption >200 ml/d. The Irish Healthy Eating Guidelines suggest a serving size of 200 ml cup to measure portion sizes. Furthermore, the Irish guidelines suggest that 200 ml is an identifiable portion size for the general population, which is useful for public health messages(15).
In this sample, the average amount of sugar (g) that a 200-ml cup of SSB provides is 10·3 g. For ease of interpretation, 200 ml was chosen rather than an uneven number. The WHO recommends an intake of free sugars of <10 % of total energy intake(16). The Irish energy recommendation for 5–12-year-old children is 5858–9205 kJ/d(15).
Energy misreporting
An energy intake to BMR ratio was calculated for each child to identify under- or plausible reporters. BMR was estimated using the method outlined by Schofield et al.(Reference Schofield, Schofield and James17). Cut-off values for energy intake to BMR were defined by an equation developed by Goldberg et al.(Reference Goldberg, Black and Jegg18), with updated cut-off points for children, defined by Black et al.(Reference Black, Prentice and Goldberg19). Implausible reporters, based on Black’s equation, were excluded from the analysis (n 348). Data presented are separated for the full study sample, plausible and under-reporters (Table 1), while subsequent tables are for plausible energy reporters only.
Table 1 Sociodemographic and lifestyle characteristic of the Cork Children’s Lifestyle Study population by energy reporting†

SSB, sugar sweetened beverage.
* Excludes n 7; no BMI data.
** Excludes n 15; no food diary data.
† P-value is the association between factors and energy reporting.
‡ Total study population is 1075, however data presented in this table relate only for children with measured BMI data. Children missing data were excluded from this table (n 7). Data presented for participants with valid objectively measured accelerometry data only.
Anthropometric measurements and obesity definition
Children’s height and weight were measured by trained researchers using standardised methods(Reference Keane, Kearney and Perry12). Age- and sex-specific International Obesity Taskforce (IOTF) definitions were used to categorise children as normal weight or overweight/obese(Reference Cole, Bellizzi and Flegal20,Reference Cole and Lobstein21) . Data for children’s measured BMI were available for 99·3 % (n 1068) of the sample.
Covariates
Additional socioeconomic and lifestyle behaviours were provided by participants in self-reported questionnaires and objective measures of physical activity. Self-reported child questionnaires were completed in school during class time, with researchers providing assistance where necessary. Parent-reported questionnaires were completed in the home and returned by the children.
Demographics
Sex (girl or boy) was recorded by trained researchers during physical measurements. Child’s age was calculated using the date of physical measurement and date of birth (parent-reported). Parent-reported highest level of maternal education was used as a proxy measure of socioeconomic status. The variable was coded as primary/lower secondary education, higher secondary education, post-secondary education, tertiary education. Ethnic background was reported in the parental questionnaire. This was coded as a binary variable as Irish or non-Irish. Family type was recorded by the parental questionnaire and coded as single-parent or two-parent.
Parent-reported family takeaway consumption
The frequency of takeaway consumption was assessed from the parent-reported questionnaire. Parents were asked to report how often they ordered family takeaways. This was coded as a categorical variable: ‘≤once a week’ and ‘>once a week’.
Parent-reported child TV-viewing habits
Child TV-viewing habits were assessed from the parent-reported and child-reported questionnaires.
Parents reported how much time the child spends watching TV on a ‘normal weekday during term time’. This was coded as a categorical variable: ‘<1 h/d’, ‘1–3 h/d’ and ‘≥3 h/d’. Children reported how much time they watch TV each day. This was coded as: ‘<1 h/d’, ‘1–3 h/d’ and ‘≥3 h/d’.
Physical activity
Details of the objectively measured physical activity levels have been previously recorded(Reference Keane, Li and Kearney22,Reference Li, Kearney and Keane23) . In summary, free-living physical activity was measured over 7 consecutive days using a wrist-worn validated tri-axial Geneactiv accelerometer(Reference Esliger, Rowlands and Hurst24,Reference Phillips, Parfitt and Rowlands25) . The accelerometers were set to record at 100 Hz for 7 d using the ‘on button press’ setting of Geneactiv software, version 2.2. The accelerometers were placed on the non-dominant hand of each participating child. Children were asked to wear the accelerometers 24 h a day, each day.
Parent-reported questionnaire data were used to identify the most frequent waking time and bedtime on week days and weekend days. These data were then used to estimate the number of waking hours each day. The mean waking time was 14 h/d. To be included in the current analysis, children needed to have recorded ≥600 min of waking time data each day. For children included in the analysis who had missing wear time information, the data were scaled to full waking time. Non-wear time was determined using an algorithm by van Hees et al.(Reference van Hees, Renström and Wright26). Children who engaged in ≥60 min of moderate to vigorous physical activity (MVPA) on each of the 7 d were categorised as meeting WHO MVPA recommendations(27).
Ethical considerations
All study procedures were approved by the local research ethics committee. Only children who provided assent and whose parents/guardians provided written informed consent participated in the study. Feedback on the physical measurements was provided to all parents of participating children in the form of a letter.
Data analysis
Statistical analyses were completed using STATA/IC 13.1 Descriptive results are presented as mean (sd) or median (IQR) for continuous data, and frequency (percentage) for categorical data. t-Tests and ANOVA were used to compare mean differences in continuous variables, while χ 2 tests were used to determine differences in categorical data.
Multivariate analyses
Unadjusted estimates of the association between SSB consumption and child weight status were performed using a binary logistic regression. Partially adjusted estimates were obtained by adjusting for sociodemographic variables and lifestyle behaviours separately in a binary logistic regression model. Covariates that were statistically significant in the partially adjusted logistic regression analyses were retained for the multivariate fully adjusted logistic analyses to assess the association between SSB consumption and child overweight/obesity for low consumers (reference group), non-consumers and high consumers.
Using BMI as a continuous variable, the distribution of BMI across SSB consumption quintiles was assessed using fully adjusted kernel density estimates at the upper cut-points of SSB consumption quintiles.
Results
Descriptive details of the CCLaS study population have been previously reported(Reference Keane, Kearney and Perry12). Table 1 shows the descriptive characteristics of all participants, participants with plausible energy intake and those classified as under-reporters with measured height, weight and BMI data (n 1068).
Overview of participants in this study
According to IOTF obesity classification, a quarter of children had overweight/obesity (25 %, n 271). The majority of participating parents were female (58 %, n 620), Irish (87 %, n 828) and from two-parent families (75 %, n 803). Over 40 % of the children’s parents (n 401) had a tertiary qualification. Sixty per cent of parents (n 614) reported that their children watched between 1–3 h of TV per day, while 38 % (n 401) of children self-reported watching 1–3 h TV per day. The majority of children (78 %, n 643) did not meet the daily recommendation for MVPA, while 15 % (n 152) of parents reported consuming a takeaway more than once a week (Table 1). Almost half of children (46 %, n 489) were classified as high consumers of SSB (>200 ml/d). Significant differences were seen in energy reporting (plausible v. under-reporting) for SSB consumption status (P < 0·0001), weight category (P < 0·0001), meeting MVPA targets (P = 0·009) and ethnicity (P = 0·009) (Table 1).
Child weight status
Child’s physical activity, parent-reported child TV viewing and level of SSB consumption were significantly associated with child weight status (Table 2). Significantly more children with overweight/obesity, compared to children with normal weight, watched TV >3 h daily (26 v. 17 % daily), did not meet MVPA targets (86 v. 74 %) and consumed ≥200 ml SSB (76 v. 63 %). The volume of consumption differed statistically significantly in overweight/obese children compared to normal-weight children (383 v. 315 ml, P = 0·0054) (Table 2).
Table 2 Descriptive characteristics and details of SSB consumption for plausible energy reporters by weight status and by SSB consumption status

MVPA, moderate to vigorous physical activity.
* Plausible energy reporters and SSB consumers only.
† SSB is defined as carbonated soft drinks (excluding diet drinks), cordials/squash/juices and energy/sports drinks. % denotes the percentage contribution of SSB to overall mean daily energy intake and mean daily sugar intake.
‡ P-value is the association between SSB consumer category and the factors; χ 2 test for categorical data and t test for continuous data.
§ Plausible energy reporters only.
‖ Low consumer <5 g sugars/100 ml SSB, high consumer ≥5 g sugars/100 ml SSB; non-consumers n 130 (18·2 %).
Child’s sugar-sweetened beverage consumption
The majority of participants (82 %) were consumers of SSB (Table 1). The average SSB consumption was 328 ml/d (a standard unit of SSB available for purchase is 330 ml). SSB contributed a mean of 6 % of total energy intake and 22 % of total sugar intake. No gender differences in SSB consumption were evident. However, consumption differed significantly by child’s weight status. Mean energy intake from SSB increased from 448 to 649 kJ for children who were normal weight compared with those with overweight/obesity, equating to 5·8 and 7·6 % of total energy intake, respectively. Mean intake volumes were significantly higher in children with overweight/obesity compared to normal-weight children. Average consumption was 315·5 and 383·1 ml/d for normal-weight children and children with overweight/obesity, respectively. Sugar intake from SSB and per cent contribution of sugars from SSB to total sugar intake was significantly higher in children with overweight/obesity compared to normal-weight children (Table 2).
Twenty-nine per cent of children (n 208) were ‘low SSB consumers’ (≤200 ml/d), 18 % (n 130) ‘non-consumers’ and 53 % (n 380) ‘high SSB consumers’ (>200 ml/d). Significantly more children with overweight/obesity compared to normal-weight children were high consumers of SSB (76 v. 63 %) (Table 2). Child’s SSB consumption status was significantly associated with parent-reported child TV viewing (P = 0·005), meeting physical activity recommendation (P = 0·050) and eating takeaway meals on a weekly basis (P = 0·001). Children whose parents reported they watched >3 h TV per day were more likely to be high SSB consumers (n 73, 20 %) compared to low (n 32, 16 %) or non-consumers (n 15, 12 %). Of those reporting eating takeaway meals more than once per week, significantly more were high SSB consumers than low consumers (20 v. 6 %). Ethnicity and parental education are associated with SSB consumption (Table 2). A higher proportion of ‘Irish’ participants were classified as high SSB consumers, while a higher proportion of ‘other ethnic backgrounds’ were classified as non- or low consumers (Table 2). The highest proportion of non-consumers of SSB were among children of parents with higher levels of education (58 v. 5 % for tertiary education v. primary or secondary only) (Table 2).
Quantity of sugar-sweetened beverage consumption in plausible energy reporters
Compared to the total sample (detailed in Table 1), a higher proportion of plausible energy reporters were ‘high SSB consumers’ (Table 1) (53 v. 46 %). Across weight categories, a higher percentage of plausible reporters were normal weight compared to the total sample. Plausible reporters were less likely to have overweight/obesity (18 %) compared to under-reporters (40 %). A subsequent analysis focused only on plausible energy reporters.
Table 3 displays the contribution of each SSB type to the overall SSB intake in millilitres, kilojoules and sugars. It also shows the pattern of consumption over weekdays and weekends. The mean contribution of fizzy drinks to overall SSB kilojoules differed between weekdays and weekends. Weekend contribution was 50·9 %, while the mean contribution during weekdays was 30·6 %.
Table 3 Patterns of SSB consumption by SSB components by weekday and weekends*

* Weekdays, Monday–Friday; weekends, Saturday and Sunday. n is the number of children with food diary data from at least 1 weekday and the number of children with food diary data from at least 1 weekend day, and who were plausible energy reporters and SSB consumers.
Unadjusted and partially adjusted analysis
Crude unadjusted estimates of the association between SSB consumption and child’s weight status are presented in Table 4. High SSB consumers have an increased odds of being overweight/obese (OR 1·8, 95 % CI 1·1, 2·9) than low SSB consumers. This association remained stable in separate analyses after adjusting for individual characteristics (child’s age and gender), family characteristics (parental ethnicity, maternal education, marital status and family type) and child’s lifestyle behaviours (MVPA, takeaway consumption, TV viewing and average daily kJ intake) (Table 4).
Table 4 Unadjusted and partially adjusted logistic regression on the association between SSB consumption (ref: low consumers, <200 ml/d) and overweight/obesity
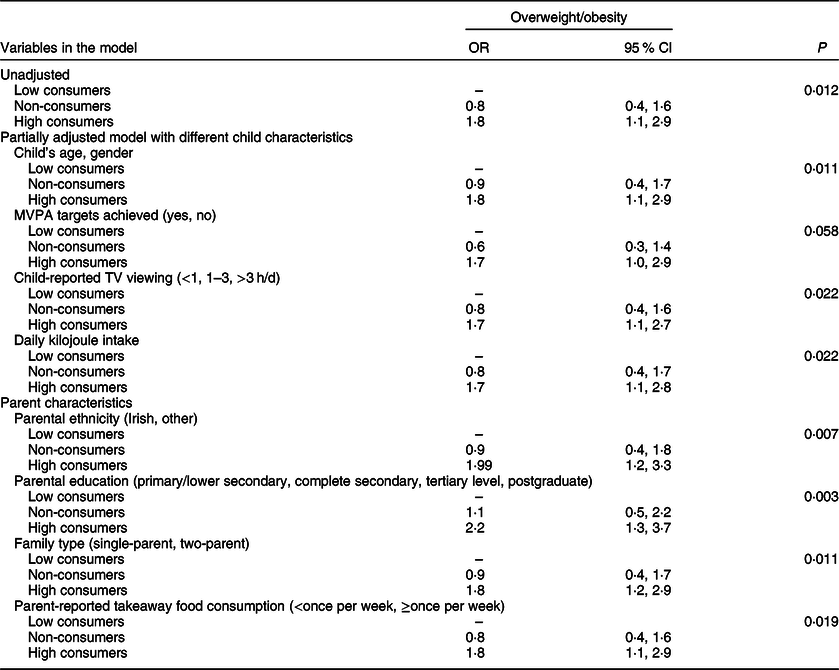
MVPA, moderate to vigorous physical activity.
Multivariate analysis
In multivariate logistic regression (Table 5), the associations observed in univariate analyses (Table 4) remained stable. In the fully adjusted model (model 5), high SSB consumers have 80 % increased odds of having overweight/obesity compared to low SSB consumers (OR 1·8, 95 % CI 1·0, 3·5).
Table 5 Multivariate logistic regression of the association between SSB consumption (ref: <1 standard unit (200 ml/d)) and overweight/obesity*

* Model 1: adjusted for child’s age and gender, parental education, family type and ethnicity. Model 2: model 1 + total daily MVPA. Model 3: model 2 + child-reported and parent-reported child TV viewing. Model 4: model 3 + parent-reported family takeaway consumption. Model 5: model 4 + average daily kJ intake.
In separate fully adjusted regression analyses (Fig. 1), clear BMI distribution differences are evident across SSB consumption quintiles: a one unit difference in BMI score exists between the highest and the lowest quintiles of SSB consumption.

Fig. 1. Kernel density distribution of BMI by quintiles of Sugar Sweetened Beverages consumption
Discussion
This study provides evidence of SSB consumption levels in a sample of Irish children living in Cork city and county prior to the introduction of a sugar drinks tax. The Sugar Sweetened Beverage Tax came into effect on 1 May 2018 and applies to water- and juice-based drinks that have added sugar and a total sugar content of ≥5 g per 100 ml. Drink categories that are liable for the tax are flavoured waters, carbonated drinks, energy/sports drinks and juice-based drinks. The drink types are detailed using the Combined Nomenclature (CN) of the European Union (CN codes 2009 and 2202). There are four key findings. Firstly, the majority of participants consumed SSB (82 %); secondly, participants consumed 328 ml SSB per day on average, which is equivalent to one standard commercial serving (330 ml); thirdly, SSB contributed to 6 and 8 % of energy (kJ) intake and 22 and 26 % of sugar intake for normal-weight children and children with overweight/obesity, respectively; finally, SSB consumption >200 ml is associated with increased BMI. Clear positive distribution differences in BMI are evident across SSB consumption groups.
Results in context
Evidence of an association between SSB consumption and increased weight is compelling(Reference Malik, Schulze and Hu28,Reference Vartanian, Schwartz and Brownell29) . Concurrent with increasing prevalence of global obesity, a surge in the availability of ultra-processed foods and beverages occurred(Reference Rodgers, Woodward and Swinburn30). Included in this group of obesogenic foods and beverages are soft drinks (SSB). Our results are consistent with other published studies reporting that SSB consumption, which imparts no nutritional benefit on the individual, contributes significantly to the overall daily energy intake. US data indicate that SSB consumption contributes >2092 kJ/d in 5 % of 2–11-year-olds(Reference Han and Powell31). NHANES results show that between 2011 and 2014, six in ten youths (63 %) drank an SSB on a given day; this compares to 82 % in the current study. Further, evidence suggests that a high intake of these beverages is not accompanied by a reduction in food intake(Reference Colchero, Popkin and Rivera10), and the lack of this compensation may contribute to the surplus daily energy consumed.
Strengths and limitations
This study is strengthened by the depth of data on lifestyle, diet and physical activity collected at an individual and family level, allowing for an in-depth exploration on the potential determinants of SSB consumption and its association with weight status. The study collected objectively measured height, weight and BMI data. Additionally, objectively measured physical activity data was collected under free-living conditions over a 7-d period. The thoroughly debriefed 3-d food diaries provided comprehensive data on dietary intake patterns and behaviours, including SSB consumption.
Limitations of the study include the cross-sectional design of the survey, the relatively modest response rate (67 %) and the issue of measurement error in relation to the exposure (diet quality) and the self-reported nature of confounding variables. The study was conducted in 2012, and so it may not be possible to indicate how consumption levels changed between 2012 and the introduction of the tax in 2018. The study recruited children from only one region of Ireland, and the sample is predominantly urban; so caution needs to be exercised in making inferences for the rest of the Irish population. Further, active parental permission might depress response rates, and non-responding children (and parents) are likely to have less favourable BMI profiles. It was outside of the scope of this study to follow-up non-responders, and thus we cannot definitively state that the BMI profile of participants was similar to that of non-responders. By definition, we have to be cautious in making causal links in cross-sectional analyses. However, the findings presented here are entirely consistent with available data from other studies. It should be noted that misclassification of exposures and outcomes due to random error would tend to underestimate the effect sizes, and it was highly likely that the magnitude of associations seen between SSB consumption and child’s weight has been underestimated.
Conclusion
We provide a baseline from which the impact of the sugar drinks tax on SSB consumption can be benchmarked. We provide evidence of a very high level of SSB consumption among a sample of school-going children in Cork, Ireland, accounting for a significant proportion of daily energy and sugar intake. We further provide strong evidence of its association with overweight/obesity and suggest that differences in child’s BMI are evident between high and low SSB consumers at a population level.
Population-based approaches to reduce SSB consumption, as part of a complex systems approach to tackling the problem of childhood obesity, are a public health necessity. While no single measure might reverse the current trends in obesity, a multi-component strategy, including a targeted approach towards improving the food environment, will be necessary.
Key points
SSB impart no nutritional value to the overall diet, and high consumption levels are attributed to excess weight in children.
To date, the magnitude of SSB consumption and its contribution to the overall daily energy and sugar intake of Irish children has not been documented.
The majority of children in our study consumed SSB, accounting for a significant proportion of daily energy and sugar intake.
The study provides strong evidence of an association between SSB consumption and overweight and obesity.
Our results provide a baseline from which the impact of the SSB tax, recently introduced in Ireland, on consumption levels of these drinks can be gauged.
Acknowledgements
Acknowledgements: The authors would like to acknowledge the contribution of all study participants and the participating schools for accommodating data collection. Financial support: The Cork Children’s Lifestyle Study was funded by the National Children’s Research Centre, Crumlin. The authors are affiliated with the HRB Centre for Health and Diet Research (HRC/2007/13). Conflict of interest: None. Authorship: J.M.H. is the PI and guarantor for this study; she designed the study, analysed the data, interpreted the results and drafted and revised the article. J.M.H. has access to the data and controls the decision to publish. C.P. conducted data collection, processed the food diary data, assisted with data analysis and reviewed and commented on manuscript drafts. E.K. conducted data collection, advised on results interpretation and commented on manuscript drafts. I.J.P. conceived and designed the study and helped draft the manuscript. Ethics of human subject participation: This study was conducted according to the guidelines laid down in the Declaration of Helsinki, and all procedures involving human subjects/patients were approved by the Clinical Research Ethics Committee of the Cork University Teaching Hospitals. Written informed consent was obtained from all subjects/patients.


