


Health, nutrition, food security and care practices in developing countries are keys to development. The nutritional status of children is the most valid indicator of their well-being( Reference de Onis, Frongillo and Blössner 1 ). Undernourished children have slow physical growth and are exposed to severe illness and premature death( Reference Prendergast and Humphrey 2 ). Below-normal height-for-age, also called stunting, is generally considered the best indicator of undernutrition, as it measures long-term deprivation of children’s basic needs. Stunting in early life is a sign of cumulative effects of individual factors: the socio-eco-political environment in which the child evolves, a low household wealth index, inadequate food intake for mother and child, maternal stunting, repeated illness and infectious diseases( Reference Black, Allen and Bhutta 3 ). Reducing stunting prevalence contributes to achieve the first of the Millennium Development Goals, target 1.C( 4 ), a challenging objective for sub-Saharan African countries in which 40 % of the world’s stunted children under 5 years of age currently reside( 5 ). Reducing it by 40 % in 2025 and ending it by 2030 are part of the second Sustainable Development Goal( 6 ).
Political instability may affect a child’s well-being( Reference Milman, Frongillo and de Onis 7 ). Civil wars and armed conflicts in several West African countries (Côte d’Ivoire, Guinea-Bissau, Sierra Leone and Liberia) have caused population displacement( Reference Marc, Verjee and Mogaka 8 ). Côte d’Ivoire was severely affected by a civil war from 2002 to 2011, creating a demarcation line between North and South. A recent analysis of stunting from 1994 to 2011 found no change in socio-economic inequality of stunting in thirty-one out of fifty-three countries, including Côte d’Ivoire( Reference Bredenkamp, Buisman and Van de Poel 9 ). However, a worldwide systematic analysis of nutritional changes from 1985 to 2011 reported a high probability of deterioration in the height-for-age Z-score (HAZ) of pre-school children in Côte d’Ivoire and Niger, in contrast to overall improvement in sub-Saharan Africa from the late 1990s to 2011( Reference Stevens, Finucane and Paciorek 10 ). Conversely, a recent overview found a 4·2 % decrease in the prevalence of stunting among children below the age of 2 years in Côte d’Ivoire between 1994 and 2011( Reference Tzioumis, Kay and Bentley 11 ). The knowledge of stunting prevalence distribution at different spatial levels (country, region and zone) and its change over time may help policy decision makers to identify areas where urgent nutritional interventions are needed and to adapt national programmes and strategies to reduce the burden of stunting in Côte d’Ivoire.
The main objective of the present study was to examine stunting changes over time among children under the age of 3 years across three defined zones (i.e. Abidjan, the South and North) in Côte d’Ivoire, based on Demographic and Health Survey (DHS) and Multiple Indicator Cluster Survey (MICS) data collected in 1994, 1998 and 2011. It also sought to describe the spatial distribution of stunting across regions/zones and to detect spatial clusters of low and high stunting prevalence. Our study hypothesis was that stunting prevalence among children under 3 years of age would have increased from 1994 to 2011 in some parts of the country, and especially the North, which was economically isolated during the civil war.
Methods
Study design
The present secondary study of Côte d’Ivoire DHS data analysed changes in stunting prevalence and distribution among 0–35-month-old children in Côte d’Ivoire over a period of 17 years, using nationally representative data from Côte d’Ivoire DHS in 1994, 1998–1999 and 2011–2012.
Côte d’Ivoire, the civil war 2002–2011
During the civil war which began in September 2002, the country was divided into two parts separated by a buffer zone: a northern part, occupied by rebel forces, and a southern part, including Abidjan, controlled by the government( Reference Aurégan 12 , Reference Vidjannangni 13 ). The civil war led to wide-scale displacement of populations, including internal and external migrations and displacement of civil servants, teachers and health staff from the North to the South. Abidjan was the most frequent destination of these internal migrations. Conversely, some inhabitants living in the South, and especially Burkinabe citizens, fled the country.
Inclusion criteria
Our analytical sample included all children under 3 years of age who had reliable HAZ values (i.e. in the range from –6 to 6).
Design and procedures of the 1994, 1998 and 2011 Demographic and Health Surveys in Côte d’Ivoire
The 1994, 1998–1999 and 2011–2012 Côte d’Ivoire DHS were conducted by the National Statistical Institute and ORC Macro between June and November 1994, between September 1998 and March 1999, and by the National Statistical Institute and ICF Macro between December 2011 and May 2012, respectively( Reference N’Cho, Kouassi and Koffi 14 – 16 ). All followed standardised DHS methodology and all investigators were female( 17 ).
The 1994 Côte d’Ivoire DHS used a stratified two-stage cluster random sample design in Abidjan and rural areas. Enumeration areas (EA, i.e. groupings of households) were selected at the first stage and households at the second stage. For other areas, a three-stage cluster design was used: cities were selected at the first stage, EA at the second stage and households at the third stage. Overall, 246 EA (146 urban and 100 rural) were selected, leading to a total of 6348 eligible households, among which 5935 (2745 urban and 3190 rural) were included (see online supplementary material, Supplemental Fig. 1). All eligible women and their children under 3 years of age were eligible for anthropometric measurements; for financial reasons, 3- and 4-year-old children were not eligible (Côte d’Ivoire DHS staff, personal communication, 16 August 2016). Weight and height information was collected for 8099 women interviewed; 3645 children under the age of 3 years were eligible.
The 1998–1999 Côte d’Ivoire DHS used a stratified two-stage cluster random sample design. Among 2302 eligible households, 2122 (1421 urban and 701 rural) were included. Weight and height were collected for 3040 interviewed women; 1221 children under 3 years of age were eligible. For the 1994 and 1998 Côte d’Ivoire DHS, the sampling frame of household groupings (n 246 and n 140, respectively) had been elaborated using the second General Population and Housing Census (GPHC) performed in 1987–1988( 18 ).
The 2011–2012 Côte d’Ivoire DHS–MICS used a stratified two-stage cluster design. Stratification was based on eleven statistical regions and place of residence (urban or rural). The sampling frame of household groupings had been elaborated based on the third Côte d’Ivoire GPHC in 1998–1999( 18 ). Among 10 413 eligible households, 9686 were included. Half of the eligible households were selected for anthropometric measurements. Among 10 848 eligible women, 10 060 were interviewed; 2570 children under 3 years of age were eligible.
Geographic data
Côte d’Ivoire DHS collected EA geographic coordinates (latitude and longitude) using a geographic information system and global positioning system technologies. On average, urban EA grouped twenty and rural EA thirty-five households in 1994. In 1998, urban EA grouped fourteen and rural EA eighteen households, as compared with twenty-seven and thirty-two households, respectively, in 2011. The median household size was five inhabitants in all three surveys. Geographic coordinates were collected at the centre of the EA for all Côte d’Ivoire DHS. Geographic, household and child data sets for all three surveys are available from the DHS programme website( 19 ). Geospatial data manipulations were performed using Quantum Geographic Information System software, version 1.8.0( 20 ).
Definition of variables
The dependent variable was stunting, defined as a height-for-age below −2 sd of the median height-for-age of the WHO international growth standards (i.e. HAZ<−2)( 21 ). The main independent variables used were the year of survey and the zone in which the child resided. EA for the 1994 and 1998 Côte d’Ivoire DHS were allocated to the eleven statistical regions defined in the 2011–2012 DHS (Fig. 1). Next, we divided the country into three zones based on partitioning of the country during the 2002–2011 civil war( Reference Hagos, Lunde and Mariam 22 ). These were Abidjan, the South (below the demarcation line, excluding Abidjan) and the North (above the demarcation line; Fig. 1). Other variables were sex and birth order (1, 2–3, 4–5 or ≥6), child age group (<6, 6–11, 12–17, 18–23, 24–29 and 30–35 months), education level of the mother (no formal education, primary or secondary level), BMI of the mother (<18·5, 18·5–25·0 and >25·0 kg/m2, i.e. underweight, normal and overweight/obese, respectively) and economic status of the household (as defined by each Côte d’Ivoire DHS) divided into fifths.
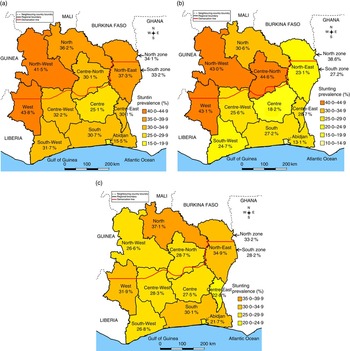
Fig. 1 (colour online) Average stunting prevalence in children aged 0–35 months in Côte d’Ivoire in (a) 1994, (b) 1998 and (c) 2011
Assets used for construction of the wealth index varied across surveys, making survey-specific indices inadequate for pooled analyses. Instead, we constructed a comparative wealth index (CWI) for each of the 1994, 1998 and 2011 Côte d’Ivoire DHS based on α and β coefficients representing, respectively, the amount of adjustment and dispersion of the level of the survey-specific wealth index relative to the baseline wealth index, for 172 DHS conducted worldwide from 1990 to 2012( Reference Rutstein and Staveteig 23 ). The CWI was divided into fifths for analysis.
Sampling weights
Sampling weights, which are country- and sex-specific, are not valid for analysing pooled data( 24 ). For 1994 and 2011 Côte d’Ivoire DHS, we de-normalised weights using the number of females aged 15–49 years in Côte d’Ivoire in 1994 and 2011, respectively (reference: United Nations Population Division website( 25 )). For 1998, a national census was available. Thus, we used the total number of women aged 15–49 years in the 1998 Côte d’Ivoire GPHC, stratified by place of residence, and the total number of women 15–49 years old in the 1998 Côte d’Ivoire DHS database.
Statistical analysis
Stunting prevalence mapping and cluster detection
We computed the EA-based stunting prevalence for each Côte d’Ivoire DHS, globally and across the three zones (Abidjan, North and South). The overall spatial pattern of stunting prevalence was analysed using the global Moran’s test. Moran’s I statistics test the hypothesis that observed data at one location are independent of observed data at other locations. When this hypothesis is rejected, the use of a geostatistical approach is justified. We mapped stunting prevalence throughout the country independently of regional boundaries using the geoR library of R software, version 3.1.0 (R Core Development Team, 10 April 2014)( Reference Diggle and Ribeiro 26 , Reference Ribeiro and Diggle 27 ). We fitted the sample variograms with Matern, spherical and exponential models, respectively for 1994, 1998 and 2011 Côte d’Ivoire DHS using the VARIOFIT function. We interpolated stunting prevalence in the 1 896 246 points using a regular grid of 737 km×776 km and the ordinary kriging technique( Reference Cressie 28 ). The kriging technique consists of predicting nearest sampled data values (EA-based stunting prevalence in our case) at unsampled spatial locations. Predicted values are weighted means of the observed values and weights are based on a variogram that measures the spatial dependence or autocorrelation between observed values. A full description of this technique can be found elsewhere( Reference Diggle and Ribeiro 26 – Reference Cressie 28 ). The ordinary kriging technique, which assumes that the mean is an unknown constant over space, was chosen because it is the best linear unbiased estimator with known minimum variance( Reference Cressie 29 ).
Moreover, we used Kulldorff’s spatial scan statistics (package SaTScan, version 9.3) to identify spatial clusters with high or low stunting prevalence for each Côte d’Ivoire DHS( Reference Kulldorff 30 , Reference Kulldorff and Nagarwalla 31 ). This method has been widely used in recent years, including in the field of child nutrition( Reference Dahly, Gordon-Larsen and Emch 32 , Reference Gebreyesus, Mariam and Woldehanna 33 ). It enables locating areas with higher or lower numbers of stunted children than expected under the hypothesis of uniform spatial distribution of stunting. A scanning circular window of varying size gradually moves across the study area to detect areas with an excess number of stunted children. At each step, the number of observed cases in the moving window is compared with the expected number of cases assuming random spatial distribution. We used a default value of 50 % of the total study population for detection of clusters and a maximum radius of 100 km. This distance was chosen based on the results of correlogram analyses: we created a set of radiuses from 50 to 750 km (i.e. 50, 100, 150, etc.), covering the range of the observed distances between EA for each DHS. Each radius was used as the threshold distance for neighbourhood for all DHS in the correlogram analyses. The maximum radius beyond which the spatial autocorrelation was no longer significant was used as inputs in the spatial scan procedure. Based on Monte Carlo hypothesis testing( Reference Dwass 34 ), the likelihood ratio tests and their associated P values obtained through 9999 Monte Carlo replications in the Bernoulli probability model were used to ascertain the statistical significance of detected spatial clusters. The null hypothesis is that of a uniform distribution of observed number of stunted children in Côte d’Ivoire, showing equal child stunting risks across the country. When a cluster was identified, strength of clustering was ascertained using the relative risk (RR) of excess of stunted children. The estimated risk within a cluster was defined as the ratio between the observed and expected number of stunted children, and the RR was defined as the ratio between estimated risks inside the cluster v. outside (i.e. in the remaining part of the country). A cluster was declared significant for P<0·05.
Temporal variations in stunting
Assessment of trends in stunting and background variables was based on observed individual-level data recorded in the 1994, 1998 and 2011 Côte d’Ivoire DHS for the country as a whole and for each of the three zones, using a χ 2 test for trend for the combined cross-sectional survey data. Maternal BMI was assessed for normality using the Shapiro–Wilk test and compared across surveys using the Kruskal–Wallis test. The association between stunting and background variables was assessed using χ 2 tests.
Multilevel logistic regression models were then used( Reference Haile, Azage and Mola 35 ). The objective was to assess whether changes in stunting over time could be explained by changes in some of its major risk factors. Levels were individuals and EA. EA were used as random effects. The random effects variance–covariance structure was defined as independent. The dependent variable was stunting and the main explanatory variables were year of survey, zone and interaction term between year and zone. In the case of a significant interaction, the study protocol included separate logistic models for each zone. Models were adjusted for maternal education and BMI, family wealth, child’s birth order, age and sex. These variables were chosen based on their association with stunting in the literature and their availability in all surveys. Cases with missing data (i.e. for birth order, maternal education or maternal BMI) were excluded. For each zone-specific model, we computed intra-cluster correlation (ICC) and median odds ratio (MOR). ICC informs us on the proportion of total variance in the outcome that is attributable to the area level( Reference Haile, Azage and Mola 35 , Reference Merlo 36 ). The MOR is defined as the median value of the odds ratio of the area at higher risk compared with that at lower risk, when randomly picking out two areas. The MOR can be conceptualised as the increased risk that an individual would have (in median) if moving to another area with higher risks( Reference Larsen and Merlo 37 ). In our study, the MOR shows the extent to which the probability of being stunted is attributable to individual-level factors. The estimation was done using the maximum pseudo-likelihood for survey data with the svyset function( Reference StataCorp 38 ). The association of independent variables with risk of stunting was assessed using odds ratios and their 95 % confidence intervals. The statistical software package used was Stata© release 14.
All tests were considered statistically significant for P<0·05.
Results
In the 1994 Côte d’Ivoire DHS, 3645 children under 3 years of age were included in the survey. We excluded 289 children (7·9 %) who had unreliable or missing height or age data, leading to 3356 children (see online supplementary material, Supplemental Fig. 1). The 1998 Côte d’Ivoire DHS included 1221 children under 3 years of age, among whom 108 (8·9 %) had unreliable or missing height or age data. Thus, 1113 children were kept in the analysis. In the 2011 Côte d’Ivoire DHS, there were 2570 children under 3 years of age. We excluded 330 children (12·8 %) who had unreliable or missing height or age data. Thus, 2240 children were kept in the analysis.
The study sample thus comprised 6709 children of whom 5852 had complete data for all background variables. The median number of children per EA was 10 (interquartile range (IQR) 6–19), 4 (IQR 2–11) and 5 (IQR 2–8) for Côte d’Ivoire DHS 1994, 1998 and 2011, respectively.
Characteristics of the study population
Table 1 shows the distribution of <3-year-old children by zone and other characteristics for the 1994, 1998 and 2011 Côte d’Ivoire DHS. The χ 2 test for trend results showed that the proportion of children by zone did not change over time (P=0·80), but that the age distribution differed across surveys (P=0·014). The distribution of birth order also changed over time (P<0·01); in particular, fewer children had a birth order ≥6 in 2011.
Table 1 Background characteristics of 0–35-month-old children in Côte d’Ivoire from 1994 to 2011

Demographic and Health Survey sampling weights were used.
* P values of χ 2 trend tests accounting for the complex sampling design.
† For birth order, 220 values were missing, all in 2011.
‡ For level of education, 102 values were missing, all in 2011.
§ For maternal BMI, 311, 108 and 438 children had missing values in 1994, 1998 and 2011, respectively.
║ The comparative wealth index (CWI) was computed based on 172 Demographic and Health Surveys conducted worldwide from 1990 to 2012( Reference Rutstein and Staveteig 23 ).
Two-thirds of mothers had no formal education and the level of schooling did not change between 1994 and 2011. Their median BMI was 21·6 (IQR 20·1–23·5) kg/m2, 21·9 (IQR 20·1–23·9) kg/m2 and 22·2 (IQR 20·5–24·5) kg/m2 in 1994, 1998 and 2011, respectively (P<0·001). The prevalence of maternal underweight decreased and that of overweight/obesity increased over time (Table 1). The CWI deteriorated in 2011; indeed, fewer children lived in the richest households compared with earlier years (P<0·01 for differences across surveys).
The prevalence of stunting was 30·7 (95 % CI 28·5, 32·9) %, 27·8 (95 % CI 24·0, 31·6) % and 28·7 (95 % 26·2, 31·2) % in 1994, 1998 and 2011, respectively (P=0·32). About 10 % of children were wasted; this prevalence did not change between 1994 and 2011 (P=0·14).
Spatial inequalities in stunting prevalence
The results of Moran’s tests showed that stunting prevalence data were spatially autocorrelated (Moran’s I=0·12 in 1994, Moran’s I=0·19 in 1998 and Moran’s I=0·08 in 2011, P<0·05 for all). Thus, the hypothesis of spatial homogeneity was rejected.
In 1994, stunting prevalence ranged between 15·5 (95 % CI 11·8, 19·3) % in Abidjan and 43·8 (95 % CI 37·0, 50·5) % in the West region (Fig. 1(a)). It was close to or above 40 % in the North-West, the North-East and the North regions, and was 34·1 % overall in the North zone. Interpolated data showed the spatial heterogeneity of stunting independently of regional boundaries (Fig. 2(a)). The highest prevalence was observed in the North-West, West and North regions, with internal variations in prevalence in all regions and zones. Spatial scan statistics detected one significant cluster of high stunting prevalence in a radius of 79·0 km which ran throughout the West region. This region contained eighty-six stunted children (i.e. 49·1 % of children in the cluster), giving an RR of 1·64 (P<0·001). Spatial scan also detected one significant cluster of low prevalence with a radius of 16·2 km, located around Abidjan. This cluster enclosed seventy-eight stunted children (i.e. 14·5 %), giving an RR of 0·43 (P<0·001; Fig. 3(a)).
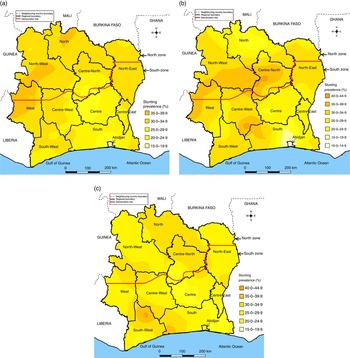
Fig. 2 (colour online) Interpolated stunting prevalence in children aged 0–35 months in Côte d’Ivoire in (a) 1994, (b) 1998 and (c) 2011
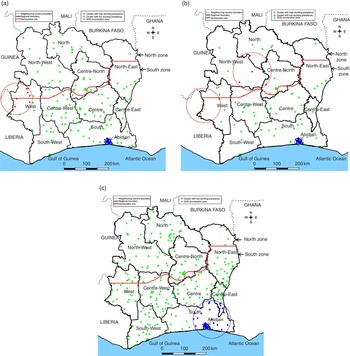
Fig. 3 (colour online) Spatial distribution of the sampling enumeration areas and clusters with high and low stunting prevalence in children aged 0–35 months in Côte d’Ivoire in (a) 1994, (b) 1998 and (c) 2011 (DHS, Demographic and Health Survey)
In 1998, the prevalence was high in the West, North-West and Centre-North regions, and, globally, in the North zone (Fig. 1(b)). Interpolated data showed substantial spatial heterogeneity in stunting, ranging from 10·0 to 44·9 % across regions (Fig. 2(b)). There were areas with high risk of stunting in the Centre-West and Centre-North regions. Spatial scan statistics (Fig. 3(b)) revealed two significant clusters with high stunting prevalence, one with a radius of 94·4 km located in the West region (P=0·003, RR=1·93, thirty-nine cases, i.e. 51·3 % of children in the cluster) and another with a radius of 84·8 km, centred in the North-West region (P=0·011, RR=1·90, thirty-six cases, i.e. 50·7 %). There existed one significant cluster with low stunting prevalence with a radius of 17·2 km located around Abidjan (P=0·003, RR=0·48, twenty-five cases, i.e. 14·8 %).
In 2011, stunting had decreased in certain regions that had shown a high prevalence in 1994 and 1998, but not in the North region, where it remained high (37·1 %; Fig. 1(c)). Interpolated data exhibited areas of high risk of stunting in the South-West, South, North and Centre-North regions (Fig. 2(c)). Spatial scan statistics showed no clusters with high prevalence, but one cluster with low prevalence and a radius of 93·7 km (P=0·010, RR=0·67, ninety-five cases, i.e. 20·6 % of children in the cluster) located under the secession line and covering Abidjan and parts of the South (Fig. 3(c)).
For all years under study, stunting prevalence was lowest in Abidjan (15·5, 13·1 and 21·7 %, respectively).
Temporal variations in stunting
Unadjusted logistic regression analyses based on all 6709 children showed no significant change in stunting prevalence from 1994 to 1998 or from 1994 to 2011 in Côte d’Ivoire as a whole (P>0·20; Table 2). The χ 2 test for trend results showed that there was no linear trend in stunting for Abidjan (15·5, 13·1 and 21·7 % for the three surveys, respectively, P=0·11), but the odds were significantly higher in 2011 than in 1998 (OR=1·85, 95 % CI 1·08, 3·15). In the South, there was a significant negative trend in stunting over time (33·2, 27·2 and 28·3 %, respectively, for the three surveys, P for trend=0·024); compared with 1994, OR of stunting in 1998 and 2011 were both significantly below 1, i.e. 0·75 (95 % CI 0·56, 0·995) and 0·79 (95 % CI 0·66, 0·96), respectively. There was no difference across years of survey for the North.
Table 2 Non-adjusted effect of time on stunting prevalence in 0–35-month-old children in Côte d’Ivoire and its three zones from 1994 to 2011
Data are based on de-normalised sample weights.
* P values for multilevel logistic regression.
† P values of χ 2 tests for trend.
All covariables were significantly associated with stunting, either in the whole country (sex, age, family wealth, maternal education and BMI) or in the South zone (birth order; results not shown).
Multivariable logistic regression analysis was conducted in 5852 complete cases. The proportion of excluded children was 9·2, 9·6 and 19·6 % in 1994, 1998 and 2011, respectively (P<0·001), and did not differ by zone (P=0·29). Excluded children were more likely to be stunted than complete cases in the South zone in 1994 (45·7 v. 31·8 %, P<0·001) and 1998 (42·1 v. 25·4 %, P=0·017), and in Abidjan in 1998 (33·3 v. 10·5 %, P<0·01), but not in the remaining zones and years (P>0·10 for all).
In multivariable regression, a significant interaction existed between year and zone (P=0·028), with children living in the South and surveyed in 2011 having a lower risk (Table 3). Therefore, logistic regression analyses for complete cases were performed separately for the three zones, as per protocol (sample sizes were 845, 3630 and 1377 children in Abidjan, South zone and North zone, respectively). In the South, stunting decreased significantly over time. The adjusted OR were 0·71 (95 % CI 0·53, 0·95) and 0·74 (95 % CI 0·58, 0·94) for 1998 and 2011, respectively (Table 3). There was no change in the prevalence of stunting between 1998 and 2011 (Table 4). In the North, there was no significant effect of year on stunting between 1994 and 1998, or between 1994 and 2011, in adjusted analyses (P >0·20 for both; Table 3). Thus, adjustment did not change the association between stunting and year of survey.
Table 3 Multivariable mixed-effects logistic regression analysis of factors associated with stunting in 0–35-month-old children in Côte d’Ivoire and its three zones from 1994 to 2011
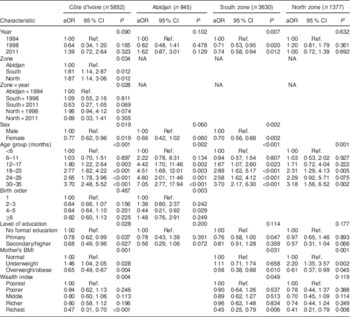
aOR, adjusted odds ratio; Ref., reference category; NA, not applicable.
Each model includes only variables that were significant at P<0·20 in univariable and adjusted models.
Data are based on de-normalised sample weights.
Table 4 Multivariable mixed-effects logistic regression analysis of factors associated with stunting in 0–35-month-old children in Côte d’Ivoire and its three zones from 1994 to 2011, with 1998 as the year of reference
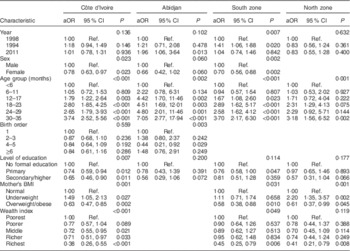
aOR, adjusted odds ratio; Ref., reference category.
Each model includes only variables that were significant at P<0·20 in univariable and adjusted models.
Data are based on de-normalised sample weights.
In Abidjan, the prevalence of stunting did not vary either between 1994 and 1998 or between 1994 and 2011 (Table 3), but the significant increase between 1998 and 2011 that existed in the unadjusted analyses remained very similar in the fully adjusted model (adjusted OR=1·96, 95 % CI 1·06, 3·64; Table 4). Between 1994 and 2011, birth order decreased in Abidjan whereas household wealth decreased from 1994 to 1998 and then increased again (P<0·001 for both; see online supplementary material, Supplemental Table 1).
Final zone-based logistic models showed that ICC and MOR were respectively 2·9 (95 % CI 0·8, 9·4) % and 1·44 (95 % CI 1·21, 1·98) in the South zone, 1·2 (95 % CI 0·0, 24·5) % and 1·27 (95 % CI 1·05, 3·33) in the North zone and 9·0 (95 % CI 2·9, 25·0) % and 1·94 (95 % CI 1·44, 3·38) in Abidjan. MOR of the empty model (i.e. without explanatory variables) was 1·72 (95 % CI 1·52, 2·03) and decreased when explanatory variables were taken into account in the South and North zones, showing a significant effect of clustering in these zones, in contrast to Abidjan.
Discussion
We examined the effect of time on stunting prevalence among children aged 0–35 months in Côte d’Ivoire, globally and within three large zones (South, North and Abidjan), using 1994, 1998 and 2011 DHS data. We identified spatial clusters with high and low stunting prevalence.
Our study hypothesis was that stunting prevalence would have increased during that period because of the 2002–2011 civil war, especially in the North, which was economically isolated. The analysis showed that there was no overall significant change in stunting. The North showed a fairly constant prevalence and we even found a significant reduction in stunting between 1994 and 2011 in the large southern zone of the country (adjusted OR =0·74; 95 % CI 0·58, 0·94). Only Abidjan had an increased risk from 1998 to 2011.
The analysis also confirmed our hypothesis of the existence of substantial spatial heterogeneity in stunting across regions and zones in all three surveys. The spatial dimension of stunting is often analysed using exploratory spatial data analysis techniques at the national and regional level( Reference Adekanmbi, Uthman and Mudasiru 39 ). In addition, the analysis presented here included spatial patterns of stunting prevalence on a local scale( Reference Getis and Ord 40 ). This was achieved using the Kulldorff spatial scan test as a local clustering test( Reference Anselin 41 ).
In 1994, stunting was most prevalent in the North (34·1 %), in particular in the North and North-West regions and parts of the West and North-East regions. In spatial analyses, we identified a cluster with high prevalence in the West region (43·8 %). These results are consistent with those of a study conducted in Côte d’Ivoire in 1990( Reference Sahn 42 ). In 1998, the highest stunting prevalence was found in the Centre-North, West and North-West regions, which contained two high-risk areas.
For all surveys, a cluster with low stunting prevalence was found in the South, centred on Abidjan. This was expected given the higher socio-economic level in the capital city. However, there was an increase in stunting between 1998 and 2011. This might be due to a massive arrival of refugees from the North during the civil war( Reference Courtin 43 ) and/or to a global negative impact of the war on the nutritional situation of children below the age of 3 years.
At the time of the last survey in 2011, the civil war had just ended. The aftermath of the civil war, mainly in the North, involved theft of livestock, destruction of public infrastructures and crops, shortage of human resources, economic contraction, and displacement of health staff and populations towards the southern parts( Reference Minoiu and Shemyakina 44 – Reference Akresh, Verwimp and Bundervoet 46 ). A recent study in Côte d’Ivoire provided evidence that children from conflict-affected regions (South-West, West, North-West, North, Abidjan, North-East regions) or households having experienced economic stress during the period 2002–2007 (measured by loss of productive assets such as jobs, farms and livestock, or a decrease in income) had lower mean HAZ than those from less conflict-affected regions( Reference Minoiu and Shemyakina 47 ). Our findings are also consistent with those of a study carried out in 2014 which showed that childhood health was affected in regions around Guiglo (West region), Bouaké (Centre-North region) and Korhogo (North region), where numerous conflicts occurred( Reference Minoiu and Shemyakina 44 ).
The civil war was not the only socio-economic event during the years under study. In addition, the western part of the country, where stunting was highly prevalent in 1994 and 1998, suffered from land-related conflicts between indigenous ethnic groups and non-Ivoirians, among them Liberians, who fled the 1999–2003 Liberian civil war( Reference Minoiu and Shemyakina 44 ).
In the 1990s, the purchasing power of the population decreased due to a decline in international cocoa prices( Reference Cogneau and Jedwab 48 ). Another major macroeconomic change was the 50 % devaluation of the national currency, the Communauté Financière Africaine francs (CFAF), in February 1994( Reference Grimm, Guenard and Mesple-Somps 49 ). This change, which affected most French-speaking countries in West and Central Africa, was shown to have a negative impact on the nutritional status of pre-school children in Brazzaville, Congo, between 1993 and 1996( Reference Martin-Prével, Traissac and Massamba 50 ). However, it is doubtful that a macroeconomic event in February 1994 would already have affected stunting of children below the age of 3 years at the time of the Côte d’Ivoire DHS, carried out from June to November 1994. Indeed, stunting is a cumulative process and environmental insults have the greatest impact on linear growth from conception to age 12–18 months( Reference Black, Perez-Escamilla and Fernandez Rao 51 ). Thus, the high stunting prevalence in the West and North-West regions in 1994 was probably largely independent of the currency devaluation.
Spatial variations in pre-school stunting have been reported previously in sub-Saharan countries, for example in the Democratic Republic of the Congo, which suffered severe regional conflicts( Reference Kandala, Madungu and Emina 52 ). In 2007, the prevalence was very high in the eastern provinces affected by conflicts (46·1 %), but also in those relying on mining. In Nigeria, there was a strong south–north gradient in stunting prevalence among pre-school children in 2008, ranging from 11·6 % in one southern state to 59·7 % in a northern state( Reference Adekanmbi, Uthman and Mudasiru 39 ).
To our knowledge, the present study is the first making use of spatial techniques to analyse the effect of time on the prevalence of stunting in Côte d’Ivoire. However, the study had limitations. One was the rather low sample size in the 1998 Côte d’Ivoire DHS, limiting the statistical power of tests. Second, multivariate logistic regression was conducted on complete cases after exclusion of 12·8 % of children with missing data (for birth order, maternal education and BMI). It was not possible to estimate missing data using multiple imputations, due to the lack of other relevant background variables in the DHS databases. In some surveys and zones (three out of nine), stunting prevalence was higher for excluded children than for complete cases. Thus, although the results of multivariate analyses were very similar to those of unadjusted analyses, we cannot exclude that the observed change in stunting over time in the South zone or Abidjan was explained by changes in background variables such as birth order, maternal BMI or economic level.
Finally, we acknowledge that the current secondary analysis of Côte d’Ivoire DHS data could not formally link sub-national trends in stunting to the civil war. Since data are cross-sectional, we were not able to distinguish ‘true’ changes in young child nutritional status in a given population (due to changes in feeding and/or caring practices) from changes in population composition due to massive arrival of residents to certain areas such as Abidjan.
Our findings show the progress made by Côte d’Ivoire in reducing stunting among young children at a local scale before and after the civil war. The exploration of spatial and spatiotemporal variations of stunting prevalence should provide national public health decision makers with useful information for nutritional interventions. The recent increase in stunting in Abidjan is a matter of concern, but its prevalence remained much lower than in the South and North zones. Although the North zone contributed less to the total amount of stunted children in the country than the South zone, due to its lower population density, it requires attention. Indeed, the reduction of inequalities in nutrition within the country is an important development goal.
Conclusion
In conclusion, the analysis presented here shows that the overall prevalence of stunting remained stable in Côte d’Ivoire between 1994 and 2011 despite the civil war, but that this average hides significant and contrasting changes at the sub-national level. Further analyses are needed to assess how and where the prevalence of stunting has changed in Côte d’Ivoire since the civil war ended in 2011. In the meantime, public health efforts should be reinforced throughout the country because stunting prevalence remained high in all three zones.
Acknowledgements
Acknowledgements: The authors thank the Institut National de la Statistique (INS) of Côte d’Ivoire and ICF International, which performed the 1994 and 1998–1999 Côte d’Ivoire DHS; the INS, the Ministère de la Santé et de la Lutte contre le Sida (Côte d’Ivoire) and ICF International, which performed the 2011–2012 Côte d’Ivoire DHS; and MEASURE DHS which provided the databases. They are grateful to Aurégan Xavier (Institut Français de Géopolitique, Université Paris 8), who kindly provided information on the demarcation line and buffer zone in Côte d’Ivoire, and to Françoise Gubry (UMR 196 CEPED Université Paris Descartes – Ined – IRD), who provided the 1998 Côte d’Ivoire GPHC report. Financial support: E.B. was the recipient of a doctoral fellowship from the Ministry of Education, Higher Education and Scientific Research in Burundi. Conflict of interest: None. Authorship: E.B., K.A.B., N.M., P.M. and C.L. elaborated the study design. E.B. obtained permission to use the 1994, 1998–1999 and 2011–2012 Côte d’Ivoire DHS data, performed statistical analysis and, with K.A.B., wrote the first draft of the paper. All authors contributed to interpretation of results, reviewed the draft and approved the final version of the manuscript. Ethics of human subject participation: This study was conducted according to the guidelines laid down in the Declaration of Helsinki and all procedures involving human subjects were approved by the Ethics Committee of ICF International at Calverton, MD, USA and by the National Ethics Committee of Côte d’Ivoire. Written informed consent was obtained from all mothers. This secondary study analysed existing publicly available survey data. MEASURE DHS de-identified these data before our access to the databases.
Supplementary material
To view supplementary material for this article, please visit http://dx.doi.org/10.1017/S1368980017000544


