


Field surveys, traditionally conducted on paper forms, are increasingly using electronic data capture tools, such as tablets and smartphones. Compared with paper methods, commonly cited relative benefits of electronic data capture include quicker access to data, more options to check data quality and interviewer performance, lower costs for data entry, and reduced risk of data loss during transport and storage( Reference Byass, Hounton and Ouédraogo 1 – Reference Style, Beard and Harris-Fry 3 ).
However, in low-income countries, these benefits have rarely been realised for the collection of dietary data, such as 24 h dietary recalls or weighed food records( Reference Caswell, Talegawkar and Dyer 4 – Reference Timon, van den Barg and Blain 6 ). Dietary intake assessment is well known to be error-prone( Reference Bingham 7 , Reference Cade, Thompson and Burley 8 ), so near-instant access to digitised data could facilitate improvements in data quality and precision of intake estimates, particularly for studies with large sample sizes. For example, data managers could quickly identify errors, such as implausible frequencies of food items or portion sizes, outliers in nutrient intake estimates, or missing or unexpected Global Positioning System (GPS) readings. They could also monitor interviewer performance by measuring digit preference, time taken to conduct interviews, or systematic under- or over-reporting.
A key challenge associated with the use of electronic capture of dietary data is the complex interview structure. Respondents may report multiple portions of a food item, from many hundreds of possible foods, at many different times of day( Reference Caswell, Talegawkar and Dyer 4 ). Dietary surveys also often collect recipes for mixed dishes and descriptions of leftovers or shared foods( Reference Harris-Fry, Paudel and Karn 9 ). These details are iteratively probed in a non-linear fashion during a dietary recall and this is difficult to program on smartphones. Another level of complexity is added to the data structure for studies collecting repeated dietary assessments on the same individuals and/or multiple individuals within households. However, if these challenges can be overcome, the quality and follow-up rates of dietary intake data might improve.
The present paper provides a novel solution to electronic collection of dietary data using CommCare software on smartphones, an atlas of graduated portion sizes and a list of food items. We also describe the development and implementation of the tool, characterise the diet to assess the plausibility of results, and comment on the key benefits and challenges of using this tool.
Methods
Study context
The current study was conducted in Dhanusha and Mahottari districts in the Terai, on the border with the Indian state Bihar. Being in the Indo-Gangetic floodplains, with fertile land and favourable climatic conditions, agricultural productivity is higher in the Terai than other regions of Nepal( Reference Malla 10 , Reference Regmi 11 ). Household food security in the Terai is higher than in the hilly and mountainous regions, but women’s nutritional status is among the lowest in the country (23 % with BMI <18·5 kg/m2, 52 % with Hb concentration <12 g/dl)( 12 ). Nepalese diets are typically monotonous and characterised by consumption of cereals and pulses, particularly rice and lentils, as well as tubers, and dairy in high caste groups( Reference Sudo, Sekiyama and Maharjan 13 – Reference Campbell, Talegawkar and Christian 15 ). Studies from the Terai show that gourd curries (bitter gourd, okra and snake gourd) are commonly eaten, whereas consumption of fruits, other vegetables, meat, fish and eggs is rare( Reference Sudo, Sekiyama and Maharjan 13 , Reference Campbell, Talegawkar and Christian 15 ).
2G connectivity is variable but generally good and a high proportion of households own a mobile phone (72 % in rural Nepal)( 16 ), both suggesting that phones may be a feasible and culturally acceptable mode of data collection. Although unreliable electricity can make it difficult to regularly recharge mobile phones, simple solutions such as battery packs can help to overcome this. Flooding in the monsoon season makes some remote areas hard to reach and makes travel time a major demand on resources, so electronic data capture could enable remote monitoring of data collectors working far away from the main town (Janakpur). Flooding also poses risks for the security of paper forms, whereas electronic data can be secured if the forms have been submitted to the web server.
From mid-August 2015, severe political unrest due to discontent over the new Nepal constitution and proposed federal state boundaries caused strikes, violent protests, road blockages, a border blockade, closure of markets and banks, and personal insecurity for the field team( Reference Haviland 17 ). During this time, travel across the district was not always safe and so data could be transmitted from respondents’ homes, rather than requiring interviewers to travel with paper forms to the field office.
We assessed dietary intakes to evaluate a pregnancy-focused, four-arm, cluster-randomised controlled trial, Low Birth Weight South Asia Trial (LBWSAT; http://www.controlled-trials.com/ISRCTN75964374). The trial tested the impacts of participatory women’s groups, food transfers with women’s groups, and cash transfers with women’s groups, on birth weight and infant nutrition( Reference Saville, Shrestha and Style 18 ). The dietary intake tool described in the present paper was developed to collect 24 h dietary recalls of pregnant women, their mothers-in-law and male household heads, to assess whether trial interventions were associated with higher dietary intakes during pregnancy and/or more equitable intra-household distribution of food than in the control areas.
Sample size and sampling
The selection of study site, randomisation and participant eligibility are described in full in the trial protocol( Reference Saville, Shrestha and Style 18 ). In brief, eighty Village Development Committee areas (administrative units) from Dhanusha and Mahottari districts were allocated to four study arms by stratified randomisation. Enrolment of pregnant women from these areas started in December 2013 and the interventions stopped in October 2015.
Between 10 June and 26 September 2015, we conducted a cross-sectional dietary intake survey on a sub-sample of enrolled women in their third trimester, their mothers-in-law and male household heads. A target sample size of 800 households (200 per arm) was based on power calculations to detect differences between trial arms in relative dietary energy adequacy ratios, a measure of intra-household energy allocation. Due to the known wide within-person variability of dietary intakes, we collected three dietary recalls per person, giving a maximum of nine dietary recalls per household. Households were excluded if the household composition did not include the pregnant woman, a male household head and the pregnant woman’s mother-in-law. To participate in the trial, women gave consent by signature or thumbprint. For each 24 h recall interview of every household member, respondents gave verbal consent.
Development of the 24 h recall tool
To minimise under-reporting (a common problem with recall-based methods) we followed a ‘five-stage multi-pass’ 24 h dietary recall method that uses five different probing techniques( Reference Moshfegh, Rhodes and Baer 19 ) and is recommended for the estimation of nutrient intakes in developing countries( Reference Gibson and Ferguson 20 ). The five passes and the data collection process are outlined in Fig. 1.
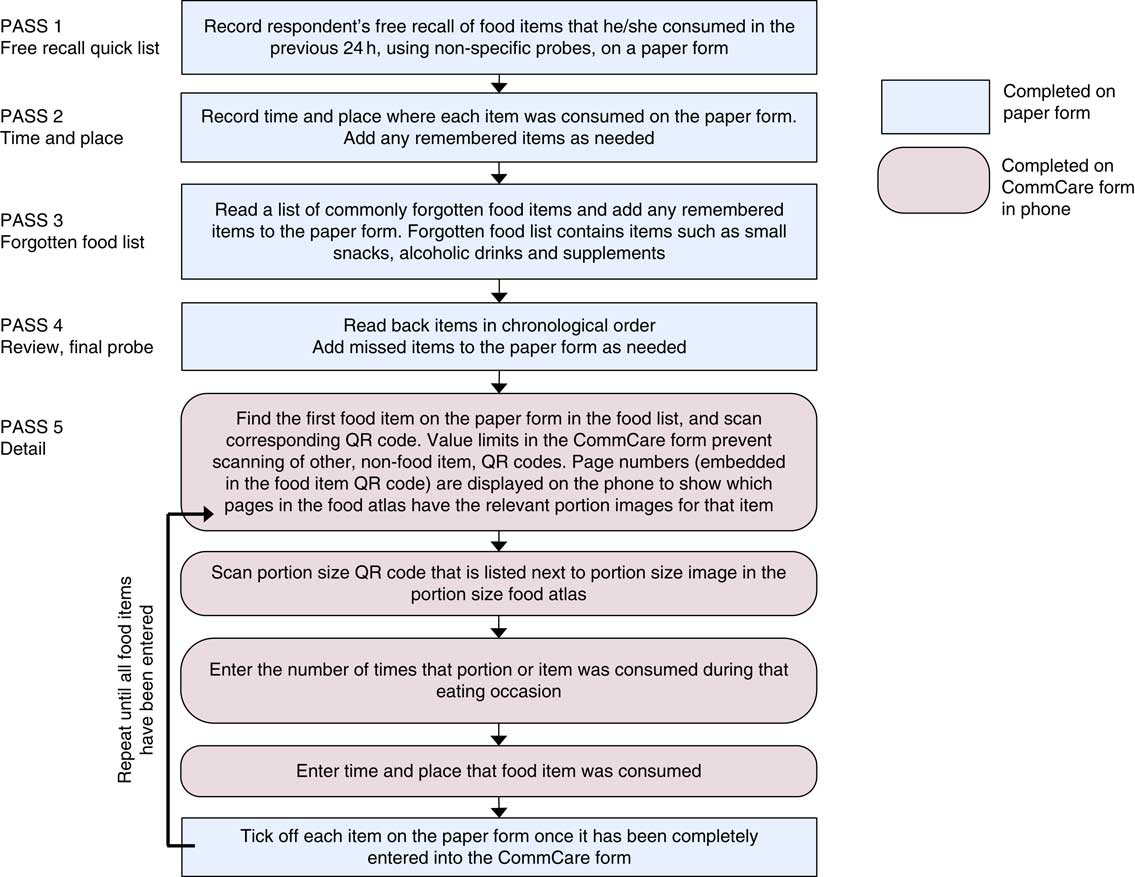
Fig. 1 Overview of the five-stage multi-pass 24 h recall process (QR, quick response)
The passes were ordered as follows: (i) collect a chronological free recall; (ii) probe for the time and place of consumption; (iii) ask about commonly forgotten foods like tea and fruit; (iv) review information so far and probe for anything missing; and (v) collect detail on specific food names and portion size estimates. Interviewers entered information from the first four passes on to a simple paper form to enable fluid interviewer–interviewee interactions; then the fifth pass (food names and portion sizes), plus the time and place of consumption, were entered into a smartphone form.
To develop the form, we used CommCare version 2.22.0 (http://www.commcarehq.org/home/), an open-source, cloud-based data collection platform. Interviewers could choose to view the questionnaire in Maithili, Nepali or English. The CommCare form coding is given in the online supplementary material, Supplemental File 1, so researchers can use and adapt the tool by creating a blank form in CommCare and importing the .xml file. We used Samsung Galaxy Y smartphones for the first two weeks but faced problems of forms unexpectedly closing mid-survey and losing data, so we used higher-specification Samsung Galaxy J1 phones for the rest of the study.
Food lists and portion size estimates
Each interviewer had a list of about 300 food names and a photographic atlas containing life-sized pictures of graduated portion sizes of forty locally prepared foods (list and atlas available on request from corresponding author). The food list was originally prepared for another study( Reference Akhter 21 ) but we refined it after pilot testing. To aid navigation, we organised the list by grouping the foods, providing a contents page, and creating a list of common foods at the front. The atlas contained between two and six images per item, depending on how common or nutritionally important the item was.
The development and validity of the photographic atlas has been described in detail elsewhere( Reference Harris-Fry, Paudel and Karn 9 ) but we edited the atlas after finding that volumes were not reliably selected. To select representative images of utensils for inclusion in the atlas, we collected data on utensil volumes by visiting twenty households from four randomly sampled clusters. Households were sampled using a spin-the-pencil technique, starting at the centre of the village, walking in the direction that the pencil pointed, and sampling every fifth household. Each utensil volume was measured three times. Volumes were measured using a 50 ml or 500 ml volumetric measuring cylinder and we used the water displacement method to estimate volumes of handfuls (muthi). Looking at the means and frequency distributions of utensil volumes, we selected the number of images and utensil sizes to include. If the distributions were bimodal we included two images, otherwise we included one image, and we chose the photograph of the utensil that was closest to the mean. The means, sd and ranges of these utensil volumes, and the selected volume of each image, are given in Table 1.
Table 1 Volumes of common household utensils

We collected weights of commonly eaten discrete food items by taking three samples of each food item from three markets. Non-edible parts, such as bones, stones and skins, were removed, the edible portions were weighed using Tanita weighing scales sensitive to 0·1 g, and average weights were reported to the nearest 1 g (Table 2).
Table 2 Average weights of edible portions of common foods reported as discrete items

* This item is very small, so a handful was weighed and the average weight per item was calculated.
Interview structure
To reduce translation requirements and minimise coding errors, every food item in the food list and portion size in the atlas had a unique number (5 and 4 digits, respectively) that was encoded in a quick response (QR) code. To create the QR codes, the information to be contained within the QR codes was first entered in Microsoft® Excel (2010) spreadsheets. We designed reports in a Microsoft Access (2010) database that used the data from Excel to produce the food list with QR codes and a list of portion size QR codes that were pasted into the photographic atlas. The QR codes in the reports were generated using the StrokeScribe Barcode Active X Control (http://www.strokescribe.com/; Excel spreadsheets and Access reports available on request from corresponding author). The QR code could be scanned using the barcode scanning functionality available in CommCare when the ‘ZXing Barcode Scanner’ application was also installed.
Examples of the portion size QR codes and food list are shown in Fig. 2.
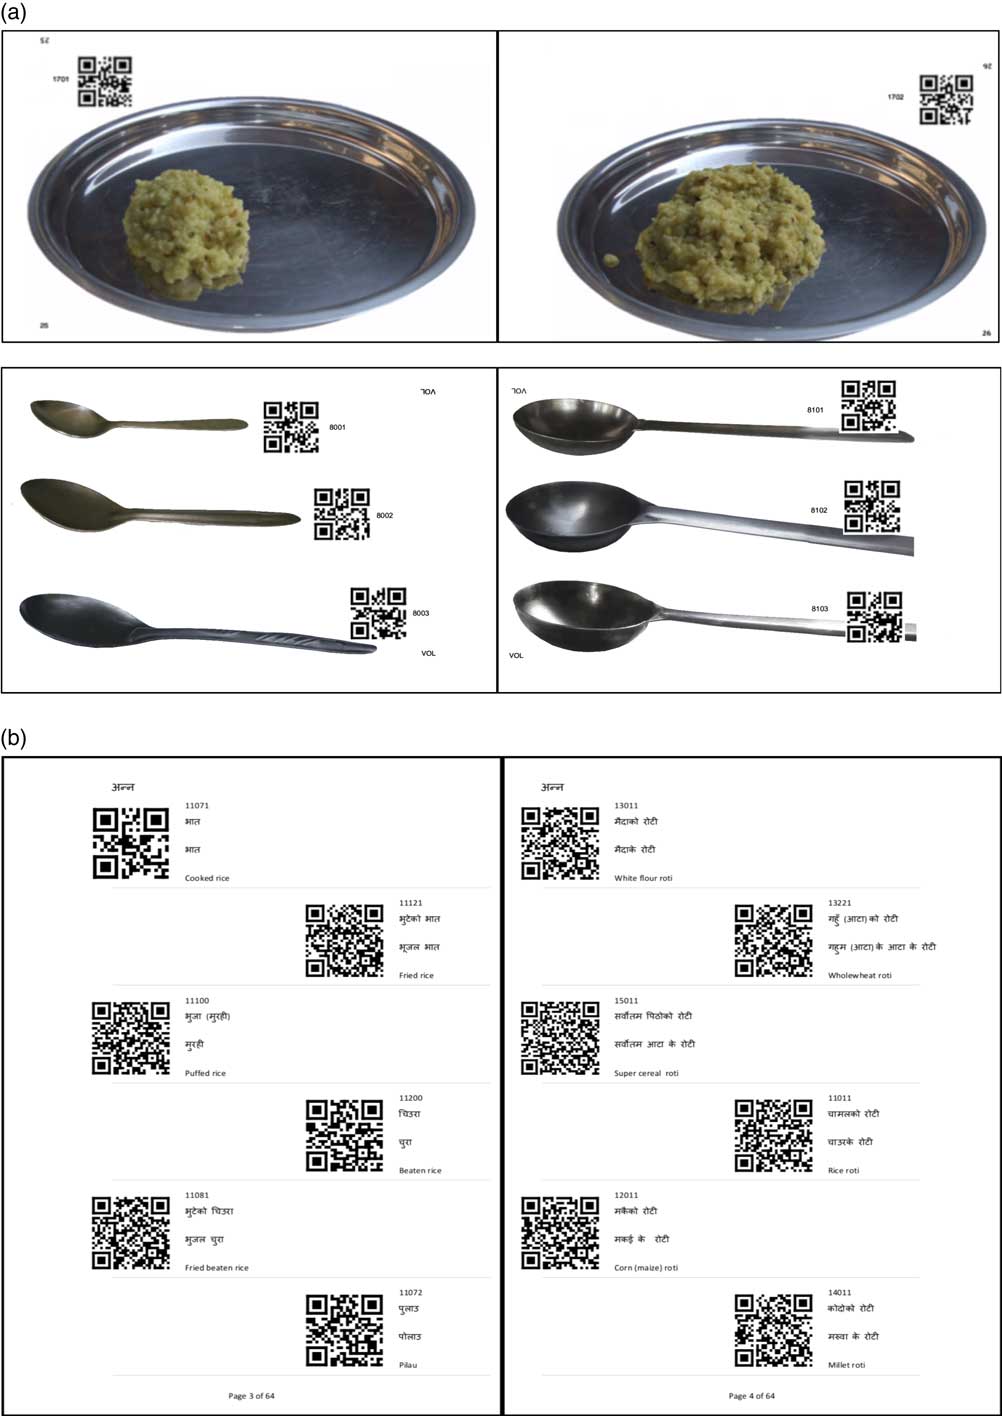
Fig. 2 Sample of pages from the photographic atlas and food list: (a) pages from the photo atlas with life-sized portion sizes, page numbers and QR codes (not to scale); (b) pages from the food list, with food names and QR codes (QR, quick response)
In addition to the 5-digit food code, the food item QR codes contained the names of the food items in Nepali and the page numbers in the photographic atlas corresponding to that food, so that this information could be displayed to the interviewer. The food item QR code also contained information (coded as ‘Y’ or ‘N’) about whether the food should be reported in frequencies, so questions about food frequencies were conditionally displayed. For example, rice was amorphous so no frequencies were reported, bananas were discrete so frequencies were needed, and cups of tea were discrete but varied in size, so their sizes (e.g. small teacup or large tea glass) and frequencies were reported.
After entering a portion, the interviewers could enter another portion of the same food type, add a different food, or end the recall. Although the portions were probed and entered on to paper forms chronologically, portions of the same food from different time points could be entered on to the CommCare form sequentially, to streamline the data entry process. So, for example if rice was consumed two or three times in a day all the portions of rice consumed at the different eating occasions could be recorded one after another to save repeated scanning of QR codes for the same food. The time of day that each portion was consumed was recorded so that the chronology was retained.
The instructions given on the smartphone during the dietary recall, including the QR code scanning process, are shown in Fig. 3.

Fig. 3 Screenshots of the CommCare form for collecting 24 h dietary recall data, illustrating the full 24 h recall process and entry of food items and portion sizes (QR, quick response)
There were constraints on the type of portion size QR code that could be scanned depending on the food item selected, so interviewers could not scan portion codes instead of food codes. We also made questions ‘required’ (an option in CommCare) so interviewers could not accidentally skip past a question, and provided ‘don’t know’ options in case the questions could not be answered.
Data collection for a household was complete if all three visits were complete, and a visit was complete if all three household members were interviewed. We expected that using paper registers to track this would be prone to error, so we developed an automated counting system with a short registration questionnaire in CommCare (see online supplementary material, Supplemental File 2), using the ‘case management’ function that allowed the completion status to be updated after completing each dietary recall. If a household member became unavailable and the first visit needed to be redone another day, the interviewer recorded the non-response and the count was reset accordingly. The logic (CommCare coding) for this counting is provided in Supplemental File 3. Interviewers could complete and save the forms offline, but then required Internet connection (typically 2G connection, or occasionally the office Wi-Fi) to send the forms to a cloud-based, password-protected server hosted by CommCare.
Survey implementation and data quality checks
We piloted the first version of the CommCare form in August 2014, and refined it before finalisation in April 2015. Between 3 and 11 June 2015, interviewers were trained on the 24 h recall method, including techniques for showing interest in respondents’ answers without showing surprise or disapproval and entering data quickly. Data could not be edited after form submission, so we instructed interviewers to record errors in their notebooks and reassured them that we could correct errors in the data set. After training, interviewers had two days of field practice. Interviewers also received a handbook on dietary assessment protocols.
Interviewers were required to visit unavailable households three times before categorising them as ‘non-respondents’. Due to the long time required to interview three household members, a small thank-you gift was given to the household on each visit. The gifts were prickly heat powder (~$US 1), a small towel (~$US 0·80) and two bars of soap (~$US 0·50).
Supervisors completed an observation checklist on 10 % of households to ensure that interviewers were adhering to protocols. The checklist assessed interview technique such as whether or not the interviewer gave a friendly greeting, obtained consent, used a non-judgemental interview manner and used non-specific probes. Supervisors also completed ‘back check’ forms by revisiting sampled households and checking that protocols had been followed. We had monthly meetings with the whole team to discuss any problems, share experiences and review the progress against targets (minimum target was two households per day).
We checked the data at least once per week. The main data checks were: number of interviews conducted each day by interviewer, percentage of GPS readings recorded by interviewer, mapping of GPS locations, time taken to complete interviews, digit preference, and frequency of outliers in dietary intakes. For implausibly high daily dietary intakes (>16 736 kJ (>4000 kcal)), we reviewed respondents’ recorded food items and intakes for that day. We also reviewed all cases where respondents had eaten any food portions at very high (≥20) frequencies. Implausible or unlikely data were verified or explained by back-checks with the households.
Calculating nutrient intakes
To calculate nutrient intakes, we first compiled a food composition table (FCT) using published sources and collected recipes, as described in Harris-Fry et al. ( Reference Harris-Fry, Paudel and Karn 9 ). In brief, we took values for raw ingredients from FCT from Bangladesh( Reference Shaheen, Rahim and Mohiduzzaman 22 ), the USA( 23 ), the UK( 24 ) and Nepal( 25 ). Rather than collect individual recipes in each household, we used average nutritional content from a sample of recipes. We collected 174 sample recipes for 127 dishes by weighed observation (between one and thirty-two samples per dish for rare foods and common items, respectively). We collected data from rural households, local vendors and interviewers’ own homes for rare items. Full detail is given in Harris-Fry et al. ( Reference Harris-Fry, Paudel and Karn 9 ).
We calculated recipe nutrient composition using the ingredient weights and nutritional values of the raw ingredients. Nutrients of all weighed ingredients in the recipe were summed, divided by the total weight of the final cooked dish (measured after cooking), and we reported the mean per 100 g of the mixed dish in the FCT. Food items in the FCT were coded to correspond with the codes in the food list. We chose not to use retention factors because none of the published factors were from local food preparation methods and because many of the nutrient requirement estimates( 26 ) have already accounted for nutrient losses in their estimates.
Next, we linked the dietary recall data (with food and portion codes) with the FCT and other data sets with portion size data, as illustrated in Fig. 4. We merged the FCT by matching the food codes in the food composition table with the food codes from the food list. A data set containing a list of discrete items, their food codes, and gram weights per item, was also merged by food code. We then merged in the portion size data, which was a simple data set of the portion codes and their weight in grams, by matching the portion codes with the codes embedded in the portion size QR code. After multiplying the portion or item sizes by the number of times each portion size was consumed, and calculating the nutrients per quantity of food item consumed, all nutrients were summed to give the total nutrients consumed per person on a given day.

Fig. 4 Data structure and method of merging data sets to calculate total nutrient intakes per day
Analysis methods
We used simple descriptive methods to describe respondent characteristics and reported median (25th–75th centile) energy intakes in kJ/d. We used data from the control arm only because respondents from intervention arms would not be representative of the wider population. Dietary data management and analyses were conducted using the statistical software package Stata SE version 14. The frequencies of different errors were described by reviewing and counting the corrections made in a data cleaning Stata .do file. Our experiences of using the tool were assessed and summarised by collating discussions between co-authors (from tool development, testing and personal observations) and by reviewing the authors’ notes from team meetings with interviewers and supervisors.
Ethical standards disclosure and data security
Ethical approval was obtained from the Nepal Health Research Council (108/2012) and the UCL Ethical Review Committee (4198/001). Verbal informed consent was obtained from all subjects. Verbal consent was obtained and formally recorded on paper forms.
The server, downloaded data files and the data collectors’ smartphones were all password-protected. Paper forms were stored in a locked cupboard for cross-referencing with the electronic forms.
Results
Description of dietary intakes from the control arm
In the control arm we collected data in 150 households, with a total of 1230 individual dietary recalls. Of sampled households, almost a third (31 %) were landless, over a third (36 %) were disadvantaged groups (Dalit or Muslim), and over half (54 %) of the pregnant women had not attended school.
Taking the first day of dietary recall (before loss to follow-up on subsequent visits), for all household members, almost all (98 %) respondents ate rice, about three-quarters ate dal (spicy lentil soup) and about 65 % ate roti (unleavened flatbread). Other commonly consumed items (i.e. food items that >20 % of respondents consumed at least some of) were tea with sugar and milk, mango (which was in season at the time), pointed gourd curry, fried spicy potato (bhujiya) and (for the pregnant woman only) buffalo milk.
The median (25th–75th centile) daily energy intakes (averaged over the three days of recall) were 8979 (7234–11 042) kJ/d for pregnant women, 9159 (6937–11 368) kJ/d for mothers-in-law and 12 079 (9293–14 108) kJ/d for male household heads.
Summary of errors and corrections made
Table 3 summarises the frequencies of the different errors (or intended corrections), also reported as a percentage of the total number of person-visits or food items, recorded during the course of the study. More explanation of these errors is also described below.
Table 3 Types and frequency of errors and corrections made to dietary intake raw data

QR, quick response.
A few errors arose from the counting mechanism that tracked completion of the household’s visit and the number of visits. In some cases, households were accidentally re-registered on the second visit, so the questions associated with the first visit would display. In other cases, when interviewers could not interview the respondents during a visit, they did not record the reasons for non-response (required to reset the counting logic). In these few cases, we provided a paper form and manually removed duplicate registrations from the data set.
In the first two weeks, some food items were mistakenly entered using the portion size QR code rather than the food item QR code. Most items (n 286) could be intuitively recoded based on the pictures that they scanned, and for items such as bowls we referred back to their paper forms and recoded the items (n 36) manually. To prevent further mistakes, we provided refresher training and reprogrammed the forms with additional QR code restrictions, using string length as the restriction since food item codes were always longer than the portion codes.
If an item was not included in the food list, interviewers could enter the ‘unknown’ food code and type the food name. These items needed recoding for analysis. Occasionally, interviewers selected the portion size from the atlas but then also mistakenly entered the respondents’ estimate of the portion size in grams or millilitres, instead of the number of times that portion was consumed (e.g. selecting the tea glass and then entering 100 to indicate 100 ml rather than 100 tea glasses).
Some other errors arose from mistakes identified and reported by the interviewers, or implausible values identified by our regular analysis and identification of outliers. Typographical errors all came from the entry of the frequency of portions. Sometimes glucose syrup was incorrectly entered because respondents added one teaspoonful to a glass, but the interviewers mistakenly entered a full glass of glucose.
Experience of using the 24 h recall tool and smartphones
Overall, we found that data monitoring was made easier with the use of smartphones because electronically entered data could be quickly converted into nutrient intake estimates; whereas paper forms would have needed manual checking and translation of food item names and portions. Having access to digitised data enabled us to analyse nutrient intakes, quickly detect and correct errors or outliers, make any final minor edits to the tool in the first weeks of data collection, identify topics for refresher trainings, and provide more support to interviewers who were making more errors or not meeting their targets. Access to the data also allowed us to refer to the data during our review meetings, so we could discuss the plausibility of outliers, emphasise to interviewers the importance of their accuracy and data quality, show the level of concern and attention being given to their data, and demonstrate that the data have meaning and use after their household interactions.
We found the form structure and tool components worked well. A key benefit of having a printed food list, rather than including the list of foods within the CommCare form, was that we could make edits after piloting without changing the form. The counting mechanism was helpful to track the number of repeats collected and ensure that all three household members were interviewed, and it also enabled us to spread other questions on food behaviours, food security and socio-economic status across the three visits.
In terms of time and resources, the set-up time required to develop the tools was much higher than paper forms, but this time was saved in data entry of paper forms. A few, highly skilled personnel were required for tool development (e.g. to generate QR codes and write the logic for tracking multiple visits and multiple household members), although CommCare has a very user-friendly web interface and so we did not generally require computer programmers to write code. For paper forms, data entry would have required more staff of lower-skilled levels over roughly the same length of time.
We faced some technical issues with the equipment. Unreliable electricity supply for charging phones in villages and limited battery life of smartphones led us to provide external battery packs, but phone power would still occasionally run out after a full day of data collection. Daily form submission was required to monitor progress and also minimise risk of data loss, but in some areas interviewers had to travel for 30 min to find cellular (2G) connection and submit their forms. Bugs in the CommCare system caused the forms to crash occasionally, particularly when using the QR code scanning or GPS functionalities, forcing interviewers to re-enter the data. CommCare was quick to respond, and released two new versions of the application to overcome some of these issues. After two weeks of data collection, the phones were upgraded to a higher specification, after which forms rarely crashed. Some interviewers would also note the portion codes on the paper forms, as a backup.
Regarding interviewers’ experiences of using the tool, despite having limited computing knowledge, they found the smartphone tool easy to use after practice and detailed training. However, they reported frustrations when the form crashed. Interviewers found the food list and photographic atlas easy to navigate, and quickly became familiar with the page numbers and locations of common items. Some interviewers placed sticky notes in the food list when interviewing the first respondent of the household to help find the foods again for the next respondents, since members of the same household tended to eat the same foods.
Points that were commonly reiterated in the review meetings included: showing the photographs the correct way up (so the respondents could see the images, rather than the interviewers); showing all portion size options; probing whether the respondent had any leftovers; scenarios for foods not on the list; not skipping over the passes during questioning; allowing time for respondents to recall forgotten foods during the review pass; and ensuring phones and battery packs were fully charged at the start of each day.
Discussion
In the present paper we have described the process and experiences of using a novel smartphone-based tool for collecting and counting repeated 24 h dietary recalls. To our knowledge, the current study is the first to report the use of an Android platform combined with QR codes to enter dietary data, and it is also the first to collect and count repeated 24 h dietary recalls within individuals and within households. We found that smartphones provided a useful tool for collecting dietary recall data. The constraints embedded in the form prevented the entry of implausible values and the quick access to data enabled regular checks on interviewer performance and data quality. Some manual edits to the raw data were required, but this was a small proportion of the total number of food items recorded and could be easily minimised in future by including more constraints and more items on the food list.
Assessment of the plausibility of results by comparing other studies
Our findings that diets were monotonous are consistent with findings from other paper-based dietary studies from Nepal( Reference Henjum, Torheim and Thorne-Lyman 14 ). Energy intakes were generally higher in the current study than in other studies using paper forms to collect data, but gender differences in energy intakes were consistent with other Nepali studies( Reference Sudo, Sekiyama and Maharjan 13 , Reference Gittelsohn, Thapa and Landman 27 ).
Comparing with the median daily energy intake from a study in Bhaktapur, lactating women from Bhaktapur consumed 619 kJ/d (148 kcal/d) less than pregnant women in our study in rural Dhanusha and Mahottari( Reference Henjum, Torheim and Thorne-Lyman 14 ). Although there is 6-year difference in the studies’ survey periods, it is unlikely that pregnant women’s intakes from our rural, poor, socially conservative region were higher than intakes from lactating women in the urban area of Bhaktapur. We conclude that this difference is marginal, and it is likely that these differences are attributable to different interview techniques and measurement error. Sudo et al. ( Reference Sudo, Sekiyama and Maharjan 13 ) also reported 1859 kJ/d lower intakes in their sample of non-pregnant women from rural areas of the Terai (Nawalparasi district) than in our study. Actual differences are less likely in that study, because it was conducted in a rural part of the Terai, but observed differences may be explained by their different study method (FFQ compared with our 24 h recall), different survey season (April v. June to September) and different respondent inclusion criteria.
For men, we found that male household heads (aged 14–37 years) had a median daily energy intake of 12 079 kJ, whereas Gittelsohn( Reference Gittelsohn 28 ) reported a mean intake of 9803 kJ/d for men aged 25–50 years and Sudo et al. ( Reference Sudo, Sekiyama and Maharjan 13 ) reported a median intake of 8723 kJ/d for men aged ≥20 years. Particularly for the Gittelsohn study, we would expect intakes to be higher in our study due to the difference in study year (1987 v. 2015), location (hills v. Terai), the general trend of increasing energy intake per capita over time( Reference Subedi, Marais and Newlands 29 ), and also because we selectively sampled the most senior household members. As with women’s intakes, the difference between our results and Sudo et al. ( Reference Sudo, Sekiyama and Maharjan 13 ) is less likely to be related to major differences in the study population dietary patterns and more likely to be explained by the different measurement methods.
Few studies from Nepal have compared intra-household differences in intakes. Comparing gender differences, Sudo et al. found that men’s intakes were 1603 kJ/d higher than women’s, Gittelsohn found men’s intakes were 542 kJ/d higher, and we found that they were 3100 kJ/d higher than pregnant women and 2920 kJ/d higher than mothers-in-law. These trends are difficult to compare between studies, due to temporal and geographical heterogeneity in household behaviours and norms, but are indicative of a generally consistent trend of gender inequality. The results are also indicative of inequitable intra-household allocation of energy between pregnant women and their mothers-in-law. To our knowledge, this latter relationship has not been assessed quantitatively. Forthcoming work will report on the dietary patterns in this context, accounting for the differential nutritional requirements of different respondents.
These results indicate that the tool gives plausible and consistent results, but that our tool may lead to an overestimate of dietary intakes. More work is needed to validate the tool, by comparing it with other methods of dietary assessment such as weighed food records or doubly labelled water and biomarkers. To fully determine the comparative benefits, feasibility and accuracy of dietary intake methods of electronic v. paper-based forms, a comparative study (randomly allocating respondents to a paper- or electronic-based interview) could be conducted using a ‘gold standard’ reference, for example using biochemical markers. This could then compare the frequency of errors, the costs associated with each, and the accuracy and precision of the two methods. Such comparisons have been made for many studies in Europe and North America, but are lacking from low-income countries such as Nepal( Reference Timon, van den Barg and Blain 6 ).
Key benefits of electronic data capture for dietary intake assessment
Some of the key reported benefits associated with electronic data capture include cost savings (higher fixed costs for start-up compared with paper methods but lower average costs)( Reference Weber, Yarandi and Rowe 30 ) and quicker access to data( Reference Fletcher, Erickson and Toomey 31 ). These are generally consistent with our findings; although we did not conduct a cost analysis, we also faced high initial set-up costs and tool development took longer than anticipated. Studies have reported time savings from using computerised methods( Reference Weber, Yarandi and Rowe 30 ), but without a paper comparator, it is difficult to know if the interviews would have been quicker on paper or smartphone. However, the monotony of diets in this context meant that dietary data could be collected quickly, and the ability to repeat additional servings of the same food type (a feature that was introduced after pilot testing) may have sped up the data entry process. Furthermore, given that most of the time burden for interviewers was in travelling between remote areas, it is unlikely that any time costs or savings would have affected overall productivity in terms of households visited per day.
Most other electronic tools for entry of dietary intake data originate from large-scale dietary intake studies conducted in developed countries that use computers rather than portable tablets. For instance, the US Department of Agriculture uses an Automated Multiple-Pass Method( Reference Moshfegh, Rhodes and Baer 19 ), and the European Prospective Investigation into Cancer and Nutrition uses a standardised computer program, ‘EPIC-SOFT’( Reference Slimani, Deharveng and Charrondière 32 ). Self-administered tools are also not appropriate for illiterate populations( Reference Thompson, Dixit-Joshi and Potischman 33 ). A computerised system was recently developed for use in India, namely the New Interactive Nutrition Assistant–Diet in India Study of Health (NINA-DISH)( Reference Daniel, Kapur and McAdams 34 ), but this requires computers rather than more portable tablets or phones. These bespoke systems for large, national or multi-country studies require high-specification computers with large memory( Reference Caswell, Talegawkar and Dyer 4 ).
Few have reported on low-cost, easily developed tools for smartphones or tablets, required for field studies and resource-poor contexts( Reference Caswell, Talegawkar and Dyer 4 ). One way to reduce costs is to use existing data collection platforms, such as CommCare, that provide simple, user-friendly tools to create and conduct surveys. However, these require careful development to facilitate the collection of dietary data. To our knowledge, only one study has reported on the use of existing data collection platforms, in that case Open Data Kit (ODK), to collect dietary recalls( Reference Caswell, Talegawkar and Dyer 4 ). In contrast, we used CommCare, a platform based on ODK but with additional functions for case management and collecting multiple recalls within a household. Another key difference is that our method used printed food lists with QR codes instead of including the food items within the CommCare form. Indeed, a key strength of our tool is that only minor edits are needed to adapt the smartphone form and logic for use in other contexts, because the main context-specific information (food lists and portion size images) can be developed independently of the CommCare form. As such, it is hoped that this tool can be used and adapted by other researchers, so that set-up costs may be lower for future studies.
Study limitations and future application of the tool for improved dietary assessment
In future, automated visualisation software using segmentation analysis could quantify portion sizes from images( Reference Zhu, Bosch and Woo 35 , Reference Ngo, Engelen and Molag 36 ). Instead of scanning QR codes, future studies could take photographs and estimate portion sizes from photographs. Research is needed to advance the technological capability of image analysis, assess the cultural acceptability of these methods in different contexts, and apply image analysis technologies to South Asian diets. In the meantime, portion size data could simply include more weighed portions, rather than relying exclusively on photographs.
A limitation of the study was that we did not collect individual recipes for each household (instead using average recipes, as described in the ‘Methods’ section) and so this component of the dietary recall has not been programmed into the CommCare form. Since the main aim of the study was to compare relative allocations of food, we used average nutrient composition calculated from pre-collected recipes, but the collection of more recipes could improve the accuracy of the tool. Researchers aiming to estimate nutritional adequacy more precisely, rather than relative allocation, could add another section to the form used in the current study, to collect recipe ingredients and their weights.
Another component that was not included in this tool was a checklist for respondents to document their intakes. Gibson and Ferguson( Reference Gibson and Ferguson 20 ) recommend researchers to provide respondents with an image-based checklist the day before the recall, so respondents can tick the items they consume during the day. These additions would have required each household to be visited for at least three additional days (one per recall), which would have been burdensome on the respondents as well as logistically infeasible given the resources available and the long travel time to reach households.
An unusual approach used in the current study was to ask respondents to recall the portion sizes in the order of the food items (e.g. rice in the morning and then evening), rather than each food in strict chronology. Although the food items were recalled in chronological order during the free recall, the portion sizes were only collected later. This sped up the process (which was especially helpful since there were three respondents per household, so the interview was already long and cumbersome), but it may have been more challenging for respondents recall portions out of the order in which the food items were consumed.
More rigorous qualitative assessment of interviewers’ and respondents’ experiences of using the tool, for example by conducting in-depth interviews and thematic analyses, may identify more issues and opportunities for tool development. Future work by an independent researcher, rather than by line managers and study coordinators, may be required to ensure that interviewers feel comfortable reporting these experiences.
Finally, we hope that this tool will be used, adapted and improved by other researchers, so that dietary intake data collection may become more feasible and nutrition interventions can be more informed and better designed.
Conclusion
Smartphone technology, existing data collection platforms and simple visual portion size aids can be combined to collect detailed dietary intake data from rural households. With sufficient time and effort dedicated to set-up and pre-testing, in addition to the usual intensive process of developing 24 h dietary recall tools, smartphones can provide a useful method for collecting and enabling quick access to data. The main benefits include: no need to translate food items for each respondent, no costs associated with paper data entry systems, ability to detect outliers in intake estimates, and regular, detailed information on interview performance. Challenges, such as lack of electricity, programming bugs and inflexibility introduced by electronic data capture, can be overcome with planning, flexibility in making edits to the data set after data collection, and if interviewers are encouraged to report their mistakes.
Acknowledgements
Acknowledgements: The authors thank Rinku Tiwari, Neha Sharma and Kabita Sah for their help with recipe collection, and the respondents for participating in the study. Financial support: This work was supported by Child Health Research CIO; and the UK Department for International Development (grant number PO 5675). Neither donor had any role in the design, analysis or writing of this article. Conflict of interest: None. Authorship: H.H.-F. prepared the first draft of the manuscript, developed the overall study design and final tools, and conducted all analyses. N.M.S. formulated the research question and provided detailed technical inputs. A.C. provided technical oversight. B.J.B. developed the concept of the smartphone components and supported T.H. to develop the proof-of-concept for this. T.H. led the pilot testing and collection of utensil data with P.P. and H.H.-F. N.S. collected weights of discrete food items. P.P., H.H.-F. and N.S. trained data collectors and P.P. and S.J. managed the data collection. H.H.-F. processed the data and H.H.-F., N.S. and P.P. routinely checked the outputs. D.S.M. and B.S. were project director and project manager, respectively, and were responsible for day-to-day oversight and coordination of field activities. A.C. and N.M.S. are principal investigators of the main trial. All authors read and approved the final manuscript. Ethics of human subject participation: Ethical approval was obtained from the Nepal Health Research Council (108/2012) and the UCL Ethical Review Committee (4198/001). Verbal informed consent was obtained from all subjects. Verbal consent was obtained and formally recorded on paper forms.
Supplementary material
To view supplementary material for this article, please visit https://doi.org/10.1017/S136898001700204X


