


A biomarker is defined as ‘a characteristic that is objectively measured and evaluated as an indicator of normal biological processes, pathogenic processes, or pharmacologic responses to a therapeutic intervention’( 1 ). Biomarkers are used as surrogate end points in clinical trials, disease diagnostic tools or indicators of health status( 1 ). In nutritional epidemiological research related to chronic disease risk, development of an index that explains biomarker variation using dietary factors has been actively studied. For example, prediction models for clinical biochemical measures (such as C-peptide and homocysteine) and biochemical markers of dietary exposure (such as carotenoids and fatty acids) have been developed by including dietary or lifestyle factors as explanatory variables( Reference Tabung, Wang and Fung 2 – Reference Wu, Cho and Giovannucci 5 ). Approaches to derive food combinations that explain as much variation of the chronic disease-related biomarkers as possible also have been implemented( Reference Hoffmann, Zyriax and Boeing 6 – Reference Sluijs, Beulens and van der 8 ). The objectives of those indices are to: (i) reflect the physiological potential of food and its constituents( Reference Tabung, Wang and Fung 2 , Reference Hendrickson, Willett and Rosner 4 ); (ii) develop a surrogate for physiological markers to identify the biological status or the association with the disease among subjects without biomarker measurements( Reference Jung, Je and Giovannucci 3 , Reference Wu, Cho and Giovannucci 5 ); or (iii) provide scientific evidence of the effects of dietary or food patterns on the development of the disease( Reference Hoffmann, Zyriax and Boeing 6 – Reference Sluijs, Beulens and van der 8 ). In the present review, we defined such an index as a ‘diet–biomarker-related index’ if it was mainly derived from dietary factors and examined whether investigators considered sex in the development stage of the index.
Sex analysis may be essential in development of a diet–biomarker-related index, because it is a product that explains variations biological and behavioural characteristics of a target population. Men and women have different biological and physiological characteristics and well-known examples besides sex hormones are body composition( Reference Wells 9 ), lipid profile( Reference Wang, Magkos and Mittendorfer 10 ) and blood pressure( Reference Reckelhoff 11 ). Dietary behaviour is also sex-specific since it is influenced by a complex combination of genetic, physiological, social and cultural factors( Reference Rolls, Fedoroff and Guthrie 12 – Reference Asarian and Geary 14 ). For example, oestrogen and androgen may be related to differences in the physiology of eating between men and women( Reference Asarian and Geary 14 ). Sociocultural and psychological factors contribute to sex differences in eating behaviours such as food preference and selection, the amount of intake and eating style( Reference Rolls, Fedoroff and Guthrie 12 , Reference Arganini, Saba and Comitato 13 ). The ‘Gendered Innovations’, which integrates sex analysis into every process of the research, has been suggested to enhance scientific and technological excellence( Reference Schiebinger and Schraudner 15 ). Thus, governments, research institutes and researchers have been adopting this idea and implementing sex and gender analyses in science, technology, engineering and mathematics. The Canadian Institutes of Health Research and the National Institutes of Health in the USA have begun to promote sex analysis in the funding procedure( 16 , 17 ).
However, we found that sex was not often considered while developing diet–biomarker-related indices. In our review, we classified the diet–biomarker-related indices into the following two types: (i) a biomarker prediction index that includes dietary factors as explanatory variables; and (ii) dietary patterns to explain biomarker variations. We aimed to identify sex considerations in studies that developed a diet–biomarker-related index and to present a systematic review of these studies.
Methods
A systematic review was conducted based on the PRISMA (Preferred Reporting Items for Systematic Reviews and Meta-analyses) Statement( Reference Moher, Liberati and Tetzlaff 18 ). We searched in PubMed and EMBASE databases for articles dated up to 10 March 2018. We limited our search to primary research articles in a peer-reviewed journal and English-language literature.
Search strategy
We searched for literature based on two approaches of developing diet–biomarker-related indices. First, for biomarker prediction indices that include dietary factors as explanatory variables, we searched (‘dietary index’ OR ‘dietary inflammatory index’) AND (‘develop’ OR ‘development’), or (‘dietary’ OR ‘intake’) AND (‘predicted’ OR ‘predictor’ OR ‘prediction’) AND (‘score’ OR ‘model’ OR ‘models’). Second, for dietary patterns, articles were limited to the studies using reduced rank regression (RRR) that extracts a linear combination of the predictors (food groups) to explain as much response variation as possible (biomarker). We also searched for studies that used partial least-squares (PLS) regression that explained most of the variation in both predictors and responses. Other methods that derived dietary patterns without linking with biomarkers, such as principal component analysis and cluster analysis, were not included. Therefore, for dietary patterns, we searched (‘dietary pattern*’ OR ‘food pattern*’ OR ‘eating pattern*’) AND (‘reduced rank regression’ OR ‘RRR’ OR ‘partial least squares’ OR ‘PLS’). More detailed search strategies are given in the online supplementary material, Supplemental Tables 1 and 2.
Study selection
We screened titles and abstracts of the articles and read full texts of potentially eligible articles. Two researchers (S.S. and S.K.) independently assessed the eligibility of articles and discrepancies were resolved by consensus or by involvement of a third author (J.E.L.). We manually identified additional articles from the references of the included articles. We included the studies if investigators developed (i) a biomarker prediction index to calculate predicted biomarker scores using dietary factors or (ii) dietary patterns using biomarkers as response variables.
Data extraction and synthesis
We extracted information on author (publication year), study name, characteristics of study participants (age, sex and sample size), types of biomarkers, dietary assessment tool, methods to develop an index, variables selected as components of the index and sex consideration. Sex consideration in diet–biomarker-related index development was classified into five categories: (i) included only one sex in the study; (ii) derived index separately for each sex; (iii) included sex variable in the development model (sex-adjusted index); (iv) conducted analyses by adjusting for sex or stratifying by sex, but did not include sex in the model or present sex-specific results; and (v) did not consider sex. We qualitatively synthesized the studies according to the sex consideration and presented results by the two types of diet–biomarker-related index (Table 1). We also presented the characteristics of studies that developed a diet–biomarker index in a sex-specific way (Tables 2 and 3).
Table 1 Sex consideration in diet–biomarker-related indices (number of studies)
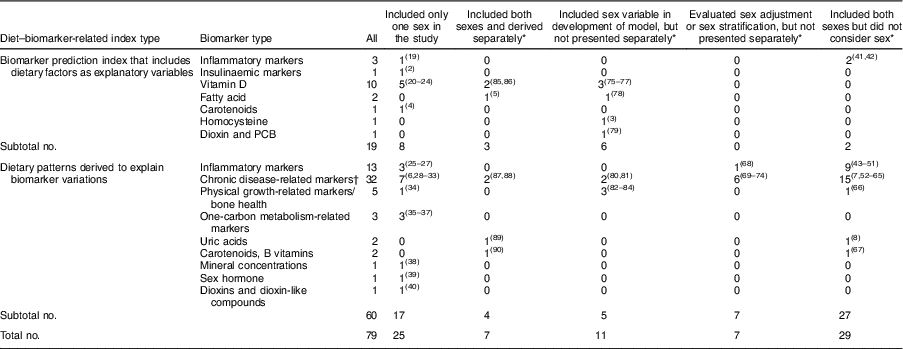
PCB, polychlorinated biphenyls.
* Studies that included both sexes.
† Cholesterol (total, HDL-cholesterol and LDL-cholesterol), TAG, lipoprotein (a), fatty acids, adiponectin, C-reactive protein, Hb A1c, homeostasis model assessment of insulin resistance, insulin-like growth factor-1, insulin-like growth factor binding protein 3, fasting glucose, C-peptide, waist circumference, BMI, systolic blood pressure, diastolic blood pressure and serum metabolites.
Table 2 Summary of studies on sex-specific biomarker prediction indices that included dietary factors as explanatory variables
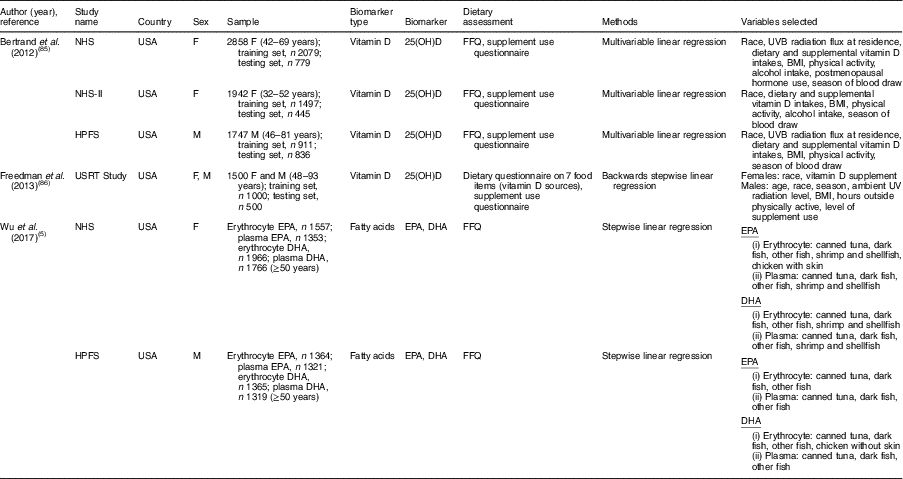
NHS, Nurses’ Health Study; HPFS, Health Professionals Follow-up Study; USRT, US Radiologic Technologists; F, female; M, male; 25(OH)D, 25-hydroxyvitamin D.
Table 3 Summary of studies on sex-specific dietary patterns to explain biomarker variations
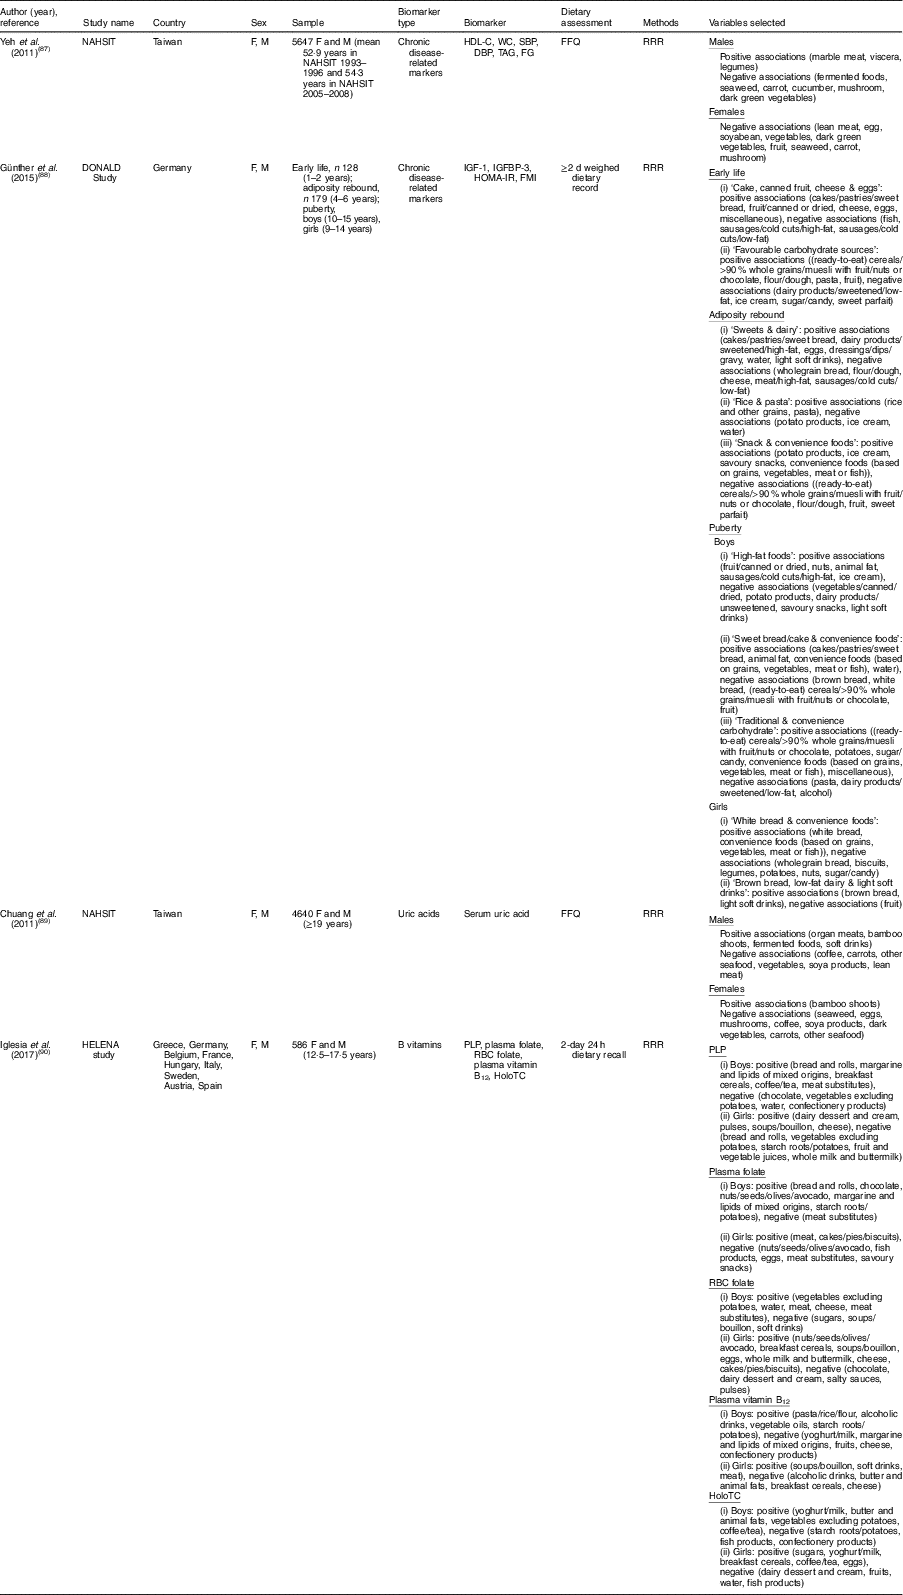
NAHSIT, Nutrition and Health Survey in Taiwan; DONALD, Dortmund Nutritional and Anthropometric Longitudinally Designed; HELENA, Healthy Lifestyle in Europe by Nutrition in Adolescence; F, female; M, male; HDL-C, HDL-cholesterol; WC, waist circumference; SBP, systolic blood pressure; DBP, diastolic blood pressure; IGF-1, insulin-like growth factor-1; IGFBP-3, insulin-like growth factor binding protein-3; HOMA-IR, homoeostasis model assessment for insulin resistance; FMI, fat-mass index; PLP, pyridoxal 5′-phosphate; RBC, red blood cell; HoloTC, holotranscobalamin; RRR, reduced rank regression.
Results
The flow of identification and inclusion of relevant studies are described in Fig. 1. We identified a total of 2897 articles from the database search. Among these, sixty-eight articles met the inclusion criteria, and we additionally found eleven articles by citation and hand search. Finally, a total of seventy-nine studies were included in the current review: (i) biomarker prediction indices that include dietary factors as explanatory variables (n 19); and (ii) dietary patterns derived to explain biomarker variations (n 60). The consideration of sex in the derivation of diet–biomarker-related indices is shown in Table 1. Among total studies, twenty-five studies (31·6 %) included only one sex( Reference Tabung, Wang and Fung 2 , Reference Hendrickson, Willett and Rosner 4 , Reference Hoffmann, Zyriax and Boeing 6 , Reference Tabung, Smith-Warner and Chavarro 19 – Reference Papadopoulou, Kogevinas and Botsivali 40 ) and fifty-four studies (68·4 %) included both men and women. Of the fifty-four studies that included both men and women, 53·7 % (n 29) did not consider sex in the index development procedure( Reference Imamura, Lichtenstein and Dallal 7 , Reference Sluijs, Beulens and van der 8 , Reference Cavicchia, Steck and Hurley 41 – Reference Kesse-Guyot, Andreeva and Ducros 67 ); 13·0 % (n 7) conducted analyses by adjusting for sex or stratifying by sex, but did not include sex in the model or present sex-specific results( Reference Gu, Manly and Mayeux 68 – Reference Jacobs, Kroeger and Schulze 74 ); 20·3 % (n 11) included sex variable in the development model (sex-adjusted index)( Reference Jung, Je and Giovannucci 3 , Reference Chan, Jaceldo-Siegl and Fraser 75 – Reference de Jonge and Kiefte-de Jong 84 ); and 13·0 % (n 7) derived a diet–biomarker-related index for men and women separately( Reference Wu, Cho and Giovannucci 5 , Reference Bertrand, Giovannucci and Liu 85 – Reference Iglesia, Huybrechts and Mouratidou 90 ).
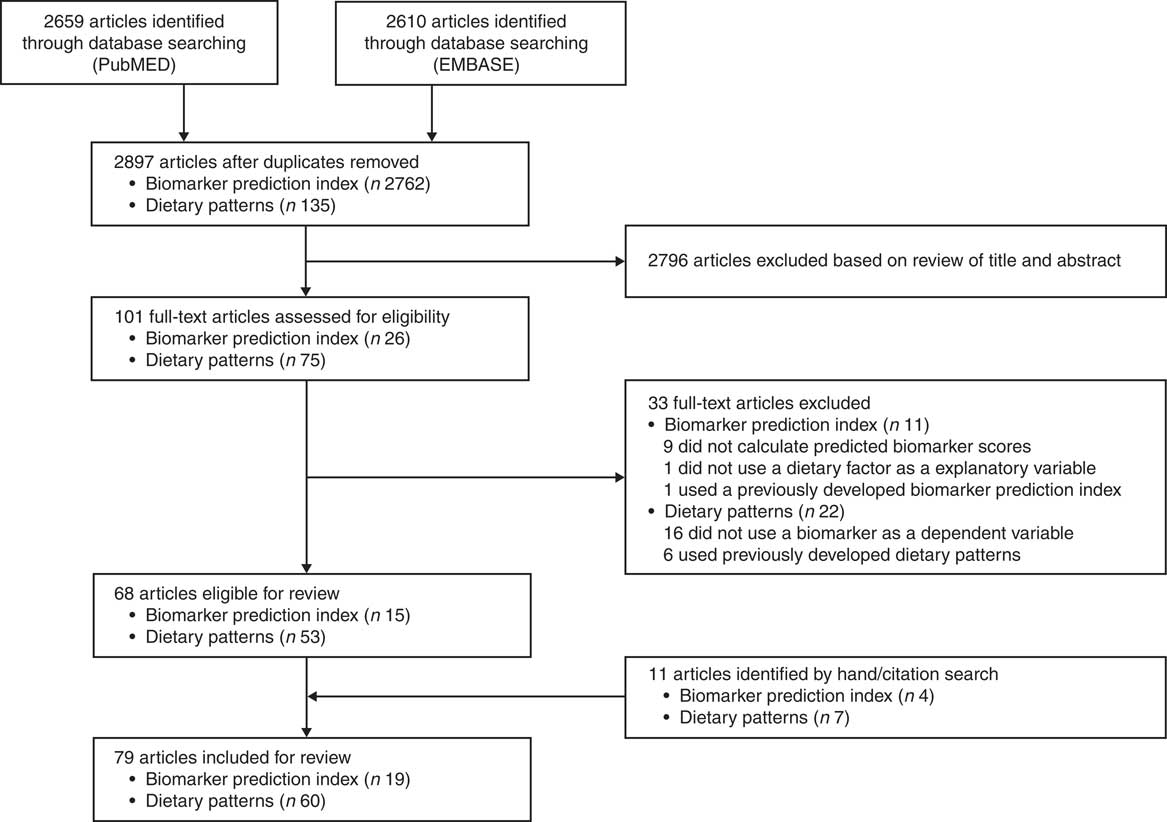
Fig. 1 Flow diagram of studies included in the present review on sex consideration in diet–biomarker-related indices
Sex consideration in biomarker prediction indices
Among nineteen studies that developed a biomarker prediction model that included dietary factors as explanatory variables, eleven studies (57·9 %) included both men and women (Table 1). Of these eleven studies that included both men and women, two studies (18·2 %) did not consider sex in the index development procedure( Reference Cavicchia, Steck and Hurley 41 , Reference Shivappa, Steck and Hurley 42 ), six studies (54·5 %) included sex variable in the model( Reference Jung, Je and Giovannucci 3 , Reference Chan, Jaceldo-Siegl and Fraser 75 – Reference Kvalem, Brantsaeter and Meltzer 79 ) and three studies (27·3 %) developed prediction models for men and women separately( Reference Wu, Cho and Giovannucci 5 , Reference Bertrand, Giovannucci and Liu 85 , Reference Freedman, Cahoon and Rajaraman 86 ). The detailed study information on biomarker prediction indices is described in the online supplementary material, Supplemental Table 3.
Two studies described the development of a dietary inflammatory index (DII) based on a literature review of studies that examined the association between diet and inflammatory markers in human, animal and cell models; however, sex of the study subjects was not considered( Reference Cavicchia, Steck and Hurley 41 , Reference Shivappa, Steck and Hurley 42 ). Although validation studies showed significant associations between DII and inflammatory biomarkers( Reference Cavicchia, Steck and Hurley 41 , Reference Shivappa, Steck and Hurley 91 ), the components or effects of sex-specific DII were not identified because the index was developed without considering the sex difference. Tabung et al. ( Reference Tabung, Wang and Fung 2 , Reference Tabung, Smith-Warner and Chavarro 19 ) developed an inflammatory or insulinaemic-derived dietary index using empirical methods in a female cohort (Nurses’ Health Study (NHS)) and examined validity of the index in independent male (Health Professionals Follow-up Study (HPFS)) and female cohorts (NHS-II). An empirical dietary inflammatory index (EDII) was derived from the food groups to explain the variation of inflammatory markers using RRR and stepwise linear regression in the NHS( Reference Tabung, Smith-Warner and Chavarro 19 ). Empirical dietary and lifestyle indices for hyperinsulinaemia or for insulin were developed by using stepwise multivariable-adjusted linear regression analyses( Reference Tabung, Wang and Fung 2 ). In validation analyses, the relative concentrations of biomarkers in relation to dietary indices were generally higher in women than men( Reference Tabung, Wang and Fung 2 , Reference Tabung, Smith-Warner and Chavarro 19 ).
Ten studies developed a prediction model for circulating 25-hydroxyvitamin D using dietary and non-dietary factors( Reference Giovannucci, Liu and Rimm 20 – Reference Palmer, Gerlovin and Bethea 24 , Reference Chan, Jaceldo-Siegl and Fraser 75 – Reference Kuhn, Kaaks and Teucher 77 , Reference Bertrand, Giovannucci and Liu 85 , Reference Freedman, Cahoon and Rajaraman 86 ). Among vitamin D prediction studies, five studies developed the model in only one sex( Reference Giovannucci, Liu and Rimm 20 – Reference Palmer, Gerlovin and Bethea 24 ), two studies developed models in men and women separately( Reference Bertrand, Giovannucci and Liu 85 , Reference Freedman, Cahoon and Rajaraman 86 ), and three studies included sex variable in the prediction model( Reference Chan, Jaceldo-Siegl and Fraser 75 – Reference Kuhn, Kaaks and Teucher 77 ). Overall dietary( Reference Giovannucci, Liu and Rimm 20 – Reference Palmer, Gerlovin and Bethea 24 , Reference Chan, Jaceldo-Siegl and Fraser 75 , Reference Liu, Meigs and Pittas 76 , Reference Bertrand, Giovannucci and Liu 85 ) or supplemental vitamin D( Reference Giovannucci, Liu and Rimm 20 , Reference Millen, Wactawski-Wende and Pettinger 21 , Reference Bjorn Jensen, Thorne-Lyman and Vadgard Hansen 23 , Reference Palmer, Gerlovin and Bethea 24 , Reference Chan, Jaceldo-Siegl and Fraser 75 – Reference Kuhn, Kaaks and Teucher 77 , Reference Bertrand, Giovannucci and Liu 85 , Reference Freedman, Cahoon and Rajaraman 86 ) intakes were significant dietary factors that were used as predictors of vitamin D scores, regardless of sex consideration. Alcohol intake was also found as a significant predictor of vitamin D scores in several studies that included only one sex (male( Reference Gilbert, Martin and Fraser 22 ) and female( Reference Palmer, Gerlovin and Bethea 24 )) or both sexes( Reference Kuhn, Kaaks and Teucher 77 , Reference Bertrand, Giovannucci and Liu 85 ). In a prediction model developed in men and women separately, alcohol intake was a significant predictor of vitamin D scores in women but not in men( Reference Bertrand, Giovannucci and Liu 85 ) (Table 2).
Two studies developed a fatty acid prediction model( Reference Wu, Cho and Giovannucci 5 , Reference Hallmann, Kolossa and Gedrich 78 ). Wu et al. ( Reference Wu, Cho and Giovannucci 5 ) developed an erythrocyte and plasma EPA and DHA prediction model by including dietary factors as explanatory variables in men and women separately (Table 2). Canned tuna, dark fish and other fish were significant predictors of erythrocyte and plasma EPA and DHA scores in both sexes. However, shrimp and shellfish was a significant predictor only for women in terms of erythrocyte and plasma EPA and DHA scores. Also, chicken with skin was a significant predictor for erythrocyte EPA scores in women, whereas chicken without skin was a significant predictor for erythrocyte DHA scores in men. In the Food4Me study that included sex in the PUFA prediction model, fish and chicken were also found to be significant predictors of the fatty acid profiles, but sex-specific results were not presented( Reference Hallmann, Kolossa and Gedrich 78 ).
Prediction models for polychlorinated dibenzo-p-dioxins/furans (dioxins) and polychlorinated biphenyls were developed and validated in a combined population of men and women( Reference Kvalem, Brantsaeter and Meltzer 79 ). Dietary intakes of dioxin and energy were significant dietary predictors, and sex variable was included in the prediction models. The interaction terms of sex with other covariates were also added to the models. Predicted dioxins and polychlorinated biphenyls were highly correlated with serum levels, but more strongly associated among women than men.
In a homocysteine prediction model, multivitamin use, caffeine, alcohol, dietary folate intake and supplemental folate intake were included to derive the homocysteine score in the men and women combined population (NHS and HPFS), and sex was adjusted in the development model( Reference Jung, Je and Giovannucci 3 ). Prediction model for carotenoids was developed in the female cohort study (NHS), and three to twelve food items were selected as predictors of five types of carotenoids and total carotenoids( Reference Hendrickson, Willett and Rosner 4 ).
Sex consideration in the dietary patterns
Among sixty articles that developed dietary patterns related to biomarkers, forty-three studies included both men and women. Among forty-three studies that included both men and women, twenty-seven (62·8 %) did not consider sex( Reference Imamura, Lichtenstein and Dallal 7 , Reference Sluijs, Beulens and van der 8 , Reference Heidemann, Hoffmann and Spranger 43 – Reference Kesse-Guyot, Andreeva and Ducros 67 ). Five studies (11·6 % of forty-three articles) derived sex-adjusted dietary patterns( Reference Floegel, Von Ruesten and Drogan 80 – Reference de Jonge and Kiefte-de Jong 84 ). Seven studies (16·3 % of forty-three articles) evaluated sex-adjusted( Reference Gu, Manly and Mayeux 68 , Reference McNaughton, Mishra and Brunner 70 – Reference Dekker, van Dam and Snijder 72 ) or sex-specific dietary patterns( Reference DiBello, Kraft and McGarvey 69 , Reference Sauvageot, Leite and Alkerwi 73 , Reference Jacobs, Kroeger and Schulze 74 ), but did not present the results. Only four out of forty-three studies (9·3 %) derived dietary patterns for men and women separately( Reference Yeh, Chang and Pan 87 – Reference Iglesia, Huybrechts and Mouratidou 90 ). Detailed study information on dietary patterns to explain variation of biomarkers is described in the online supplementary material, Supplemental Table 4.
Four studies that derived dietary patterns for men and women separately showed different combinations of food groups by sex( Reference Yeh, Chang and Pan 87 – Reference Iglesia, Huybrechts and Mouratidou 90 ) (Table 3). Using data from the Nutrition and Health Survey in Taiwan (NAHSIT) 1993–1996 and 2005–2008, two studies analysed dietary patterns associated with hyperuricaemia( Reference Chuang, Lee and Hsieh 89 ) and metabolic syndrome( Reference Yeh, Chang and Pan 87 ) in a sex-specific way. In both studies( Reference Yeh, Chang and Pan 87 , Reference Chuang, Lee and Hsieh 89 ), although some food groups were shared in common in the dietary patterns of men and women, several food groups were sex-specific. For uric acid-related dietary patterns, serum uric acid levels were positively associated with fermented foods intake in men only and inversely associated with egg and seaweed intakes in women only( Reference Chuang, Lee and Hsieh 89 ). In dietary patterns related to metabolic syndrome markers, marble meat, viscera and legumes appeared to be positively associated with metabolic syndrome markers only in men( Reference Yeh, Chang and Pan 87 ). Günther et al. ( Reference Günther, Schulze and Kroke 88 ) derived dietary patterns at puberty to explain variation of body fatness and insulin sensitivity or resistance biomarkers in young adulthood. In that study, boys and girls showed different dietary patterns as follows: ‘high-fat foods’, ‘sweet bread/cake & convenience foods’, ‘traditional & convenience carbohydrate’ for boys and ‘white bread & convenience foods’ and ‘brown bread, low-fat dairy & light soft drinks’ for girls. The Healthy Lifestyle in Europe by Nutrition in Adolescence (HELENA) study derived dietary patterns that explained the variance of blood B-vitamin levels among adolescents, observing sex differences in food combinations and even opposite direction of the association; in vitamin B12-related dietary patterns, alcoholic drinks showed a positive association for boys and an inverse association for girls( Reference Iglesia, Huybrechts and Mouratidou 90 ).
When we reviewed studies that included only one sex, we observed that several dietary components from the RRR procedure were associated with biomarkers differently in men and women. Factor loading values of wine drinking in relation to CVD-related or inflammatory markers were positive( Reference Jankovic, Steppel and Kampman 29 ) or inappreciable( Reference Meyer, Doring and Herder 26 ) in men, inverse in women( Reference Hoffmann, Zyriax and Boeing 6 , Reference Schulze, Hoffmann and Manson 25 , Reference Lucas, Chocano-Bedoya and Schulze 27 ). Coffee consumption, one food component in the dietary patterns identified through the RRR procedure, was inversely associated with inflammatory markers in women( Reference Schulze, Hoffmann and Manson 25 , Reference Lucas, Chocano-Bedoya and Schulze 27 ) but not in men( Reference Meyer, Doring and Herder 26 ).
Discussion
Nutritional epidemiological studies have examined the physiological potential of dietary factors and developed diet–biomarker-related indices such as biomarker prediction models and dietary patterns to explain biomarker variation. Although sex is an important factor of biomarker levels and dietary behaviour, sex consideration in the development of diet–biomarker-related indices is not well appreciated. In the current systematic review, we identified the sex consideration in the development procedure of diet–biomarker-related indices. Among seventy-nine studies identified, 68·4 % of studies derived diet–biomarker-related indices in both men and women. Of these, only 13·0 % of studies derived diet–biomarker-related indices for men and women separately, and some studies adjusted for sex in the development model, but did not present sex-specific results (20·3 %), or conducted analyses by adjusting for sex or stratifying by sex, but did not include sex in the model or present sex-specific results (13·0 %). Among studies that included both men and women, over half of the studies (53·7 %) did not consider sex variable (neither stratification by sex nor adjustment for sex) when they developed a diet–biomarker-related index.
The objective of a diet–biomarker-related index is to reflect the biomarker levels of dietary factors, to be used as a surrogate for the biomarker, or to provide evidence for the effects of dietary patterns on disease development. Genetic attributes and sex steroid hormones contribute to the physiological differences between men and women( Reference Arain, Kuniyoshi and Abdalrhim 92 ). The sexual dimorphism of body composition is a well-known difference( Reference Wells 9 ) and the physiological function of organ systems, such as the cardiovascular or respiratory system, is also different between men and women( Reference Legato and Bilezikian 93 , Reference Blair 94 ). Dietary behaviour encompasses genetic, physiological, social and cultural elements( Reference Arganini, Saba and Comitato 13 ) and is different between men and women. Therefore, it is important to distinguish the findings by sex and present sex-specific results.
Sex differences in diet–biomarker-related indices support the importance of sex-specific analysis in development of the index. We found that only a few studies developed a diet–biomarker-related index in men and women separately, and variables selected as components that explained biomarkers differed by sex( Reference Wu, Cho and Giovannucci 5 , Reference Bertrand, Giovannucci and Liu 85 , Reference Yeh, Chang and Pan 87 – Reference Iglesia, Huybrechts and Mouratidou 90 ). These studies derived dietary patterns or developed a prediction model based on chronic disease-related or nutrient-specific biomarkers, including hyperuricaemia( Reference Chuang, Lee and Hsieh 89 ), metabolic syndrome( Reference Yeh, Chang and Pan 87 ), combination of insulin-like growth factor, insulin resistance and body fatness( Reference Günther, Schulze and Kroke 88 ), B vitamins( Reference Iglesia, Huybrechts and Mouratidou 90 ), vitamin D( Reference Bertrand, Giovannucci and Liu 85 ), and EPA and DHA levels( Reference Wu, Cho and Giovannucci 5 ).
Some studies validated their diet–biomarker-related index in a different sex. For example, the DII was developed in men and women combined, and a validation study was conducted among postmenopausal women( Reference Tabung, Steck and Zhang 95 ). However, a significant correlation between the index and actually measured biomarkers in the validation study does not necessarily mean that the prediction index captured the variation of physiological biomarkers at the optimal level in men and women separately. Identification of components that appear to be predictive of physiological biomarkers in nutritional epidemiological studies helps us understand modifiable factors that lower the risk of chronic diseases and provide a basis for dietary and lifestyle guidelines for a healthy life. However, the importance of sex-specific factors that increase or decrease the risk of diseases can be diluted by aggregating men and women together, which may hamper the adequate development of dietary and lifestyle guidelines for disease prevention. For example, food groups that lower or increase inflammation risk could be different between men and women; therefore, uniform guidelines for inflammation prevention may be problematic. Furthermore, when we want to select foods related to biomarkers, we may need to reduce variation due to sex to avoid any spurious relationship explained by sex difference in levels of food intake and biomarkers. Inclusion of one sex may be most ideal. Also, it may be natural to consider biological and behavioural differences by sex in the interpretation, presentation and generalizability of research findings. The proper understanding of modifiable factors related to physiological biomarkers is critical to improve the health outcomes of men and women.
The current systematic review has some limitations. First, we could not quantitatively compare the prediction levels of the indices according to the sex consideration, but qualitatively reviewed whether each index was developed in a sex-specific way. Second, we did not assess the accuracy and reliability of the measurements of biomarker, diet and other covariates, which may differ by sex and determine the quality of the index. Lastly, our search of diet–biomarker-related indices was limited to indices from empirically or literature-derived prediction models or pattern analysis of the variation of biomarkers. We did not include principal component analysis that did not account for biochemical markers upon the index development.
Conclusion
In conclusion, we found that most studies on diet–biomarker-related indices did not develop indices or report their results in a sex-specific way. In the studies with sex-specific analysis, selected dietary factors to explain the variation of biomarkers differed by sex. Our review may suggest an important index component could be masked by mixing the effects in the combined men and women analysis. Our review warrants further prospective investigation on whether sex consideration in the development of diet–biomarker-related indices improves the research quality and their prediction potential for disease risk.
Acknowledgements
Financial support: This research was supported by the Support Program for Women in Science, Engineering and Technology through the National Research Foundation of Korea (NRF) funded by the Ministry of Science and ICT (grant number 2016H1C3A1903202). NRF and the Ministry of Science and ICT had no role in the design, analysis or writing of this article. Conflict of interest: There are no conflicts of interest. Authorship: S.S. and S.K. contributed to the assessment of the eligibility of articles and S.S. drafted the manuscript. J.E.L. contributed to the conception and design of the review and manuscript drafting. All authors have read and approved the final manuscript. Ethics of human subject participation: Not applicable.
Supplementary material
To view supplementary material for this article, please visit https://doi.org/10.1017/S1368980018001490


