


In recent decades, Brazil has seen increased consumption of ultra-processed foods( Reference Martins, Levy and Claro 1 ). The contribution of fruits and vegetables (FV) to total household expenditure is almost two times greater in urban areas than in rural areas, yet remains substantially below national and international recommendations( Reference Levy, Claro and Mondini 2 ). In contrast, sugar-sweetened beverages (SSB; i.e. soda, fruit-flavoured drinks and other beverages with added sugar) are the largest source of beverage calories and an important contributor of energy in the Brazilian diet( Reference Levy, Claro and Mondini 2 , Reference Duffey, Pereira and Popkin 3 ).
While people’s dietary patterns may depend in part on a host of individual factors( Reference Booth, Sallis and Ritenbaugh 4 ), leading academics in the fields of public health nutrition and epidemiology increasingly emphasize the importance of local environments in shaping individuals’ dietary behaviours( Reference Diez-Roux, Nieto and Caulfield 5 ). Food availability( Reference Franco, Diez-Roux and Nettleton 6 ), accessibility of retail food stores( Reference Smith, Cummins and Taylor 7 , Reference Fuller, Cummins and Matthews 8 ), overall grocery quality( Reference Cummins, Smith and Taylor 9 ) and price( Reference Claro, Levy and Popkin 10 ) may influence whether individuals have predominantly healthy or unhealthy dietary patterns.
Despite the evidence available for the USA( Reference Franco, Diez-Roux and Nettleton 6 , Reference Zenk, Lachance and Schulz 11 , Reference Caspi, Kawachi and Subramanian 12 ), Australia( Reference Thornton, Crawford and Ball 13 ) and Europe( Reference Fuller, Cummins and Matthews 8 , Reference Cummins, Smith and Taylor 9 ) regarding the effects of the local food environment on diet, the field is relatively new in low- or middle-income countries( Reference Mendes, Nogueira and Padez 14 – Reference Vedovato, Trude and Kharmats 17 ). The unique contribution of our study relies in exploring the role of the urban retail food environment on healthy and unhealthy eating in a rapidly changing, yet understudied, urban and unequal setting in Latin America( Reference Chiavegatto Filho, Lebrao and Kawachi 18 ).
Testing whether differential access, including context-specific( Reference Cummins and Macintyre 19 ) spatial and economic aspects, to food has an impact on diet in São Paulo and how characteristics of the food environment predict dietary behaviours can contribute to the understanding of how heath inequalities occur in the city. This may support more effective local policy making. We examined the relationship between aspects of the local food environment, including measures of the consumer and community food environments, and the consumption of FV and SSB in a large Brazilian city. We also tested whether neighbourhood- and individual-level income moderated the associations between FV and SSB intake and measures of the local food environment in São Paulo, Brazil.
Methods
Study design and setting
The study used a cross-sectional design and drew upon two data sources from São Paulo: (i) individual-level data information and (ii) an in-person supermarket and fresh produce market audit.
The largest and most populous Brazilian city, São Paulo is located in the Southeast region of the country and is home to almost 12 million people( 20 ). The city has ninety-six districts, defined on a geographic and administrative basis by the São Paulo city council; these are further divided into census tracts. In the 2010 Brazilian Census, São Paulo was divided into 18 952 census tracts with each tract comprising about 600–700 residents( 20 ).
For the present study, we selected census tracts using a strategy that ensured representation of socio-economic and food environment diversity in the sample. Previous studies have used similar methods( Reference Glanz, Sallis and Saelens 21 , Reference Ball, Timperio and Crawford 22 ). The final area included in the study was 5·09 km2, comprising fifty-two tracts, located in thirteen different districts in the city( 20 ). A detailed outline of the district sampling methodology is published elsewhere( Reference Duran, Roux and Latore 23 ).
After the ground truthing process had been completed, trained raters visited all streets in the study census tracts from November 2010 to February 2011. Raters were able to access all available chain and non-chain supermarkets, small/independently owned grocery stores, corner stores and fresh food markets in the sampled tracts except for one chain supermarket and one small grocery store, for which auditing permission was not given by the store manager/owner. Finally 298 retail food stores, seven specialized fresh produce indoor markets and eight weekly street fresh produce markets were included in the study.
The second data source aggregated information from adults (20–59 years) living in the same thirteen districts as those where we collected neighbourhood-level data. An age- and sex-stratified sample of 2000 adults was obtained from April to May 2011, considering the actual distribution of each district’s resident population with regard to sex and age according to the 2000 Brazilian Census( 24 ). Of the 2000 participants, home addresses were geocoded for 1842 who lived in the same set of census tracts as those for which stores were audited. The 158 participants whose addresses could not be geocoded due to inconsistencies in the information collected on home addresses or because they lived outside the set of census tracts in which we collected food environment measures were excluded from the analysis. They did not differ significantly from the final sample in terms of age, education, income, sex or dietary patterns.
Outcome assessment
The dependent variables, derived from the individual-level data source collected in 2011, were consumption of FV (≥5 d/week) and SSB (≥5 d/week). They were measured using an interviewer-administered, previously validated tool( Reference Monteiro, Moura and Jaime 25 ), applied annually as part of an ongoing population-based telephone survey surveillance system that has been implemented in all Brazilian State capitals since 2006 (VIGITEL)( Reference Moura, Malta and de Morais Neto 26 ). Participants were asked the following questions: ‘How many days a week do you usually eat fruit?’, How many days a week do you usually drink 100 % or freshly squeezed fruit juices?’, ‘How many days a week do you usually eat raw salad vegetables, such as lettuce and tomatoes?’ and ‘How many days a week do you usually eat cooked greens and vegetables, such as kale, carrots, eggplant or zucchini, but excluding potato or manioc (cassava)?’ The measure of regular consumption of FV (≥5 d/week) was created by adding the responses to all the above questions. We chose a previously used indicator for regular consumption of FV (≥5 d/week), rather than a measure for recommended consumption of FV, based on previous surveys conducted in Brazil that showed consumption of FV below the recommended levels in the country( Reference Iser, Claro and de Moura 27 ). In order to measure SSB consumption, participants were asked the following question: ‘How many days a week do you usually drink soda, fruit-flavoured drinks or sugary juices/nectars?’
Neighbourhood-level measures
Neighbourhood-level measures included measures of median neighbourhood income in the census tract from the 2010 Brazilian Census( 20 ) in tertiles and measures for the community and consumer food environments as described by Glanz et al.( Reference Glanz, Sallis and Saelens 28 ).
Community food environment
Community food environment measures included density of, and proximity to, supermarkets and fresh produce markets (weekly street specialized markets that sell fresh produce and a limited assortment of other foods such as meats and fish, and specialized fresh produce indoor markets). For community food environment measures, we decided to exclude small/independently owned grocery stores and corner stores because they were found to have a low availability of healthy foods such as FV in São Paulo( Reference Duran, Roux and Latore 23 ).
Proximity was measured using the Euclidean distance to each participant’s home location. Density of supermarkets and fresh produce markets was measured using a 1·6-km (1-mile) Euclidean buffer around participants’ homes. ArcGIS version 10·1 (ESRI, Redlands, CA, USA) was used to geocode respondents’ homes and food stores by their postal code and street address. We chose to draw the buffers around the individual homes, as they are more precise than spatial unit centroids (census tract centroids in our case). The 1·6-km buffer was chosen based on the literature and is considered a reasonable walking distance for food shopping( Reference Franco, Diez-Roux and Nettleton 6 , Reference Yang, Diez Roux and Auchincloss 29 ).
Consumer food environment
Consumer environment measures included availability, price, quality and variety of fresh FV and SSB. All retail food stores (supermarkets, corner stores and small grocery stores) and fresh produce markets were systematically assessed using a reliable tool adapted to the Brazilian context (ESAO-s)( Reference Duran, Roux and Latore 23 ). We averaged the measures across the chosen home local food environment within a 1·6-km buffer around participants’ homes.
As weekly street fresh produce specialized markets usually hold more than one food stall for a given fruit or vegetable, raters were trained to evaluate the availability, variety, pricing and quality of the selected FV in the first stall they found when entering the market. After rating all items, raters left the market and entered it from the other end to repeat ratings. An average measure of ratings was analysed.
FV availability (binary) was defined as the availability of any fresh fruit or vegetable. Canned or frozen fruits and vegetables were not considered for FV availability, price or quality in our study. Standardized mean FV price was defined as the mean cost of the four most frequently purchased fruits (oranges, bananas, papaya and apples) and vegetables (tomatoes, onions, carrots and lettuce) in the São Paulo Metropolitan Area( 30 ). Price was based on the posted price per kilogram. When only the unit price was available, raters weighed three random units, averaged the values and calculated the price per kilogram.
FV quality and variety were measured as: (i) the presence of at least one store that sold fresh produce that was in the upper quartile for the specific characteristic; (ii) the presence of at least one store that sold fresh produce but no store in the upper quartile for the characteristic; and (iii) no store that sold fresh produce. Quality was assessed on the cheapest variety found of a given fruit or vegetable. The quality indicator for fresh produce was given a subjective acceptable/unacceptable rating, depending on whether 75 % of the produce was bruised, old looking, overripe or spotted. Variety was measured as the number of different types of FV within each kind (e.g. green apple, gala apple). FV variety was excluded from the final models due to high collinearity with FV availability.
In-store SSB measures were collected during the store audits and included variety and price. SSB variety was classified as below or above the median number of different brands and flavours of soda, fruit-flavoured drinks and juices/nectars with added sugar. SSB price was generated as an index price considering the actual contribution of each one of the three measured SSB (soda, juices/nectars with added sugars, fruit-flavoured drinks) to the total SSB household budget share in the São Paulo Metropolitan Area in 2008/2009, measured by the Brazilian Household Budget Survey( 30 ). SSB were available in all participant-defined neighbourhoods; hence SSB availability was not included in the model.
Individual-level measures
Individual sociodemographic variables included sex, age (20–29 years; 30–39 years; 40–49 years), monthly household income (≤5 MW and >5 MW, where MW=monthly Brazilian minimum wage) and education (less than high school; high school; some college). As of March 2011, the Brazilian national monthly minimum wage was R$ 545, which was equivalent to $US 328 at the time.
Statistical analyses
We first described FV and SSB consumption by each one of the individual-level variables using percentages and confidence intervals. Neighbourhood-level variables were presented in median and interquartile ranges. In a second set of analyses, Poisson generalized estimating equations (GEE) were used to model the associations of FV and SSB consumption with local food environment measures, adjusted by individual-level characteristics. GEE, also known as marginal models, were more appropriate for our analyses due to our interest in estimating the overall relationship between the local food environment and diet, or the population average effect, over and above the individual specific effects( Reference Hubbard, Ahern and Fleischer 31 ). All GEE models were fitted assuming an exchangeable correlation matrix to better account for the aggregation of the data and using robust estimates of standard errors. Poisson regressions with robust estimates of standard errors are a better alternative for the analysis of cross-sectional studies with binary outcomes than logistic regression, especially when the outcome prevalence is high( Reference Barros and Hirakata 32 ). In addition, prevalence ratios are more interpretable and easier to communicate to non-specialists than odds ratios( Reference Barros and Hirakata 32 ).
Consumer food environment measures and density of supermarkets and fresh produce markets were generated for each individual’s address using 1·6-km buffers around the participants’ homes. The models were estimated with census tracts as a clustering variable to account for intercorrelations that are expected to exist among individuals. First, we estimated crude models in which each consumer or community food environment was associated with FV and SSB consumption separately but adjusted by individual-level variables. Then, fully adjusted models were estimated and included community and consumer food environment measures, individual-level variables and neighbourhood median income.
Consistent with prior work( Reference Boone-Heinonen, Diez-Roux and Goff 33 ), we used the natural-log transformation of supermarkets and fresh produce market density to linearize the relationships and reduce the influence of right-skewed resource counts on model estimates.
We also tested whether neighbourhood-level median household income and individual-level income moderated associations of food consumption and measures of the local food environment. We plotted predicted margins for different levels of supermarket and fresh produce market density associated with FV consumption in neighbourhoods of different income levels using Stata MARGINS and MARGINSPLOT commands.
Analyses were performed in 2013–2014 using the statistical software package Stata version 13·1.
Results
The average age of participants was 36·5 (sd 11·0) years and 53 % were female. Three-quarters of the sample reported a monthly household income below or equal to R$ 2725 ($US 1642). Table 1 shows FV and SSB consumption by individual- and neighbourhood-level characteristics. Thirty-eight per cent of the participants reported eating FV on five or more days per week, and 40 % reported drinking SSB on five or more days per week. FV consumption was significantly more common among women, older individuals, better educated and wealthier participants. Younger and less educated participants were more likely to consume SSB on five or more days per week. Forty-two per cent of our sample reported buying FV in fresh produce markets, although we did not observe any differences in FV consumption when the type of chosen store or market was compared, so we decided not to include this variable in the fully adjusted models.
Table 1 Regular fruit and vegetable (FV) and sugar-sweetened beverage (SSB) consumption by characteristics of the study population, São Paulo, Brazil, 2011

MW, minimum wage.
* As of March 2011, Brazilian national monthly minimum wage=R$ 545 ($US 328).
† Only participants who reported buying FV in their neighbourhood were asked where they primarily bought FV.
Table 2 shows neighbourhood-level measures across the fifty-two assessed tracts. Two census tracts (3·8 %) of the fifty-two sampled tracts had no stores or markets. Fifty-eight per cent of the respondents did not have a supermarket that fell within the tract where they lived.
Table 2 Neighbourhood-level variables, São Paulo, Brazil, 2011

IQR, interquartile range; SSB, sugar-sweetened beverages; FV, fruits and vegetables.
* Source: 2010 Brazilian Census( 20 ).
† As of March 2011, $US 1·00=R$ 1·66.
‡ Logarithmic distribution.
§ Percentage of stores/markets in each census tract averaged across the 1·6-km buffer around participants’ homes.
Community food environment
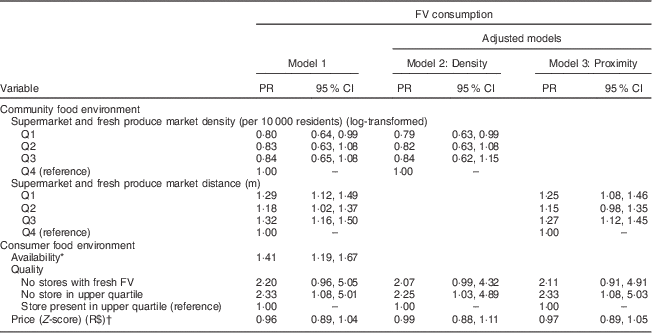
Associations of FV and SSB consumption and neighbourhood-level variables adjusted for individual characteristics are shown in Table 3 and Table 4, respectively. Low density (quartile 1) of supermarkets and fresh produce markets was associated with 21 % lower FV consumption in the fully adjusted model.
Table 3 Associations of neighbourhood-level variables and regular fruit and vegetable (FV) consumption (≥5 d/week) adjusted for individual characteristics, São Paulo, Brazil, 2011
PR, prevalence ratio; SSB, sugar-sweetened beverages.
Model 1: each consumer or community food environment was associated with FV and SSB consumption separately and adjusted for individual-level variables (age, sex, education and income).
Model 2: adjusted for individual-level variables (age, sex, education and income)+neighbourhood-level income + community (density of supermarkets and fresh produce markets) and consumer food environment variables.
Model 3: adjusted for individual-level variables (age, sex, education and income)+neighbourhood-level income + community (proximity to supermarkets and fresh produce markets) and consumer food environment variables.
* Due to high collinearity between variables, FV availability was not included in the fully adjusted models.
† As of March 2011, $US 1·00=R$ 1·66.
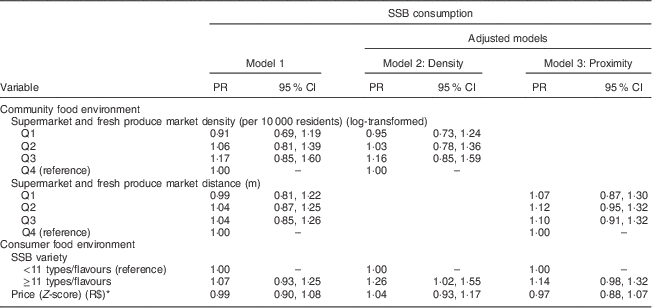
Median distance to the nearest retail food store was 125 m (interquartile range=70–297 m). We found a significant association between the proximity of supermarkets and fresh produce markets and FV consumption (Table 3), but not SSB consumption (Table 4), even after adjustment for consumer food environment measures and individual-level variables. A 25 % greater prevalence of regular FV consumption was found among participants who lived closer (in the first quartile of distance to the nearest supermarket or market) to supermarkets or fresh produce markets compared with participants who lived in the fourth quartile of distance to the nearest supermarket or fresh produce market.
Table 4 Associations of neighbourhood-level variables and regular sugar-sweetened beverage (SSB) consumption (≥5 d/week) adjusted for individual characteristics, São Paulo, Brazil, 2011
PR, prevalence ratio; FV, fruit and vegetables.
Model 1: each consumer or community food environment was associated with FV and SSB consumption separately and adjusted for individual-level variables (age, sex, education and income).
Model 2: adjusted for individual-level variables (age, sex, education and income)+neighbourhood-level income + community (density of supermarkets and fresh produce markets) and consumer food environment variables.
Model 3: adjusted for individual-level variables (age, sex, education and income)+neighbourhood-level income + community (proximity to supermarkets and fresh produce markets) and consumer food environment variables.
* As of March 2011, $US 1·00=R$ 1·66.
Consumer food environment
Table 3 presents findings for the studied consumer nutrition environment variables and FV consumption. FV availability was associated with a 41 % increase in the prevalence of regular FV consumption. FV price was not associated with FV consumption. However, living close to at least one retail food store which had fresh produce but not of high quality was associated with regular of consumption of FV in the fully adjusted model (prevalence ratio=2·25; CI 95 % 1·03, 4·89), compared with living in neighbourhoods where retail food stores and markets had high-quality produce. The regression of price was performed separately due to high collinearity between variables.
Table 4 shows the association of SSB consumption and each measure of the local food environment. A greater variety of SSB was associated with a higher prevalence of regular SSB consumption after adjustments for individual-level variables and food environment variables. Price, supermarkets and fresh produce markets density or proximity were not associated with SSB consumption in our sample.
Predictive margins of FV consumption among lower- and higher-income individuals for different levels of supermarket and fresh produce market density are plotted in Fig. 1. Individual-level income modified the association of retail food store and market density and FV consumption. The prevalence of regular FV consumption among low-income individuals living in neighbourhoods with a lower density of supermarkets and fresh produce markets was significantly lower than the prevalence among their counterparts with a higher income living in equally underserved neighbourhoods (P-interaction <0·05). Such differences disappeared in neighbourhoods with a larger number of supermarkets and markets. We did not find a moderating effect of income on the association of other food environment variables and SSB or FV consumption.

Fig. 1 Predicted values of fruit and vegetable (FV) consumption per individual-level income (●, >5MW; ![]() , ≤5 MW) as the density of supermarkets and fresh produce markets increased in the neighbourhood, São Paulo, Brazil, 2011. Values were predicted using Poisson GEE models with robust variance. FV consumption was modelled as a function of supermarket and fresh produce market density (log-transformed counts per 10 000 population), adjusting for sex, age and education. Income-specific estimates were statistically significant (P-interaction <0·05) and obtained from models containing individual-level income interactions with retail food store and market density within each neighbourhood. Error bars represent 95 % confidence intervals (MW, Brazilian monthly minimum wage; GEE, generalized estimating equations)
, ≤5 MW) as the density of supermarkets and fresh produce markets increased in the neighbourhood, São Paulo, Brazil, 2011. Values were predicted using Poisson GEE models with robust variance. FV consumption was modelled as a function of supermarket and fresh produce market density (log-transformed counts per 10 000 population), adjusting for sex, age and education. Income-specific estimates were statistically significant (P-interaction <0·05) and obtained from models containing individual-level income interactions with retail food store and market density within each neighbourhood. Error bars represent 95 % confidence intervals (MW, Brazilian monthly minimum wage; GEE, generalized estimating equations)
Discussion
In this sample from a large Brazilian city, some measures of the local food environment were associated with FV and SSB consumption. A higher density of supermarkets and fresh produce markets and FV availability in the neighbourhood were associated with regular FV consumption, especially among low-income individuals. Proximity to supermarkets and fresh produce markets also predicted FV consumption. Moreover, living near stores with a greater variety of SSB increased the prevalence of regular SSB consumption after adjustments for confounding variables.
Associations of FV availability and consumption were consistent and significant. Some prior research conducted in the USA found similar results( Reference Franco, Diez-Roux and Nettleton 6 ), while other studies did not( Reference Zenk, Lachance and Schulz 11 , Reference Thornton, Crawford and Ball 13 , Reference Gustafson, Sharkey and Samuel-Hodge 34 ). For instance, while availability( Reference Franco, Diez-Roux and Nettleton 6 , Reference Zenk, Lachance and Schulz 11 , Reference Thornton, Crawford and Ball 13 ) of healthy foods and presence of supermarkets in the neighbourhood( Reference Zenk, Lachance and Schulz 11 , Reference Moore, Diez Roux and Nettleton 35 ) have been more consistently associated with FV consumption, distance to the nearest supermarket has not been constantly associated with FV consumption( Reference Caspi, Kawachi and Subramanian 12 ). In our sample, lower-income individuals living in neighbourhoods with poorer access to supermarkets and fresh produce markets had a disproportionally lower regular FV consumption prevalence. Such disparity, however, disappeared in neighbourhoods better served with supermarkets and fresh produce markets.
Neither FV price nor quality was associated with consumption, as found in previous studies( Reference Zenk, Lachance and Schulz 11 , Reference Gustafson, Sharkey and Samuel-Hodge 34 ). In fact, living in neighbourhoods with stores/markets with fresh produce but not of high quality (no stores/markets in the upper quartile of quality) was enough to increase the FV consumption prevalence rate in that neighbourhood. We believe we found such results because the percentage of stores/markets in each census tract, averaged across the 1·6-km buffer around participants’ homes, that had FV in the upper quartile was less than 2 %. The great majority of stores/markets had FV in the first, second and third quartiles of quality and were likely to be small grocery stores and corner stores. Also, our findings on FV quality reinforce the effect of FV availability, rather than quality, on consumption. Living close to stores/markets where FV were available, regardless of the quality of fresh produce, was associated with a higher prevalence of regular FV consumption.
Although we attempted to rigorously measure fresh produce quality, we may not have captured all the dimensions consumers consider when evaluating the quality of FV and making purchase decisions. A more detailed quality assessment on more items could improve the measure( Reference Cummins, Smith and Taylor 9 ). However, this would increase study cost and time and would not necessarily guarantee different results( Reference Zenk, Lachance and Schulz 11 ). Direct measures of fresh produce quality may just not be sensitive enough to capture substantive differences in fresh produce quality and lack the ability to capture other concepts such as organic and specialty foods( Reference Caspi, Sorensen and Subramanian 36 ). Similarly, they do not account for differences in perceived quality, which may not always coincide with objective indicators and are sometimes more strongly related to dietary behaviours( Reference Caspi, Kawachi and Subramanian 12 ).
In the case of Latin America, fresh produce markets seem to play an important role in FV supply( Reference Gartin 16 , Reference Duran, Lock and Latorre 37 ) and consumption( Reference Jaime, Duran and Sarti 15 , Reference Vedovato, Trude and Kharmats 17 ). In our sample, 50 % of the respondents reported buying FV in fresh produce markets. In a socio-economically diverse sample of women from another Brazilian city, shopping at fresh produce markets was associated with greater consumption of minimally processed foods, including FV( Reference Vedovato, Trude and Kharmats 17 ). Additionally, the main reported reason for shopping at those markets was the proximity to home( Reference Vedovato, Trude and Kharmats 17 ).
Therefore, food policies aimed at making fresh produce markets more accessible, affordable, acceptable and able to accommodate local residents’ needs could potentially have population-wide benefits in FV consumption in Brazil. Promoting produce markets and markets where small local farmers can sell their products, instead of supermarkets, are also not related to potential negative externalities, such as the increase in the availability of ultra-processed foods such as SSB. SSB are widely available in all types of food stores( Reference Duran, Lock and Latorre 37 ) and this availability was associated with regular SSB consumption in our study.
Recent findings have shown positive effects of farmers’ markets in the USA( Reference Jilcott Pitts, Wu and McGuirt 38 , Reference Gustafson, Christian and Lewis 39 ), Canada( Reference Larsen and Gilliland 40 ) and New Zealand( Reference Pearson, Winter and McBreen 41 ). They are associated with increasing consumption of FV( Reference Jilcott Pitts, Wu and McGuirt 38 , Reference Gustafson, Christian and Lewis 39 ), can have positive effects on the surrounding availability and cost of healthy foods( Reference Pearson, Winter and McBreen 41 ), and support local and small farmers. In addition, financial incentives for lower-income participants of social programmes to shop at farmers’ markets are being tested in the USA and are achieving good results( Reference Young, Aquilante and Solomon 42 ).
When bringing full produce markets or markets where small local farmers can sell their products to underserved communities is not feasible due to zoning constraints or disputes with the city public transit authority over the closing of streets, smaller farm stands( Reference Evans, Jennings and Smiley 43 ) or FV mobile carts( Reference Li, Cromley and Fox 44 ) could be interesting options. Nevertheless, policy efforts may be needed to prevent such carts from being located exclusively in higher-income neighbourhoods and/or close to other retail food stores, as revealed by previous impact analyses in New York( Reference Li, Cromley and Fox 44 ).
SSB variety was associated with increased prevalence of regular SSB consumption in São Paulo, Brazil. In our case, variety could also be interpreted as greater availability of SSB: the more brands and flavours of soda, fruit-flavoured drinks and juices/nectars with added sugars in a given area, the higher the prevalence of regular SSB consumption. The literature on local food environment and SSB consumption relationships is more recent than, and not as diverse as, that for FV consumption. Shopping at a supermarket with high availability of healthy food has previously been associated with lower odds of consuming SSB in the USA( Reference Gustafson, Christian and Lewis 39 ). Although SSB prices are known to negatively affect SSB consumption in Brazil( Reference Claro, Levy and Popkin 10 ), surprisingly we did not find a clear association between SSB price and consumption. A possible explanation may be related to differences in the availability and consumption of different types of SSB in high- and low-income neighbourhoods. Although SSB and fruit-flavoured drinks are cheaper and more widely available in lower-income neighbourhoods, nectars and juices with added sugars are more expensive and more likely to be available in more affluent areas of the city of São Paulo( Reference Duran, Lock and Latorre 37 ). High-income individuals may thus be trading soda and cheaper fruit-flavoured drinks for more expensive sugar-sweetened beverages. Social marketing aimed at informing consumers of the problems associated with all types of SSB, as well as price increases (e.g. through SSB taxation), should be considered.
The strengths of the present study include the temporal connection between environmental and individual data, both collected in 2011, and the use of multiple aspects of the local retail food environment. They include measures of the consumer nutrition environment such as density of and proximity to stores, as well as objectively observed in-store measures (availability, variety, quality and price). Of the studies that have included both community and consumer food environment measures( Reference Franco, Diez-Roux and Nettleton 6 , Reference Zenk, Lachance and Schulz 11 , Reference Gartin 16 ), ours is among the first to do so in an extended geographic area of a middle-income country, with a large population sample and using a previously validated instrument.
Our study is subject to a few limitations. First, it was restricted to the participants’ residential area. There is little empirical information on which to base the area definition (or spatial scale) most relevant for food purchasing behaviour( Reference Matthews 45 ). Utilizing administrative boundaries such as census tracts, block groups or ‘buffers’ sets arbitrary boundaries in the food environment and implies that individuals recognize these boundaries and conduct their daily lives within these restrictions( Reference Perchoux, Chaix and Cummins 46 ). Moreover, access to motorized transportation increases mobility and may limit the relevance of immediate food environments by allowing residents to travel beyond a walking distance( Reference Fuller, Cummins and Matthews 8 ). However, walking as the main transportation mode to shop for food was associated with higher odds of consuming minimally processed foods such as FV, as well as the perception of availability of fresh produce in the home neighbourhood in Brazil( Reference Vedovato, Trude and Kharmats 17 ).
We used cross-sectional data, which limited casual inferences. In addition, our study was restricted to thirteen districts in the city of São Paulo; consequently, the present data should not be considered representative of the city or the country. However, the sampled districts represent the socio-economic diversity found in São Paulo and cover all geographic areas of the city. Further studies in cities across Brazil and Latin America will contribute with the generalizability of our findings. Although we recognize the importance of measures such as psychological attitudes towards healthy eating, nutrition knowledge or taste preferences in explaining the consumption of FV and SSB, our study did not attempt to address individual behavioural aspects that drive food choices, nor could we include such measures as potential confounders in our analyses.
The present study thus contributes to a growing body of research seeking to understand how and whether measures of local food environments are associated with diet in urban settings and more specifically, in low- and middle-income countries. Our results suggest that obesogenic environments in a large Brazilian metropolis play a role in shaping FV and SSB consumption, independent of individual characteristics. A better understanding of local and context-specific measures of food environments could potentially influence policy areas, such as urban planning and food and nutrition security, and lead to population-wide benefits in fighting obesity and diet-related diseases in Brazil.
Acknowledgements
Financial support: A.C.D. was supported by a PhD fellowship granted by the São Paulo Research Foundation (FAPESP; process number 2009/02279-7) and by a study abroad scholarship granted by the Coordination for the Improvement of Higher Education Personnel (CAPES; process number 4180-11-9). This work was funded by FAPESP (process number 2009/17517-0) and National Council for Scientific and Technological Development (CNPq; process numbers 559517/2010-6 and 476881/2010-2) grants. The funders had no role in study design, data collection and analysis, decision to publish, or preparation of the manuscript. The content is solely the responsibility of the authors. Conflict of interest: None. Authorship: A.C.D. conceived the study, conducted the analysis and led the writing. S.L.d.A. contributed with the study design and conducted the spatial analysis. M.d.R.D.O.L. contributed to the data analysis and writing. P.C.J. conceived the study, contributed to the background and obtained funding for the overall research project. All authors read and approved the final version of the manuscript. Ethics of human subject participation: The institutional Ethics in Research Committee at the University of São Paulo School of Public Health approved the study. All participants gave written informed consent.


