


Worldwide, about two-thirds of pregnant women had excessive rate of gestational weight gain (GWG), while about one-fifth had inadequate rate of GWG, but the numbers may differ by region and country(Reference Goldstein, Abell and Ranasinha1). Studies in USA reported that 47–62 % of pregnant women had excessive rate of GWG, while 17–21 % with inadequate rate of GWG(Reference Durie, Thornburg and Glantz2–Reference Walter, Perng and Kleinman5). Similarly, data from the Maternal and Newborn’s Health Monitoring System in China also showed that about 57·9 % of pregnant women had excessive GWG, while 12·5 % had inadequate GWG(Reference Huang, Ji and Zhao6) and the reported mean rate of GWG in second and third trimesters amounted to 0·56 ± 0·19 kg/week. However, a cross-sectional study of pregnant women attending the Maternal and Child Health clinics for routine antenatal check-up in Malaysia found that pregnant women had an overall higher rate of GWG in second trimester (0·48 kg/week) than in the third trimester (0·40 kg/week), in underweight and normal-weight women. Overweight women had similar GWG in both trimesters, whereas obese women had lower rate of GWG in second trimester than in third trimester(Reference Yong, Mohd Shariff and Koo7).
Inappropriate GWG may have profound short- and long-term consequences on health of both mother and infant. Inadequate GWG is associated with an increased risk of preterm delivery, fetal growth restriction, whereas excessive GWG may result in macrocosmic infants, caesarean delivery, maternal postpartum weight retention (PWR) and an increased risk for childhood obesity(Reference Huang, Ji and Zhao6,Reference Han, Lutsiv and Mulla8–Reference He, Hu and Chen13) . A retrospective study on the association between the rate of GWG over different pregnancy stages (early, mid and late) and pregnancy outcomes among Korean pregnant women showed that higher or lower GWG in early and late pregnancy, but not in mid pregnancy, was associated with a risk to develop gestational diabetes mellitus, pregnancy-induced hypertension, large-for-gestational-age (LGA) infants, macrosomia and caesarean delivery(Reference Cho, Hur and Lee14).
Previous research on GWG mainly focused on either the total GWG or the rate of GWG in a specific trimester(Reference Huang, Ji and Zhao6,Reference Yang, Han and Gao9–Reference Goldstein, Abell and Ranasinha11,Reference Han, Lutsiv and Mulla15) , since total GWG (kg) and rate of GWG (kg/week) are common indices of GWG, assuming that all women follow the same basic pattern of weight gain over pregnancy. However, there might be subgroups within the population having different patterns of weight gain(Reference Nagin, Jones and Passos16), resulting in a comparable total GWG but through different GWG trajectories. Trajectory modelling can estimate individual trajectories, identify groups of individuals following similar progression over time, estimate group memberships (i.e. within each group, there may be variation in trajectories), as well as identify high-risk groups for targeted intervention(Reference Nagin, Jones and Passos16–Reference Song18). To date, however, there is limited research on the rate of GWG and GWG trajectories(Reference Che, Kong and Bell19) and possible associations with birth outcomes(Reference Pugh, Albert and Kim20,Reference Zheng, Huang and Zhang21) . Understanding the GWG trajectories and their impact on pregnancy outcomes may contribute to the development of preventive support strategies that would benefit the health of both mother and child. Thus, the current study aims to identify GWG trajectory groups and their characteristics and determine the association with pregnancy outcomes.
Methods
Study design and population
This was a retrospective cohort study of healthy, non-diabetic pregnant woman with a singleton gestation having delivered at government hospitals in Seremban district, Negeri Sembilan, Malaysia between January 2010 and December 2012. A total of 4273 antenatal clinic cards were screened, and the data of 2193 pregnant women were included in this analysis (Fig. 1).
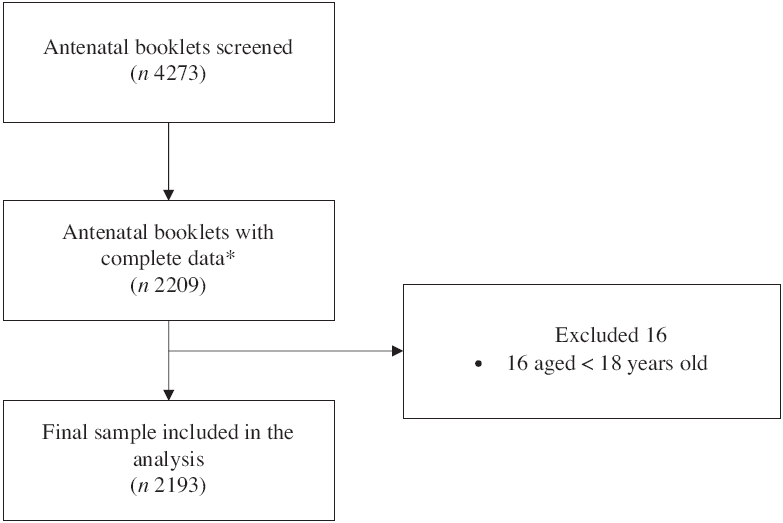
Fig. 1 Sampling procedure. *Complete data–complete all antenatal care visits
Data source
The source of data was antenatal clinic cards of pregnant women, which contained information on patient’s background, antenatal care, demographic characteristics, obstetric history and infant birth (e.g. gender, gestational age, length, head circumference and birth weight). Data were extracted from the antenatal clinic cards by trained enumerators.
Gestational weight gain
Height and weight at the first prenatal visit, first, second and third trimesters as well as weight at 6-week postpartum were obtained from the antenatal clinic cards. All women in the analysis had completed weight data. Height and body weight at the first prenatal visit were used to calculate early pregnancy BMI, with early pregnancy weight (kg) divided by the square of height (m2) and were further categorised into four groups: underweight (<18·50 kg/m2), normal weight (18·50–24·99 kg/m2), overweight (25·00–29·99 kg/m2) and obese (≥30·00 kg/m2)(22). Total GWG was defined as the difference between the weight measured at last prenatal visit and the weight at booking. The GWG was then classified, according to the 2009 US Institute of Medicine guidelines, as ‘inadequate’, ‘adequate’ and ‘excessive’(Reference Yaktine23). Total GWG (kg) was transformed into z-score using the published formula and GWG z-score chart(Reference Hutcheon, Platt and Abrams24,Reference Hutcheon, Platt and Abrams25) . Rate of weight gain in second and third trimesters was defined as the average weekly weight gain in that trimester.
Pregnancy outcomes
Evaluated maternal outcomes were including 6-week PWR, preterm delivery and caesarean delivery. The 6-week PWR was calculated by subtracting the weight at early pregnancy from the weight at 6-week postpartum. Preterm delivery was defined as delivery before 37 weeks of gestation(Reference Lowe, Metzger and Dyer26).
Infant outcomes evaluated in the current study were low birth weight (LBW), small-for-gestational-age (SGA) and LGA. LBW was defined as birth weight <2500 g(27). As there are differences in birth weight between Malaysian and European infants, the fetal growth charts for Malaysian female and male infants were used as a reference for infant’s birth weight percentile by gestational age(28). Infants with a birth weight below the 10th percentile for gestational age were considered as SGA, while those with birth weight more than the 90th percentile for gestational age were considered as LGA(27).
Statistical analysis
The statistical package STATA/SE version 15.0(29) was used to analyse the data obtained. Descriptive statistics are shown as the mean and sd for continuous variables, while frequency and percentage were used for categorical variables. Continuous data were tested for normal distribution using Kolmogorov–Smirnov tests.
Latent class trajectory analysis was used to identify the rate of GWG trajectory patterns(Reference Nagin, Jones and Passos16). A censored normal model was used to identify the patterns in the rate of GWG trajectory(Reference Jones and Nagin30). A two-stage model selection process was used to determine the trajectory models in relation to the number of groups and trajectory shapes (e.g. linear, quadratic, cubic)(Reference Nagin, Jones and Passos16). The number of groups was determined with the consideration of the average of Bayesian information criteria, and the proportion of estimated trajectory groups (the smallest group includes at least 5 % of patients), as model fit statistics(Reference Lemon, Roy and Clark31). Four models (two trajectory groups, three trajectory groups, four trajectory groups and five trajectory groups) were tested for linear, quadratic and cubic specifications for trajectory shape until the best fitting model was established. After determination of the number of groups and trajectory shapes, women were classified into rate of GWG trajectory groups based on the maximum estimated probability of belonging to each group. An average posterior probability of ≥0·70 for each group is considered as good discrimination in classifying individuals into distinctive groups(Reference Nagin, Jones and Passos16). All groups showed sufficiently high average posterior probability of individuals belonging to each of the groups (0·80–0·90). Three trajectory groups were identified and labelled as having slow initial GWG but followed by drastic GWG (group 1), maintaining the rate of GWG at an average of 0·58 kg/week (group 2) and maintaining the rate of GWG at an average of 0·38 kg/week (group 3).
Binary logistic regression was performed to determine the associations between the rate of GWG trajectory groups and pregnancy outcomes. As maternal characteristics such as age, occupation status, gravidity and total GWG showed significant differences among the trajectory groups, these factors were entered as covariates in the multiple logistic regression. Given the possibility of an interaction effect between age, occupation status, gravidity, BMI at first prenatal visit with trajectory groups, models incorporating interaction terms were also performed. Only BMI at first prenatal visit showed significant interaction effect. The full model, which included all covariates and significant interaction term, was presented. A stratified analysis was further performed for any significant interaction term. Crude and adjusted OR with 95 % CI were presented. The significant level for all statistical analyses was set at P < 0·05.
Results
As the interval between the first prenatal visit (mean of gestational weeks of 9·26, sd 1·09 weeks) and visit 1 in the first trimester (mean of gestational weeks of 13·12, sd 1·43 weeks) was short, therefore, the rate of GWG in the first trimester was not included in the trajectory analysis. Figure 2 presents the three distinct trajectories of GWG. Group 1 showed a slow initial GWG but followed by a drastic GWG, which was identified in only 5·0 % of the total sample. Women in this trajectory group gained about 0·17 kg/week in the second trimester and had increased the rate to more than 1·00 kg/week in the third trimester. Group 2 maintained an average of 0·58 kg/week, and it presented 18·8 % of the total sample. Group 3 maintained an average rate of GWG of 0·38 kg/week and comprised 76·2 % of the total sample.
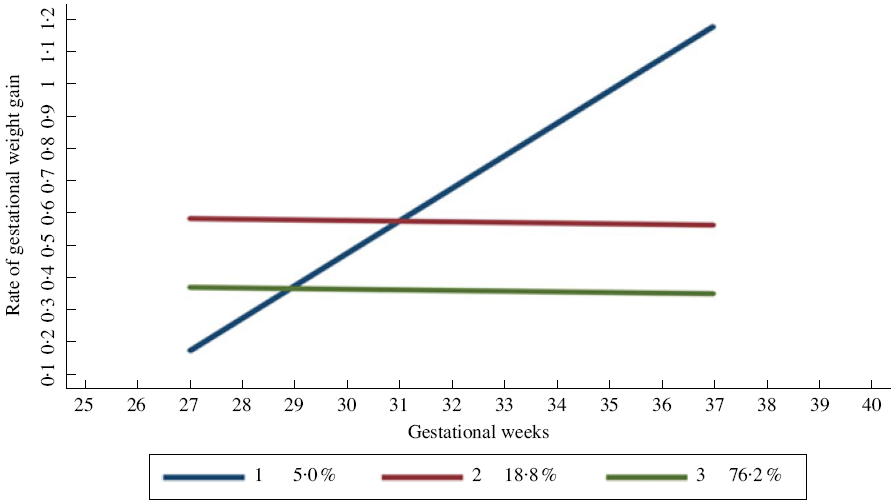
Fig. 2 Group 1 – slow initial gestational weight gain (GWG) but followed by drastic GWG. Group 2 – maintaining at an average rate of GWG of 0·58 kg/week. Group 3 – maintaining at an average rate of GWG of 0·38 kg/week
Table 1 summarises the characteristics of the cohort. Socio-demographic, obstetrical information, anthropometric measurements and pregnancy outcomes of the women were comparable between the trajectory groups. Overall, most women were Malay (83·7 %), had completed at least secondary education (60·1 %) and were employed (60·7 %). Women in group 3 were significantly older (29·34 (sd 4·54) years) and higher gravidity (2·77 (sd 1·57)) than those in group 2 (age 28·52 (sd 3·94) years; gravidity 2·38 (sd 1·26)). Women in group 2 were slightly taller but had a lower weight at the first prenatal visit (gestational weeks of 9·09 (sd 1·94)) and thus had a lower BMI than the two other groups. Women in group 1 had the highest weight at the first prenatal visit (65·12 (sd 17·59) kg) with a mean BMI at the first prenatal visit within the overweight range (25·00–29·99 kg/m2). Women in group 2 had the highest total GWG, with about 45·2 % had excessive GWG, and the highest proportion of women with substantial weight retention of more than 5 kg after 6-week postpartum (94·9 %) (45·53 (sd 1·61) weeks). For pregnancy outcomes, there were significant differences between groups for all outcome variables except for infant’s birth length, head circumference and birth weight percentile. Women in group 1 had significantly higher rates of preterm delivery (15·5 %) compared with the other groups. Women in group 2 had infants with significantly higher mean birth weight (3·08 (sd 0·47) kg) than women in group 1 (2·87 (sd 0·53) kg) and group 3 (3·03 (sd 0·45) kg). Women in group 1 had the highest percentage of SGA (37·3 %) and LGA infants (9·1 %) compared with those in group 2 (SGA = 32·5 %; LGA = 8·7 %) and group 3 (SGA = 33·2 %; LGA = 7·7 %).
Table 1 Characteristics of women by trajectory groups (n = 2193)
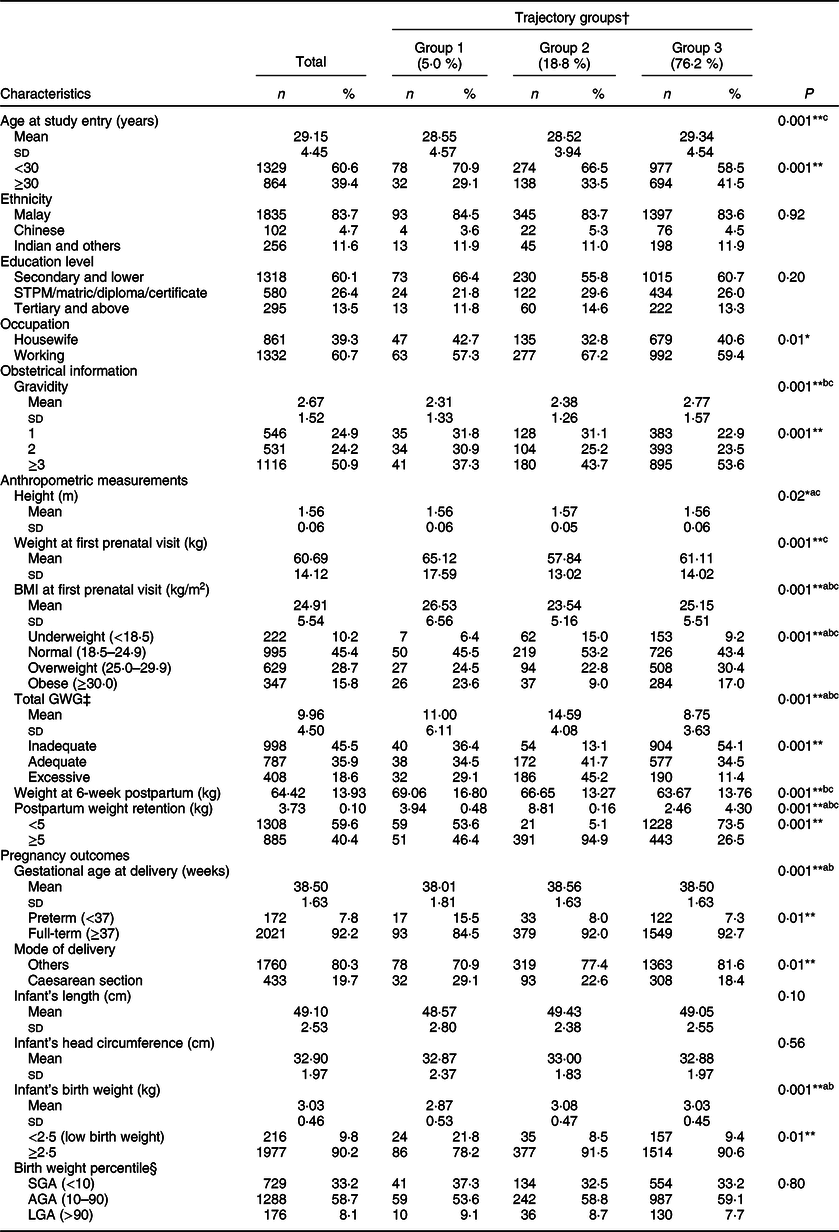
STPM, Malaysian Higher School Certificate; GWG, gestational weight gain; SGA, small-for-gestational-age; AGA, appropriate for gestational-age; LGA, large-for-gestational-age.
Mean values with unlike superscript letters were significantly different from each other: aGroup 1 v. group 2; bGroup 1 v. group 3; cGroup 2 v. group 3.
*P < <p 3. chP < 0·001.
† Group 1 – slow initial gestational weight gain (GWG) but followed by drastic GWG; Group 2 – maintaining the rate of GWG at 0.58 kg/week; Group 3 – maintaining the rate of GWG at 0.38 kg/week.
‡ Institute of Medicine, 2009.
§ Fisher’s exact test.
Table 2 shows the OR of having adverse pregnancy outcomes for each group with group 3, that is, ‘maintained at a lower rate of GWG’ used as the reference group. Women in group 1 were at significantly higher risk for 6-week PWR of more than 5 kg (AOR 1·02, 95 % CI 1·01, 1·04), caesarean delivery (AOR 1·03, 95 % CI 1·01, 1·04) and LBW infants (AOR 1·04, 95 % CI 1·02, 1·06) than women in group 3. Women in group 2 had significantly higher risk for 6-week PWR of more than 5 kg (AOR 1·18, 95 % CI 1·16, 1·21), preterm delivery (AOR 1·03, 95 % CI 1·02, 1·05) and caesarean delivery (AOR 1·02, 95 % CI 1·01, 1·03) but had a lower risk for SGA (AOR 0·97, 95 % CI 0·96, 0·99) than women in group 3. Only BMI at first prenatal showed significant interaction effect between the trajectory groups with pregnancy outcomes.
Table 2 Crude and adjusted OR and 95 % CI for associations between trajectory groups and pregnancy outcomes
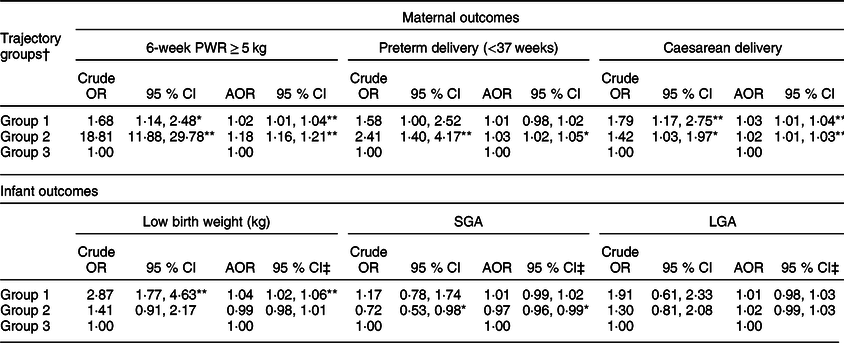
PWR, postpartum weight retention; SGA, small-for-gestational-age; LGA, large-for-gestational-age; AOR, adjusted OR; GWG, gestational weight gain.
*P < 0·05, **P < 0·001.
† Group 1 – slow initial gestational weight gain (GWG) but followed by drastic GWG; Group 2 – maintaining the rate of GWG at 0.58 kg/week; Group 3 – maintaining the rate of GWG at 0.38 kg/week.
‡ Full model, which included covariates (maternal age, occupation status, gravidity and total GWG z-score) and significant interaction term (pre-pregnancy BMI).
Table 3 shows the associations between trajectory groups and pregnancy outcomes stratified by BMI categories. Non-overweight/obese women with increasing rate of GWG (group 1) had higher risk for 6-week PWR of more than 5 kg (AOR 3·52, 95 % CI 2·01, 6·16). Meanwhile, overweight/obese women who maintained their rate of GWG at 0·58 kg/week were at significantly higher risk for preterm delivery (AOR 2·87, 95 % CI 1·36, 6·07) and caesarean delivery (AOR 2·04, 95 % CI 1·14, 3·68). For women in group 2, overweight/obese women had higher risk for 6-week PWR of more than 5 kg (AOR 42·39, 95 % CI 23·85, 75·34) than non-overweight/obese women (AOR 59·92, 95 % CI 28·68, 70·21). Similarly, in group 1, overweight/obese women had higher risk for having LBW infants (AOR 3·24, 95 % CI 1·64, 6·40) as compared with non-overweight/obese women (AOR 2·14, 95 % CI 1·06, 4·31).
Table 3 Adjusted OR and 95 % CI for associations between trajectory groups and pregnancy outcomes stratified by overweight/obesity†
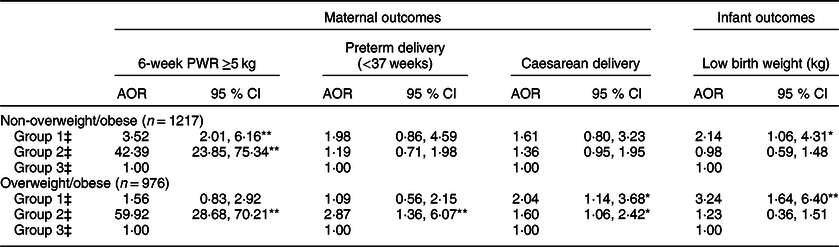
PWR, postpartum weight retention; AOR, adjusted OR.
Non-overweight/obese: BMI < 25·00 kg/m2; Overweight/obese: BMI ≥ 25·00 kg/m2.
† Adjusted for maternal age, occupation status, gravidity and total GWG z-score: *P < 0·05, **P < 0·001.
‡ Group 1 – slow initial gestational weight gain (GWG) but followed by drastic GWG; Group 2 – maintaining the rate of GWG at 0.58 kg/week; Group 3 – maintaining the rate of GWG at 0.38 kg/week.
Discussion
In the current study, three distinct trajectories of GWG were identified using the growth mixture modelling approach and these included group 1 – slow initial GWG but followed by drastic GWG (5·0 %), group 2 – maintained the rate of GWG at an average of 0·58 kg/week (18·8 %) and group 3 – maintained the rate of GWG at an average of 0·38 kg/week (76·2 %). Women in group 3 (maintained the rate of GWG at an average of 0·38 kg/week) were considered as having desirable rate of GWG as based on the Institute of Medicine GWG guidelines, and the recommended rate of GWG was 0·23–0·45 kg/week depending on the pre-pregnancy BMI categories. Therefore, this group was used as the reference group throughout the analysis. About 23·8 % had either slow initial GWG but followed by drastic GWG (group 1) or maintained the rate of GWG at an average of 0·58 kg/week (group 2). These women should be the target for intervention as they are at higher risk for adverse outcomes in the subsequent pregnancies.
In the current study, women with a slow initial GWG but a later drastic GWG (group 1) were considered as having excessive GWG, since the mean rate of GWG increased from 0·17 kg/week in the second trimester to 1·00 kg/week in the third trimester. A higher proportion of women in this group were in the age group <30 years old (70·9 %), housewives (42·7 %), first time mothers (31·8 %) and had secondary education level (66·4 %). In addition, these women had a higher mean BMI at first prenatal visit with slightly less than half (48·1 %) were overweight (24·5 %) or obese (23·6 %). Previous studies have also shown that overweight women were at higher risk for excessive GWG(Reference Yaktine23,Reference Samura, Steer and Daniela Michelis32,Reference Yong, Mohd Shariff and Koo33) . It is plausible that mothers who were less educated have poor knowledge of GWG recommendations, consequences of having inappropriate GWG, as well as strategies to achieve healthy weight gain in pregnancy(Reference Deputy, Sharma and Kim34,Reference Cohen, Kazi and Headen35) . Studies have consistently reported that younger mothers were at greater risk of excessive GWG, whereas older mothers may be more disciplined regarding lifestyle choices and thus tend to gain less weight(Reference Restall, Taylor and Thompson36–Reference Rodrigues, Costa de Oliveira and Santos Brito dos38). Heery et al. (Reference Heery, McConnon and Kelleher39) found that women in their first pregnancy were not particularly concerned about weight gain during pregnancy, and most of them perceived that big babies are healthy and that a higher GWG is beneficial for fetal development. The study findings suggest that nutrition education, particularly among high-risk groups (e.g. younger age mothers, housewife, lower education, as well as overweight/obese women), to prevent excessive GWG should start as early as possible ideally before pregnancy as to achieve optimal GWG and subsequent healthy pregnancy outcomes. A close monitoring of GWG over the course of pregnancy is also essential to identify mothers with inadequate or excessive rate of GWG in specific trimesters for further nutrition counselling by nutritionists at the health clinics.
For women in group 2 (maintained a higher rate of GWG (0·58 kg/week)), they had a higher education level (tertiary education) than women in group 1 and group 3. Several studies in the Western countries reported that women with higher education were associated with lower risk for excessive GWG(Reference Marmitt, Gonçalves and Cesar40,Reference Holowko, Mishra and Koupil41) . The inconsistent finding might be due to the variation in food choices, cooking methods and fast-food v. home cooking between populations of developed and developing countries(Reference Zienczuk and Egeland42,Reference Tiffin and Salois43) . In developed countries, highly educated pregnant women are more likely to comply with healthy lifestyle (e.g. choose low-fat, high-nutrient lean protein sources; use healthier cooking methods, such as grilling and lower-temperature cooking; prefer home-cooked food)(Reference Cohen, Kazi and Headen35). However, in the developing countries, generally individuals with higher education level have greater purchasing power and thus could afford processed foods, fast foods and eating outside the home on a more regular basis(Reference Pingali44). Consequently, they are at a higher risk for being overweight and obese. Previous studies have also showed that most people with higher education were white-collar workers and tend to have higher sedentariness, whereby spending most of their daily time seated in front of computers(Reference Smith, McCourt and Sawyer45,Reference Yang, Hipp and Lee46) . Women with higher sedentary behaviour tend to have excessive GWG(Reference Jiang, Qian and Li47). In the current study, as 85·8 % of women with at least tertiary education level were employed, these women could have higher total energy diet as well as higher sedentary behaviour due to occupational sitting.
Women in group 3 (maintained the rate of GWG at an average of 0·38 kg/week) were significantly older and had higher gravidity compared with women in group 2. Ebrahimi et al. (Reference Ebrahimi, Shariff and Tabatabaei48) reported that older women (30–35 years old) were more likely to have adequate GWG than inadequate GWG. As the majority of women (77·1 %) in this cohort were not first-time mothers, it is plausible that these women had accumulated knowledge and experience of GWG from previous pregnancies and births which could help in achieving the recommended weight gain in next pregnancy(Reference Nikolopoulos, Mayan and MacIsaac49). Despite being considered as having desirable rate of GWG throughout pregnancy, women in group 3 too had the highest percentage of inadequate total GWG (54 %) compared with group 1 and group 2. This might be due to the actual time of these women gained their weight. GWG trajectory was derived based on the rate of GWG, which was defined as an average weight gain per week. It is possible that women in this group might have gained more weight during the second trimester but less in the third trimester. Thus, although they seemed to maintain the rate of GWG in both trimesters, their total GWG could be less than the recommended range.
The current study found that women in group 1 had higher risk of caesarean delivery and LBW compared with women in group 3. Further analysis of women in group 1 showed that there was no significant association between caesarean delivery with LBW (χ 2 = 0·31, P = 0·58), LGA (χ 2 = 0·02, P = 0·89) or preterm delivery (χ 2 = 0·11, P = 0·74), respectively. Thus, it is believed that the reason for caesarean delivery in the current study was not related to infant’s birth weight or medical condition of mother or infant as compared with other reasons. Women with previous history of caesarean delivery had a 50 % increased risk of caesarean delivery in their subsequent pregnancy(Reference Barber, Lundsberg and Belanger50). Festin et al. (Reference Festin, Laopaiboon and Pattanittum51) also showed that the most common reason for caesarean delivery in the Southeast Asian countries including Malaysia was previous history of caesarean delivery. Besides, women in this group were also at a higher risk of having LBW infants. Previous studies showed that women with inadequate GWG in early pregnancy tended to have infants with LBW(Reference Yaktine23,Reference Flidel-Rimon, Rhea and Keith52,Reference DeVader, Neeley and Myles53) . Women in this trajectory group had the lowest rate of GWG at second trimester but the highest rate of GWG at third trimester. The study findings related to group 1, however, should be interpreted with caution due to the relatively small sample (n = 110) and the wide variation in the rate of GWG.
In the current study, women who maintained the rate of GWG of 0·58 kg/week (group 2) had significantly higher risk for 6-week PWR compared with women who maintained the rate of GWG at an average of 0·38 kg/week (group 3). It is possible that women with higher rate of GWG have higher possibility of storing greater fat, and thus higher PWR. This finding is consistent with previous studies that reported women with the rate of GWG above recommendation had significantly higher PWR than women with inadequate or adequate rate of GWG(Reference Kac, Benício and Velásquez-Meléndez54,Reference Begum, Colman and McCargar55) . Failure to attain early pregnancy weight at 6-week postpartum could be explained by the patterns of weight loss in the early postpartum. Lawrence et al. (Reference Lawrence, Mckillop and Durnin56) reported that fat stores in the early postpartum period are lost at the rate of 0·25 kg/week. Thus, the longer estimated time for weight loss may be more typical in the postpartum period(Reference Walker, Sterling and Timmerman57). The key factor that influences the amount of weight retention at 6-week postpartum is the amount of weight gain during pregnancy. For example, a woman with a normal pre-pregnancy BMI and an optimal gestational weight gain of 13·75 kg is expected to retain about 4·75 kg after delivery due to the products of conception (5 kg) and early fluid loss and tissue reductions (4 kg) during the first 2 weeks of postpartum. The remaining weight (4·75 kg) is mainly attributed to fat stores(Reference Sohlstrom and Forsum58), and it is estimated to take about 19 weeks to lose 4·75 kg based on the rate of 0·25 kg/week of fat loss. Thus, women in group 2 might require more time to get back to their pre-pregnancy weight.
The overweight/obesity-stratified analysis in the current study showed that women in group 1 had higher risk of PWR compared with women in group 3, and this association was only observed among non-overweight/obese women. Previous studies showed that women with normal pre-pregnancy BMI and had excessive weight gain during pregnancy were more likely to retain more weight(Reference Endres, Straub and McKinney59,Reference Sha, Cheng and Li60) . Meanwhile, the significant association between group 1 and caesarean delivery was only found among overweight/obese women. Similarly, the significant associations between group 2 and preterm delivery and caesarean delivery were also found among overweight/obese women. These findings further support the existing findings in that overweight and obese women were at higher risk of caesarean delivery(Reference Nkoka, Ntenda and Senghore61) and preterm delivery(Reference McDonald, Han and Mulla62).
The current study observed that while low birth weight in group 2 (8·5 %) and group 3 (9·4 %) are much lower than that of group 1 (21·8 %), and the prevalence of SGA appears to be quite high in all groups. Women in group 1 had lower mean of gestational age at delivery and higher percentage of preterm delivery compared with women in groups 2 and 3. In addition, women in group 1 had higher percentage of LGA (9·1 %) and caesarean delivery (29·1 %) as compared with women in group 2 (8·7 %; 22·6 %) and group 3 (7·7 %; 18·4 %). This finding revealed that the high proportion of infants in group 1 seems to have LBW, but they were not SGA infants, yet possibly LGA infants. As the current study did not assess the reasons for preterm delivery and caesarean delivery, the underlying factors for this observation are not completely understood. Thus, more studies should be carried out to investigate the reason behind this observation.
The total GWG and rate of GWG have been conventionally used to inform the risk of adverse pregnancy outcomes. These indices of GWG assume all women follow the same basic pattern of weight gain over pregnancy. In the current study, three distinct trajectories of GWG were identified using the latent class growth model and women with inappropriate GWG such as group 1 and group 2 were at significantly higher risk for adverse outcomes, such as PWR, caesarean delivery and preterm delivery. This finding supports the findings from previous studies on GWG trajectory in that GWG patterns during pregnancy are important, and poor GWG trajectory was associated with adverse birth outcomes. Thus, it is very important to closely monitor the women’s weight throughout pregnancy as it could enable the early identification of a poor GWG trajectory that could serve as a prompt for medical officers to refer nutritionists/dietitians to counsel on healthy eating to achieve optimal GWG. It is also suggested that the GWG recommendations on a weekly or monthly basis may be more helpful than the total GWG recommendations.
This is the first study to report on the rate of GWG and GWG trajectories in Malaysia among a large sample of pregnant women. However, several limitations are worth to be mentioned. An important limitation is that the current study was retrospective in nature, which may be influenced by the selection bias and unmeasured confounding factors (i.e. dietary intake, physical activity and household income) as well as the possibility of missing data. The generalisability of the study findings may be limited due to the recruitment of study population (83·7 % Malays) and the selection of the study districts. Therefore, the application of these study findings to other ethnic groups should be interpreted with caution. Besides, the study findings (e.g. significant associations) should be interpreted with caution as the statistical significance of the results may be attributed to the large sample size. The postpartum period examined in the current study was relatively short (i.e. 6-week postpartum), and women might have had insufficient time to lose weight following delivery. Furthermore, it should also be noted that latent trajectories are not directly observed clusters, but groups were constructed based on the pattern responses over a fixed number of observation periods. Thus, this method does not predict the development of excessive GWG in an individual, nor produce overall population prevalence data, instead trajectories are derived by assigning each woman a probability of membership based on their weight during pregnancy. The use of the GWG z-score charts from previous studies to estimate GWG z-score might yield overestimated values. Although adjustment for some covariates was performed, some unmeasured variables (i.e. interpregnancy weight gain, history of caesarean delivery and history of preterm delivery) may have influenced the derived trajectories in the current study. Hence, further studies should consider the contribution of these predictors to the derivation of the GWG trajectories. Despite these limitations, the data from the current study were adequate to examine the associations between the rate of GWG trajectories and pregnancy outcomes.
Conclusion
Most of the pregnant women in the current study maintained the rate of GWG at an average of 0·38 kg/week for second and third trimesters. Women with a slow initial GWG but followed by a drastic GWG or with maintained rate of GWG at an average of 0·58 kg/week had higher risk of adverse pregnancy outcomes, such as higher risk for caesarean delivery, preterm delivery, LBW and PWR. Women with maintained rate of GWG at an average of 0·58 kg/week had lower risk of having SGA infants. Lack of knowledge on GWG is considered a barrier to improve pregnancy outcomes. To achieve optimal maternal and infant outcomes, women need to be advised as early as possible, even before pregnancy, regarding recommended GWG and potential risks of insufficient and excess GWG.
Acknowledgements
Acknowledgements: The authors would like to thank all nurses and staff in Maternal and Child Health clinics in Seremban district, Negeri Sembilan for their support and assistance. Financial support: The current study was supported by a research grant from Danone Dumex (Malaysia) Shd. Bhd. Conflict of interest: As the nature of the current study is more of exploratory and does not involve any testing of company product, the funder was not involved in the design of the study protocol. J.B. and E.v.d.B. are employees of Danone Nutricia Research and Yvonne Yee Siang Tee of Danone Dumex Malaysia. The authors declare that they have no conflict of interest. Authorship: Z.M.S. and Y.H.Y. conceptualised and designed the study. Y.H.Y. collected the data, analysed the data and drafted the manuscript. Z.M.S., Z.R. and B.N.M.Y. contributed to the development of study protocol, read and approved the manuscript. G.A. contributed to data analysis and data interpretation. E.v.d.B., J.B., G.A. and Y.Y.S.T. read and approved the manuscript. All authors read and approved the final version of the manuscript. Ethics of human subject participation: The current study was conducted according to the guidelines laid down in the Declaration of Helsinki, and all procedures involving research study participants were approved by the Medical Research Ethics Committee, Universiti Putra Malaysia (UPM/FPSK/100–9/2-MJKEtika) and the Medical Research Ethics Committee, Ministry of Health Malaysia (KKM/NIHSEC/08/0804/P12–613). Written informed consent was not required due to the retrospective design of the study and because all participants were anonymised before data analysis.


