


Despite the importance of cooking in modern life, little is known about behaviours and perceptions of cooking in the USA; much less is known about this critical intermediate step than is known about either food access or consumption( Reference Drewnowski 1 – Reference Powell and Nguyen 7 ). Available evidence suggests that adults in the USA spend less time cooking now than in the past( Reference Zick and Stevens 8 , Reference Smith, Ng and Popkin 9 ). Yet, Americans currently report living in households where dinner is cooked on average five nights per week, with over half cooking dinner six or seven times weekly( Reference Virudachalam, Long and Harhay 10 , Reference Wolfson and Bleich 11 ), and almost half of all food dollars are spent on food consumed at home( 12 ).
The literature also suggests that convenience foods (‘any fully or partially prepared foods in which significant preparation time, culinary skills or energy inputs have been transferred from the home kitchen to the food processor and distributor’( Reference Celnik, Gillespie and Lean 13 )) have become ubiquitous in the modern diet. On a typical day, 90 % of US adults purchase convenience foods for use at home (as opposed to food away from home)( Reference Harris and Shiptsova 14 ) which represents almost 20 % of all food expenditures( Reference Guthrie, Lin and Okrent 15 ). By comparison, spending on fruits and vegetables accounts less than 10 % of total food spending( Reference Guthrie, Lin and Okrent 15 ).
Little is known about how US adults understand what it means to cook, particularly whether convenience foods are considered to be part of the cooking process. Limited evidence suggests that people do interpret the meaning of cooking quite differently, often differentiating between ‘real’ cooking and ‘everyday’ cooking based on the occasion (e.g. Thanksgiving or a birthday compared with a weekday dinner), the products used or the meals being prepared( Reference Short 16 ). Research also suggests that cooking confidence and positive attitudes about cooking are important determinants of cooking behaviour, perhaps even more so than specific cooking skills( Reference Short 16 , Reference Stead, Caraher and Wrieden 17 ). For example, individuals who report confidence about their cooking are more likely to enjoy cooking, cook a wider variety of foods and experiment with new foods( Reference Stead, Caraher and Wrieden 17 ).
Cooking is a complex concept that does not have a single agreed upon or ‘correct’ definition in the literature( Reference Short 16 – Reference Bowen, Elliott and Brenton 21 ). In fact, uncertainty about the public’s understanding of the meaning of cooking is often cited as a limitation in studies examining the association between cooking skills and cooking behaviours such as home food preparation( Reference Smith, Ng and Popkin 9 , Reference Virudachalam, Long and Harhay 10 , Reference Hartmann, Dohle and Siegrist 22 – Reference Sobal and Hanson 24 ). Greater frequency of cooking at home is associated with consumption of a healthier diet( Reference Wolfson and Bleich 11 ), particularly among higher-income households( Reference Wolfson and Bleich 25 ), and cooking at home is promoted as an obesity prevention measure( 26 – Reference Nestle 28 ). A better understanding of this relationship is critical to maximize food preparation at home in order to promote the public’s health.
The primary objective of the present study was to describe the way in which adults in the USA conceptualize the meaning of cooking. We also examined associations between cooking perceptions and cooking confidence, attitudes and behaviour. To our knowledge this is the first study to examine cooking perceptions and the meaning of cooking in an American population using a nationally representative sample.
Methods
We designed a web-based survey to measure cooking perceptions, confidence, attitudes and behaviours. We conducted seven focus groups with community members from diverse backgrounds to inform the design of the survey instrument. Where possible, previously validated items were used( 29 , Reference Michaud 30 ) and face validity of original items was assessed by multiple experts in the content area. The survey was reviewed by content experts and pilot tested before entering the field.
We fielded the survey in April 2015 using the survey research firm GfK’s Knowledge Panel( 31 ). This GfK panel is commonly used for survey research to generate nationally representative estimates of attitudes and behaviours for numerous public health topics( Reference Baker, Wagner and Singer 32 – Reference Long, Kenney and Zuckerman 35 ). The study sample was drawn from GfK’s approximately 50 000 panel members who are recruited through equal probability, address-based sampling from a sampling frame covering 97 % of US households (including households with unlisted telephone numbers or without landlines)( 31 ). Households without Internet access are given a computer and an Internet connection from GfK( 31 ). GfK provides study-specific sample weights to correct for biases in sampling or non-response and to ensure the final sample is nationally representative (based on comparisons with the Current Population Survey). Our survey was fielded among 1568 GfK panel members (aged ≥18 years), of whom 1137 completed the fifty-three-item survey. The median survey completion time was 16 min. Twenty-five individuals who completed the survey in <4 min were excluded; resulting in a final sample size of 1112 and a survey completion rate of 73 %. Weighted and unweighted characteristics of the study sample compared with national rates are available in the online supplementary material, Supplemental Table 1.
Measures
Perceptions of cooking
We asked respondents to respond to eighteen statements to measure their perceptions of cooking. The development of the eighteen statements was strongly informed by focus group data which suggested that method of preparation (both in terms of the equipment used and whether or not heat was involved), the degree of effort and the types of ingredients used (scratch/fresh, or convenience foods) were of primary importance when people make determinations about whether something counted as being cooked. We did not assume any single ‘correct’ definition of cooking when crafting the cooking perception measures; rather, we tried to word each question as neutrally as possible. The focus group data also informed the specific terms and products used in these measures to ensure that they would be accessible and easily understood by the general public. Each statement started with the same introduction: ‘There are many ways to prepare meals. Below are some examples of different ways people prepare meals. Indicate how strongly you agree or disagree that the following activities are cooking. There are no right or wrong answers.’ Then, respondents read the phrase ‘I would say I have cooked, if I …’ followed by descriptions of different combinations of food preparation activities and ingredients or products. For example, respondents were asked if they would say they had cooked if they ‘… used boiling water to make pasta or noodles with sauce from a jar’, if they ‘… chopped vegetables to make a salad and used a store-bought salad dressing’ or if they ‘… made something in the microwave using mostly scratch or fresh ingredients’. The full list of statements can be found in the online supplementary material, Supplemental Table 2. Responses were measured on a 7-point Likert scale from ‘strongly disagree’ to ‘strongly agree’. The order in which participants viewed the statements was randomized.
We used factor analysis to identify thematic areas (or factors) related to perceptions of cooking. We averaged the responses to the questions that loaded on to each factor and created dichotomous indicators of agreement (i.e. the factor was considered cooking) if the mean response of the items loading on to the factor was ≥5 (corresponding to three response categories: ‘somewhat agree’, ‘agree’ or ‘strongly agree’). We also measured cooking perceptions by combining the factors into one categorical variable with mutually exclusive categories.
Cooking confidence and attitudes
Cooking confidence was measured on a 7-point scale from ‘not at all confident’ to ‘extremely confident’. Participants were asked how confident they were that they could cook from scratch using fresh ingredients, follow a recipe and cook a healthy meal. Respondents were asked about both positive and negative attitudes about cooking. To assess positive attitudes, respondents were asked how strongly they agreed or disagreed that they enjoy cooking, cooking helps them eat healthfully, they are a good cook, cooking is important to them and cooking makes them happy. To assess negative attitudes, respondents were asked whether they feel that cooking takes too much time, costs too much, is a burden or chore, or is stressful. All responses were measured on a 7-point scale from ‘strongly disagree’ to ‘strongly agree’. Question order for both confidence and attitude measures was randomized.
Cooking behaviours
To understand cooking behaviours, we measured the number of times per week the respondent or someone in their household reported cooking breakfast, lunch and dinner as well as the frequency of cooking meals using scratch/fresh ingredients (such as fresh vegetables or raw meats), packaged/boxed ingredients (such as products that include flavour packets and dried pasta or rice but that require additional ingredients (such as butter or milk) and need to be heated), frozen products (such as frozen vegetables, fish or meat) and recipes. We also measured the frequency of consuming home-cooked leftovers for breakfast, lunch and dinner. Responses ranged from 0 to ≥7.
Demographic and socio-economic covariates
Covariates included sex, age (18–29, 30–44, 45–59, ≥60 years), race/ethnicity (White, Black, Hispanic, Other), education (less than high school, high-school diploma, some college, college degree or more), employment status (working v. not working) and marital status (married v. not married). We also controlled for participation in US government-administered nutrition assistance programmes such as the Supplemental Nutrition Assistance Program (SNAP) or the Special Supplemental Nutrition Program for Women, Infants, and Children (WIC) based on whether the respondent or someone in their household was receiving SNAP or WIC benefits at the time of the survey. All responses were based on self-report.
Analysis
First, we performed a principal components analysis followed by exploratory factor analysis using an oblique rotation and polychoric correlation matrix on the eighteen-item set of cooking perception statements. We extracted three factors, described below. A scree plot and parallel analysis confirmed the extraction of three factors. Four items were dropped because they had low factor loadings (<0·5) or high uniqueness (>0·5). Final factor analysis results for the fourteen retained items are available in the online supplementary material, Supplemental Table 3.
Next, we examined the percentage of respondents who responded negatively (‘strongly disagree’, ‘disagree’ or ‘somewhat disagree’), had no opinion or responded positively (‘strongly agree’, ‘agree’ or ‘somewhat agree’) to each of the fourteen remaining cooking perception measures. Then, we used ordered logit multivariate models (and Poisson models for cooking behaviour outcomes) to estimate the association between cooking perception factor indicators and cooking confidence, attitudes and behaviours adjusted for the covariates described above. The cooking perception factor indicators were included in the same model to isolate the association between each factor and the outcomes while accounting for correlation between the factors (i.e. whether the respondent also considered other factors be cooking). Finally, we used Poisson models to estimate the association between the mutually exclusive cooking perception categories and cooking behaviours. We used post-estimation margins to estimate predicted mean cooking practices and behaviours for individuals in each of these cooking perception categories. For all analyses sociodemographic covariates were included based on prior literature( Reference Virudachalam, Long and Harhay 10 , Reference Wolfson and Bleich 11 , Reference Lang, Caraher and Dixon 36 ) regardless of statistical significance. All analyses were conducted with the statistical software package Stata version 13 and used GfK-provided survey weights to produce nationally representative estimates. Significance was assessed at P<0·05.
Results
The characteristics of the study sample are presented in Table 1, overall and by cooking perception factors. The study sample mirrors the sociodemographic characteristics of the USA (see online supplementary material, Supplemental Table 1). The factor analysis yielded three cooking perception factors measuring agreement that cooking involves using: (i) convenience foods (i.e. canned tomato sauce or soup, frozen meals, boxed macaroni and cheese); (ii) scratch ingredients (i.e. fresh vegetables, home-made salad dressing or raw instead of frozen/pre-cooked meat); (iii) cold preparations not using heat (i.e. salads or cold sandwiches). Of the 1112 respondents, 352 included convenience foods in their definition of cooking, 921 agreed using scratch/fresh ingredients counted as cooking and 506 included not using heat in their definition of cooking. There were no significant differences in sociodemographic characteristics between those who considered convenience foods to be cooking and the full sample, whereas those who considered not using heat to be cooking were more likely to be highly educated, not receiving SNAP or WIC, and obese.
Table 1 Demographic characteristics of the study sample by factors important for considerations of what counts as cooking, Home Cooking Survey of US adults aged ≥18 years, 2015 (n 1112)

SNAP, Supplemental Nutrition Assistance Program; WIC, Special Supplemental Nutrition Program for Women, Infants, and Children.
Factor categories were generated using polychoric factor analysis using promax rotation. Factors were dichotomized, with scores ≥5 defined as that factor being important and scores <5 defined as that factor being not important.
‡ Difference based on χ 2 test.
§ Normal weight, BMI=18·50–24·99 kg/m2; overweight, BMI=25·00–29·99 kg/m2; obese, BMI≥30·00 kg/m2.
Perceptions of cooking
Figure 1 shows the unadjusted distribution of responses for the fourteen cooking perception statements. Six items loaded on to factor 1, four items each loaded on to factors 2 and 3. Among the six items measuring agreement with the idea that convenience foods counted as cooking, agreement ranged from 72 % agreement that using boiling water to make pasta with sauce from a jar is cooking to 31 % agreement that using the microwave to defrost frozen meals is cooking. Agreement about whether heating store-bought frozen or packaged items constituted cooking was related to the method of heat (49 % agreement for using the oven and 39 % agreement for using the microwave).
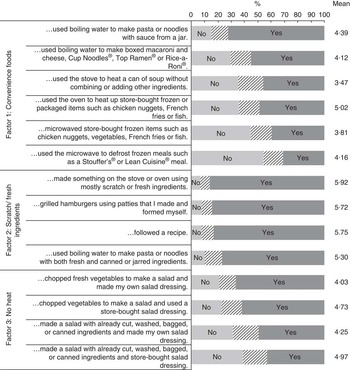
Fig. 1 Unadjusted overall perceptions of what food preparation activities are considered cooking, Home Cooking Survey of US adults aged ≥18 years, 2015 (n 1112). Responses were measured on a 7-point Likert scale from ‘strongly disagree’ to strongly ‘agree’. ‘No’ (![]() ) measures the sum of ‘strongly disagree’, ‘disagree’ and ‘somewhat disagree’; ‘yes’ (
) measures the sum of ‘strongly disagree’, ‘disagree’ and ‘somewhat disagree’; ‘yes’ (![]() ) measures the sum of ‘strongly agree’, ‘agree’ and ‘somewhat agree’. ‘No opinion’ (
) measures the sum of ‘strongly agree’, ‘agree’ and ‘somewhat agree’. ‘No opinion’ (![]() ) reflects the middle value (4) of the 7-point scale (labelled ‘neither agree nor disagree’). Cup Noodles® and Top Ramen® are dried noodles and a flavour packet that is prepared by adding boiling water. Rice-a-Roni® is a box of instant rice with a seasoning packet that is prepared with boiling water and butter. Stouffer’s® and Lean Cuisine® are both brands with a variety of frozen dinner products
) reflects the middle value (4) of the 7-point scale (labelled ‘neither agree nor disagree’). Cup Noodles® and Top Ramen® are dried noodles and a flavour packet that is prepared by adding boiling water. Rice-a-Roni® is a box of instant rice with a seasoning packet that is prepared with boiling water and butter. Stouffer’s® and Lean Cuisine® are both brands with a variety of frozen dinner products
There was overwhelming agreement (77–86 %) that using scratch ingredients, even in combination with other non-fresh ingredients, was considered cooking. Only 7–10 % of respondents stated they did not consider these activities to be cooking. Agreement with the two statements about making a salad was highest for chopping fresh vegetables and making one’s own salad dressing (67 % agreement, 21 % disagreement) and lowest for making a salad with already cut, washed, bagged or canned ingredients and using a store-bought dressing (43 % agreement, 39 % disagreement).
Cooking confidence and attitudes
Table 2 reports associations between the three cooking perception factors and cooking confidence, attitudes and behaviours. Respondents who considered using convenience foods to be cooking were less likely to be confident in their ability to cook from scratch (OR=0·52, P<0·001), follow a recipe (OR=0·72, P=0·03) and cook a healthy meal (OR=0·67, P=0·01) compared with those who did not consider convenience foods to be cooking. They were also less likely to enjoy cooking (OR=0·68, P=0·006), think that cooking helps them to eat healthfully (OR=0·74, P=0·02), think that they are a good cook (OR=0·71, P=0·01), feel that cooking is important to them (OR=0·71, P=0·02) and that cooking makes them happy (OR=0·75, P=0·04), and were more likely to feel that cooking is burden or chore (OR=1·33, P=0·04) and that cooking is stressful (OR=1·41, P=0·02).
Table 2 Adjusted associations between cooking perception factorsFootnote ‡ and cooking confidence, attitudes and behaviours, Home Cooking Survey of US adults aged ≥18 years, 2015 (n 1112)

SNAP, Supplemental Nutrition Assistance Program; WIC, Special Supplemental Nutrition Program for Women, Infants, and Children.
Models are adjusted for cooking perception factors, sex, age, race/ethnicity, education, SNAP/WIC status, employment status and marital status. Survey weights are used to generate nationally representative estimates. Confidence was measured on a 7-point Likert scale from ‘not at all confident’ to ‘extremely confident’. Attitudes were measured on a 7-point Likert scale from ‘strongly disagree’ to ‘strongly agree’. Ordered logit models were used for confidence and attitude outcomes. Cooking behaviours were measured as number of times per week from ‘0 times’ to ‘7 times or more’. Poisson models were used for cooking behaviour outcomes.
*P<0·05, **P<0·01, ***P<0·001.
‡ Cooking perception factors were derived from fourteen cooking perception statements, which began ‘I would say I have cooked, if I …’. Responses were measured on a 7-point Likert scale from ‘strongly disagree’ to ‘strongly agree’. Factors were dichotomized, with scores ≥5 defined as that factor being important and scores <5 defined as that factor being not important.
§ Such as fresh vegetables or raw meats.
|| Such as boxed macaroni and cheese, Hamburger Helper® or Rice-a-Roni® (boxed pasta or rice products with a flavour packet included which are combined with other ingredients such as milk or butter).
¶ Such as frozen vegetables, fish or meats.
‡‡ Cooking and eating frequency of meals ranged from 0 to ≥7 d/week.
Respondents who considered scratch ingredients or not using heat to be cooking were more likely to be confident in their ability to cook from scratch (scratch ingredients: OR=4·27, P<0·001; no heat: OR=1·79, P<0·001), follow a recipe (scratch ingredients: OR=7·01, P<0·001; no heat: OR=1·45, P=0·01) and cook a healthy meal (scratch ingredients: OR=3·74, P<0·001; no heat: OR=1·75, P<0·001) compared with those who did not.
Respondents who considered using scratch ingredients or not using heat to be cooking were more likely to have positive attitudes about cooking than those who did not consider each of those activities to be cooking. Specifically, they were more likely to enjoy cooking (scratch ingredients: OR=2·91, P<0·001; no heat: OR=1·47, P=0·003), feel that cooking helps them eat healthier (scratch ingredients: OR=4·44, P<0·001; no heat: OR=1·56, P<0·001), feel they are a good cook (scratch ingredients: OR=3·48, P<0·001; no heat: OR=1·67, P<0·001), that cooking is important to them (scratch ingredients: OR=2·82, P<0·001; no heat: OR=1·72, P<0·001) and that cooking makes them happy (scratch ingredients: OR=3·15, P<0·001; no heat: OR=1·49, P=0·002).
Cooking behaviours
Perceptions of cooking were also associated with some differences in cooking behaviour. Responses that included use of convenience foods as cooking were associated with less use of scratch ingredients (coefficient=−0·23, P<0·001) and greater likelihood of using packaged/boxed ingredients (coefficient=0·43, P<0·001) compared with those who did not think using convenience foods was cooking. The perception that cooking does not imply the use of heat was associated with greater frequency of using scratch ingredients (coefficient=0·15, P=0·005) and packaged/boxed ingredients (coefficient=0·18, P=0·05), and with greater frequency of cooking dinner (coefficient=0·10, P=0·002).
Table 3 shows predicted cooking behaviours overall and for each mutually exclusive cooking perception category. People who had the most inclusive definition of cooking (including all three cooking factors) reported cooking more frequently with packaged/boxed products (1·80 times/week v. 0·95 times/week, P<0·001) and frozen products (2·56 times/week v. 1·99 times/week, P<0·001) than people who perceived cooking to mean scratch ingredients only. Those who perceived cooking to include using only scratch ingredients reported cooking dinner the least frequently compared with those who defined cooking as meaning scratch ingredients and convenience foods or no heat (4·31 times/week v. 4·81 times/week, P<0·001) and those who defined cooking broadly to mean scratch ingredients, convenience food and no heat (4·31 times/week v. 4·72 times/week, P=0·03).
Table 3 Predicted mean cooking behaviours overall and by cooking perception categoriesFootnote ‡, Home Cooking Survey of US adults aged ≥18 years, 2015 (n 1112)

SNAP, Supplemental Nutrition Assistance Program; WIC, Special Supplemental Nutrition Program for Women, Infants, and Children.
Models are adjusted for cooking perception categories, sex, age, race/ethnicity, education, SNAP/ WIC status, employment status and marital status. Survey weights are used to generate nationally representative estimates.
*Difference from scratch ingredients only significant at P<0·05.
† Difference from all (scratch ingredients, convenience foods and no heat) significant at P<0·05.
‡ Cooking perception categories are based on cooking factors derived from fourteen cooking perception statements, which began ‘I would say I have cooked, if I …’. Responses were measured on a 7-point Likert scale from ‘strongly disagree’ to ‘strongly agree’.
§ Cooking and eating frequency of meals ranged from 0 to ≥7 d/week.
|| Such as fresh vegetables or raw meats.
¶ Such as boxed macaroni and cheese, Hamburger Helper® or Rice-a-Roni® (boxed pasta or rice products with a flavour packet included which are combined with other ingredients such as milk or butter).
‡‡ Such as frozen vegetables, fish or meats.
Discussion
In the present study we explored cooking perceptions, confidence, attitudes and behaviours among a nationally representative sample of US adults and found that Americans perceive cooking in three main ways: use of convenience foods, scratch ingredients and not using heat. Notably, while most (83 %) respondents agree that using scratch ingredients is cooking, far fewer (32 %) agree that cooking means only using scratch ingredients. People who include convenience foods in their definition of cooking are less likely to feel confident in their cooking abilities and less likely to have positive attitudes about cooking. Our results related to cooking perceptions and cooking behaviour are more nuanced. While agreement that using convenience foods is cooking is associated with lower confidence and negative attitudes about cooking, those with more expansive definitions of cooking (including convenience foods and/or not using heat) report cooking breakfast, lunch and dinner more frequently than those who perceive cooking to be only scratch ingredients.
Lang and Caraher describe a culinary transition in which the skills needed to procure and prepare food are different now than in the past( Reference Lang and Caraher 37 ). Results from the present study indicate that a similar transition may have taken place with regard to how the public conceptualizes the meaning of cooking. As technology has evolved (i.e. the invention of microwaves and other kitchen gadgets as well as advances in food science) and the food supply has expanded to include an ever-growing number of convenience products, for many people in the USA perceptions of cooking have moved beyond traditional home-made preparation with all scratch ingredients to include use of ready-made products and quick preparations.
Our findings related to cooking perceptions are consistent with prior qualitative work on public perceptions of the meaning of cooking, which found that perceptions of what it means to cook span the continuum from preparation of raw foods only to anything involved in the task of food preparation( Reference Short 16 , Reference Wolfson, Bleich and Smith 38 ). Similar to the results from the present study, perceptions of cooking were primarily based on whether scratch or fresh ingredients were used, the degree of effort or creativity invested if convenience foods were used, and whether or not heat was used( Reference Short 16 , Reference Wolfson, Bleich and Smith 38 ).
Our findings related to cooking frequency are similar to the estimate from the National Health and Nutrition Examination Survey (NHANES) of 5·0 d/week( Reference Virudachalam, Long and Harhay 10 ). However, this general measure of cooking frequency in NHANES masks important differences in more specific cooking practices; the present results indicate that the frequency of using packaged/boxed or frozen products is higher than that of using scratch/fresh ingredients. The manner in which people answer the question of how frequently they cook is related to how they conceptualize the meaning of cooking. To some extent this is expected; if one defines cooking as including all food preparation regardless of the ingredients or whether heat is involved, one would report cooking more frequently than a person who defines cooking more narrowly as including only scratch ingredients. This suggests that general measures of frequency of cooking may simplify the diversity of cooking practices and may have limited usefulness in what they reveal about the specifics of what a person is actually cooking or eating if they do not define or specify the kind of cooking being measured. This is a particularly important consideration for the design of epidemiological surveys and evaluation instruments for the growing number of cooking class programmes implemented in schools, federal nutrition assistance programmes and other community programmes( 27 , Reference Condrasky, Griffin and Catalano 39 – 44 ).
In conceptualizing cooking, for some, the type of food being prepared is of primary importance (i.e. whether the food is fresh or processed/packaged) and for others, the method of preparation is of primary consideration (i.e. whether or not food is heated and if so, whether the stove, oven or microwave is used). In both cases, people seem to distinguish between a traditional or literal interpretation of cooking and a more flexible or inclusive definition. However, even people who take the more traditional view of what counts as cooking use convenience foods, other ‘short cuts’ and cold food preparation in their everyday lives, but may not consider those ‘every day meals’ to be cooking( Reference Short 16 , Reference Wolfson, Bleich and Smith 38 ). These differences in cooking perceptions and behaviour have important implications for public health messages promoting cooking for a healthy diet( Reference Wolfson and Bleich 11 ) in schools and for programmes such as SNAP( Reference Levy and Auld 41 , 44 , Reference Thomas and Irwin 45 ). Promoting home cooking as a healthy practice may not inspire changes in behaviour if people already perceive that they are cooking frequently. Messages that focus on scratch ingredients only may not seem achievable to a wide audience. Especially for those who dislike cooking or lack confidence in their ability to cook, messages promoting more frequent cooking may not resonate. Among this group, messages about cooking and/or cooking classes might instead emphasize cooking with convenience foods that support a healthy diet (e.g. pre-cut and portioned vegetables, par-cooked rice or pastas, and pre-portioned meals with fresh ingredients and ready-made sauces) as well as building confidence and enjoyment in the process of preparing these foods. Making these products more affordable and available in underserved neighbourhoods could facilitate consumption of a healthier diet without requiring people to change their food preparation practices dramatically.
More research is needed to explore broader attitudes and perspectives among people who perceive cooking in different ways. Specifically, it will be important to further explore distinctions people make about what counts as cooking and why, especially among those who include using convenience foods in their definition of cooking. Insights in this area will be important for the development of interventions to build cooking confidence and mitigate feelings that cooking is burdensome and/or stressful. More tailored interventions could be more effective at helping people cook (however they define the term) more healthfully and frequently. Research on how food policy and nutrition experts perceive the meaning and importance of cooking is also needed. Messages about cooking (often defined as scratch/fresh ingredients) being critical for both human and environmental health are common( Reference Pollan 46 ). However, other resources (such as the cookbook for SNAP participants( 47 )) reflect a more flexible and inclusive view of cooking. More research is also needed to examine demographic trends and patterns in cooking perceptions and how people learn to cook. In addition, cooking knowledge and skills as well as differing experiences with learning how to cook may be related to how people perceive what it means to cook. Further research is needed to understand these relationships as well as how cooking perceptions and behaviours are related to dietary intake and health outcomes.
The present study has several limitations. First, our data are cross-sectional and do not allow for causal inferences about the relationship between cooking perceptions, confidence, attitudes or behaviours. Second, web-based surveys have been criticized for incomplete coverage or selection( Reference Couper 48 ). This concern is mitigated somewhat by GfK’s recruiting strategy and by the fact that the firm provides computers and Internet access to those without it. Third, selection bias is a concern because 13·9 % of those invited to be part of GfK’s survey panel did so, and of those panel members who were asked to complete our survey, only 73 % did so. However, the comparison of our sample with national rates alleviates some of this concern. Fourth, the survey did not assess cooking skills or knowledge, which could be important for understanding cooking perceptions, confidence and behaviours. In addition, our cooking perception measures did not comprehensively capture the full spectrum of all possible foods and preparations that could be important for some people’s definitions of cooking. For example, we did not cover specific techniques such as poaching, roasting or steaming nor did we ask about specific recipes or adaptations to packaged products. Fifth, we intentionally combined healthy (e.g. frozen vegetables) and unhealthy (e.g. frozen French fries and chicken nuggets) ingredients in some measures so that the focus would be on the mode of preparation rather than the healthfulness of the items. However, if, for some respondents, healthfulness is an important consideration of whether something was ‘cooked’ this could have biased responses to these measures. Finally, these results were all self-reported and the behavioural data are potentially subject to self-reporting and social-desirability bias.
Conclusion
In conclusion, people perceive the meaning of cooking in three primary ways – the use of convenience foods, scratch ingredients and not using heat – which are related to their cooking confidence, attitudes and behaviours. Public health messages that aim to promote healthy cooking should consider these diverse perspectives about cooking to enhance effectiveness and reach. In a modern society in which time is scarce and convenience is a priority, a focus on scratch cooking only may be misplaced. Rather, promoting healthy cooking while incorporating convenience foods and quick preparations may be a more promising approach. More research is needed to develop more specific and accurate measures to understand cooking behaviours. A greater understanding in these areas will be important for improving diet quality and decreasing the burden of diet-related diseases in the USA.
Acknowledgements
Financial support: This work was supported by a Center for a Livable Future Lerner Fellowship and a Directed Research Grant from the Johns Hopkins Center for a Livable Future. The funders had no role in the design, analysis or writing of this article. Conflict of interest: None. Authorship: J.A.W. conceived the study and developed the hypotheses. J.A.W. drafted the survey instrument and all authors contributed to the final version of the survey. J.A.W. performed the statistical analysis. All authors contributed to the interpretation of the study findings. J.A.W. drafted the manuscript and all authors contributed to the final draft. J.A.W. had full access to all of the data in the study and takes full responsibility for the integrity of the data and the accuracy of the analysis. Ethics of human subject participation:This study was approved by the Johns Hopkins Bloomberg School of Public Health Institutional Review Board.
Supplementary material
To view supplementary material for this article, please visit http://dx.doi.org/10.1017/S1368980015003778


