Undernutrition in a child’s ‘first 1000 days’, from conception to their second birthday, poses significant detrimental effects on physical and cognitive health, as this period is critical to brain development and linear growth(Reference De Onis, Dewey and Borghi1). Undernutrition is defined by three main indicators – underweight, stunting and wasting – which represent different histories and pathways of nutritional insult to the child.
Underweight children weigh less than they should at their age, indicating a history of poor health and nutrition that includes recurrent illness and/or undernourishment. Stunted children suffer from growth retardation as a result of sustained nutritional deprivation, and this often results in delayed mental development, reduced intellectual capacity and poor school performance(Reference De Onis and Branca2). Wasting, defined as low weight-for-height, is usually a consequence of insufficient food intake or a high incidence of infectious diseases, especially diarrhoea. Wasting impairs the immune system and can lead to increased severity and duration of and susceptibility to infectious diseases(Reference Scrimshaw and SanGiovanni3).
Worldwide, 45 % of deaths among children under 5 years of age are linked to undernutrition(Reference Black, Victora and Walker4). While global levels have declined, undernutrition continues to be a significant problem in sub-Saharan Africa. Stunting is actually on the rise, with the number of stunted children increasing by a third between 1990 and 2013(5). In Kenya, according to the 2014 Kenya Demographic and Health Survey, 26 % of children under 5 years are stunted. Kitui County falls above the country mean, with 46 % of children under 5 years being stunted(6). Two recent studies on children aged 6–23 months in Kitui, however, report much lower levels of undernutrition in this age group, with 13 % stunted, 11–12 % being underweight and 4 % experiencing wasting(Reference Kimiywe and Chege7,Reference Ferguson, Chege and Kimiywe8) .
Undernutrition in Kitui may be linked to dietary diversity. There, only 17 % of children consume at least four out of seven key food groups at the end of the lean season, the recurring seasonal dry spell(Reference Ferguson, Chege and Kimiywe8). A systematic review by Akombi et al.(Reference Akombi, Agho and Hall9) of forty-nine studies in sub-Saharan Africa indicates that a myriad of factors may exacerbate childhood undernutrition, including the mother’s education level, the child’s age, low wealth status, initiation of complementary feeding, being male, unimproved source of drinking-water and diarrhoea, among others. Few studies, however, have examined low birth weight (LBW) specifically, as records are difficult to obtain. Those that do suggest that this is a significant risk factor for undernutrition in early childhood(Reference Abuya, Ciera and Kimani-Murage10–Reference Willey, Cameron and Norris14).
The aims of the present study were to undertake a comprehensive evaluation of levels of undernutrition and its major predictors, including caregiver education and LBW, in a sample of children aged 0–23 months across Kitui and in three neighbouring sub-counties of Machakos County; and to provide recommendations for both the design of prevention programmes and future research.
Methodology
Study area and participants
The cross-sectional study took place in January 2018. January is a dry season that follows the short, rainy and planting season that occurs between October and December. The study area covered all eight sub-counties in Kitui County and three neighbouring sub-counties (Yatta, Masinga and Mwala) in Machakos County. These eleven sub-counties belong to Kenya’s arid and semi-arid region and are in south-east Kenya, approximately 160 km from Nairobi. Kitui is the sixth-largest county and covers an area of 30 497 km2, more than 6000 km2 of which is occupied by Tsavo East National Park. The population in Kitui and Machakos is predominantly of the Kamba ethnic group, known historically as long-distance traders and hunters and gatherers. The Kamba now pursue farming, mining, livestock rearing and formal employment. Most are Christians, but there are communities of Kavonokya, a religious sect that (notably in relation to the present study) does not use formal health-care services.
Study participants are part of a baseline for an evaluation of the Nutritional Improvements through Cash and Health Education programme (NICHE). More specifically, participants comprise a cross-sectional sample of children aged 0–23 months residing in beneficiary households of the Government of Kenya’s cash for orphans and vulnerable children (CT-OVC) social protection scheme. These households were identified through the national CT-OVC registry list and the local CT-OVC beneficiary committees, which assist in the selection of beneficiaries. All households that met the inclusion criteria (CT-OVC beneficiary; a child aged 0–23 months) were sampled, such that the sample is comprised of all eligible children. The initial list comprised 1592 households but on visiting households, not all were found to meet the inclusion criteria.
The study was approved by AMREF Health Africa in Kenya and meets all criteria for minimising harm to participants.
Data collection
A total of 967 households with 1062 children aged 0–23 months were included in the study. This sample was determined based on the total number of households that met the inclusion criteria (CT-OVC beneficiary and a child aged 0–23 months) in the study area. Information on households (household structure and wealth indicators), children (feeding practices and health status), caregivers (age, educational level achieved and employment status) and water and sanitation facilities (source of drinking-water and type of latrine in the household) was obtained through face-to-face interviews with the child’s caregivers. This information was collected by enumerators through Android-operated tablets using Kobo, an open-source survey form and data capture application, and subsequently exported to Excel and analysed with the assistance of Python scripting. The enumerators were trained prior to the survey on how to administer the questionnaire and how to collect the anthropometric data.
Children were physically assessed on-site to collect anthropometric indices. Length was measured with a Shorr board, an adjustable measuring board calibrated in centimetres. Most children were measured lying down (recumbent length) on the board, with only a few measured standing on the board. Weight was assessed using a calibrated electronic weighing scale, which allows weight to be measured while the child is being held by an adult.
Written informed consent was obtained from every household before it was allowed to take part in the survey, and consent was obtained from caregivers before the child’s measurements were taken. Most household interviews were conducted in the local language, Kamba, with the remaining in Kiswahili.
Forty-one children from thirty-seven households were excluded from the study because the caregivers did not consent to the child’s anthropometric measurements being taken. However, since three of these children belonged to a household that had more than one child and the other child/children did have measurements taken, only thirty-four households were excluded. The complete anthropometric data set for analysis was therefore 1021 children aged 0–23 months in 933 households.
Outcome and explanatory variables
The outcome measures of interest were childhood undernutrition metrics. Length-for-age Z-score (LAZ) was used as an indicator of stunting, weight-for-age Z-score (WAZ) for underweight and weight-for-length Z-score (WLZ) for wasting. Children with length-for-age, weight-for-age or weight-for-length below −2 sd from the respective median of the WHO reference population(15) (i.e. LAZ, WAZ or WLZ <–2) were considered to be stunted, underweight or experiencing wasting, respectively. WHO guidelines recommend that data are excluded if a child’s LAZ is below −6 or above +6, if WAZ is below −6 or above +5, and if WLZ is below −5 or above +5. Such extreme values may reflect data entry errors. Data on seventeen children were excluded since the Z-score was not within the accepted range. The number of children then reduced to 1004 in 919 households. The outcome measures were expressed as dichotomous variables, coded as ‘1’ for children who had Z-score < −2 and ‘0’ otherwise.
The explanatory variables covered characteristics of the caregiver, the household and the child. The caregiver characteristics were grouped into three categorical variables for age (<25 years; 25–34 years; ≥35 years), two for educational level (none and primary only; secondary or above) and two for the employment status (employed; not employed). Household characteristics focused on size (1–6 members; ≥7 members), number of young children under 2 years of age (one child; two or more children), sex of the household head, and two wealth indices related to ownership of at least one radio and at least one cow.
Water and sanitation facilities of the household were assessed through the type of latrine and the main source of drinking-water. Sanitation facilities were assessed as either improved (flush toilet; ventilated pit latrine; pit latrine with slab; composting toilet) or unimproved (pit latrine; bucket; hanging toilet/latrine; no facility/bush/field; any other). The main source of household drinking-water was also categorised into either improved (piped water into dwelling or yard; public tap; borehole; protected dug well; protected spring; rainwater collection) or unimproved (unprotected dug well; unprotected spring cart with small tank; tanker-truck; surface water, e.g. river, dam, etc.)(16).
The child characteristics were sex, age (0–11 and 12–23 months), reported morbidity in the past 2 weeks related to diarrhoea (watery stool at least three times in a period of 24 h) and respiratory infection (a combination of a cough, fever and fast breathing), and exclusive breast-feeding for less than 6 months. This information was available for all 1004 children in the study sample.
Birth weight information was available for 858 children (85 %) in 790 households. Most birth weights (73 %) were recorded from the Mother and Child Health booklet provided to all new mothers attending health facilities with their newborns. LBW was defined as per the universally accepted classification of a birth weight below 2·5 kg(17).
Dietary diversity was assessed in children aged 6 months or above. In this age group, 753 children had complete food consumption information (98 % of the 769 aged 6 months or above). We assessed dietary diversity in terms of consumption of individual food group types, based on the minimum dietary diversity indicator calculation guidelines described by WHO(18). The seven food group types were: (i) grains, roots and tubers; (ii) legumes and nuts; (iii) dairy products; (iv) flesh foods and organ meats; (v) vitamin A-rich fruits and vegetables; (vi) eggs; and (vii) other fruits and vegetables. A value of 1 was given for the child’s consumption of any of the food groups within 24 h, while 0 was assigned for non-consumption. These figures were then summed to obtain a value – the dietary diversity score (DDS) – ranging from 0 to 7 for each child. In the analysis, this was expressed as a dichotomous variable for a given child, reflecting a low DDS (three food groups or fewer; DDS ≤ 3) or the minimal acceptable DDS (four food groups or more; DDS ≥ 4).
Caregivers of children aged 6 months or above were also asked to report on the breast-feeding practices of children up to the age of 6 months. Information was available for all 769 children in this age group.
Analytical approach
First, summary descriptive statistics were computed for the percentage stunted and the percentage underweight overall, then presented disaggregated by the various covariates associated with the child, caregiver and household characteristics.
Second, the strength of association between these covariates and undernutrition metrics was explored through the crude unconditional maximum likelihood estimate OR, according to the Fisher exact test, which allows for small expected frequencies in one or more cells(Reference Sheskin19). The 95 % CI on these OR were determined, as described by Altman(Reference Altman20), using the natural log of the OR and the se. Finally, multivariate logistic regression analysis was performed with all covariates that had a significant crude OR at the 10 % level.
A backward stepwise approach was adopted where variables that were not significant (i.e. P > 0·05) were eliminated from the input variables and the regression repeated until all variables had been tested. The statsmodel Logit function was used and adjusted OR for these significant covariates were presented. The logistic regression was performed on the data set that contained the complete LBW data (n 858), rather than using imputation to fill in missing values into the original data set of 1004 children. Two models were subsequently run, the first on all ages, with age as an explanatory variable, and the second only with children aged 12–23 months, with age not as a covariate.
Results
Sample description
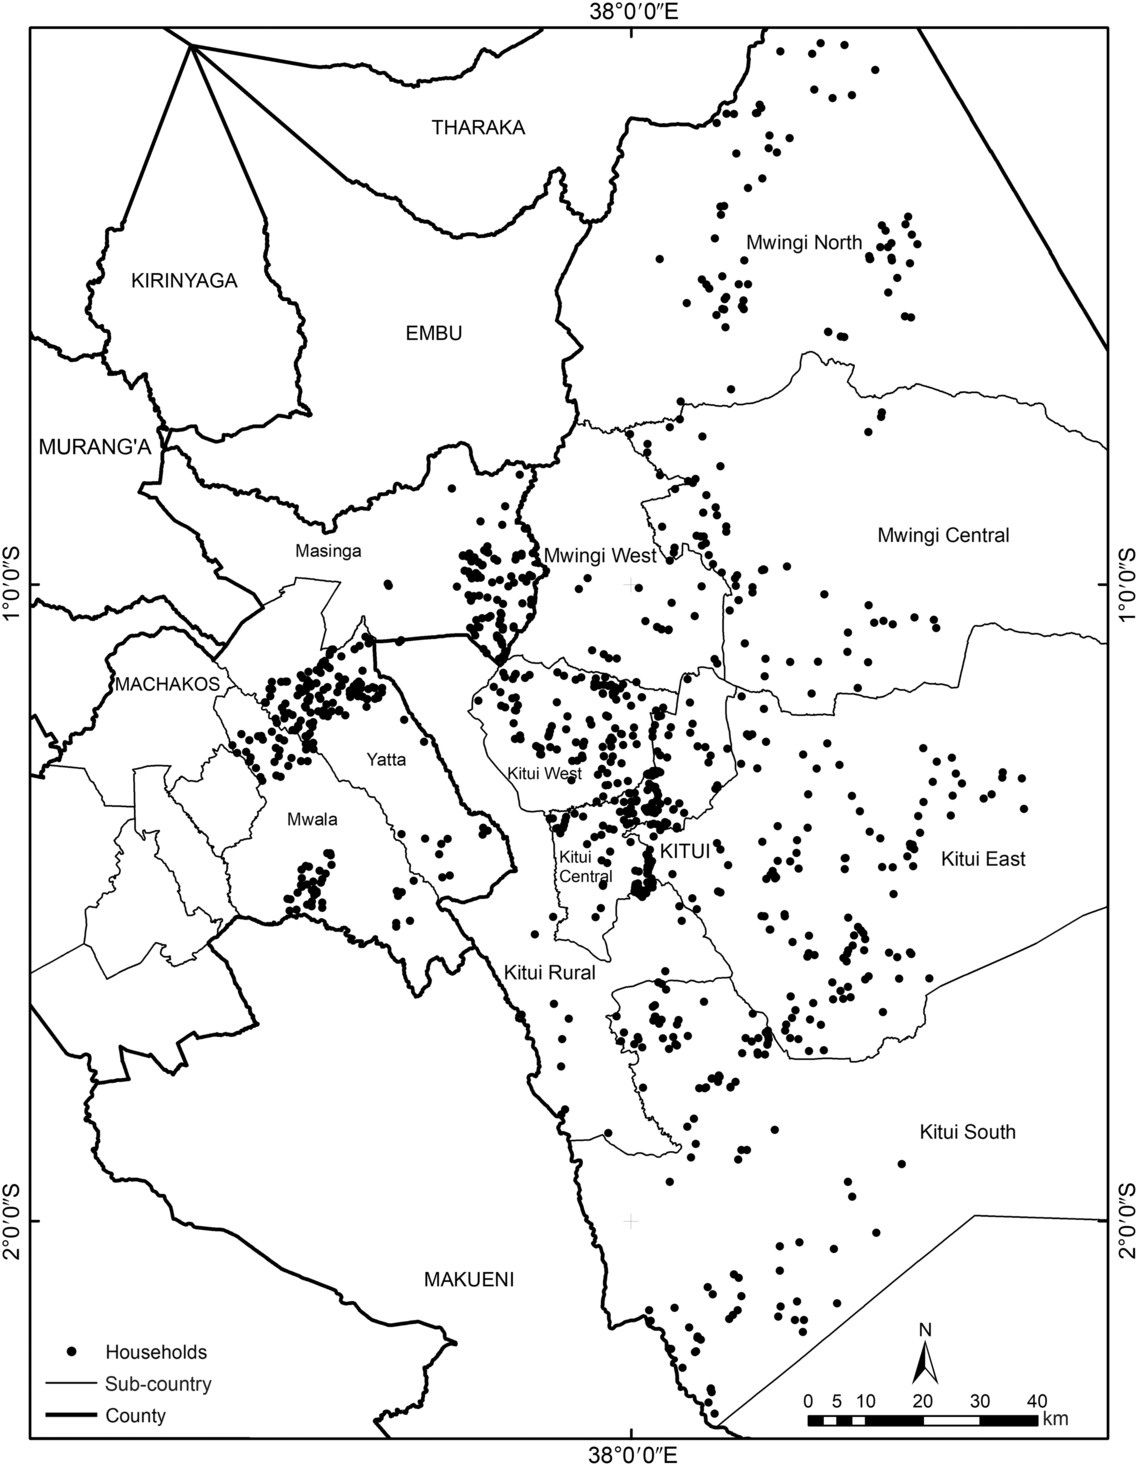
Of 1004 children aged 0–23 months in the survey, 501 (50 %) were boys. The children were distributed fairly evenly across the two age groups, and the mean age was 12 months for both girls and boys. The households sampled resided in eleven sub-counties (see Fig. 1).

Fig. 1 The location of all 967 households in the study sample, Kitui and Machakos counties, south-east Kenya
Most households (83 %) had only one child under the age of 2 years. Of the remainder, eighty-two had two children and three households had three children. In households with more than one child, eleven had a single set of twins and one household had triplets. The caregivers interviewed (n 979) were predominantly the children’s mothers (82 %). Grandmothers were the main caregivers for 140 children (14 %) and 2 % of caregivers did not specify their relationship.
Most households were Christian. Four were Kavonokya, three were Muslim and one unknown. The average household size was 8 and ranged from 2 to 19 members.
Descriptive statistics for undernutrition
The prevalence of stunting among the 1004 children was 23 %, wasting 6 % and 10 % were underweight. Seven per cent of children were both underweight and stunted. As wasting levels were so low, no further analysis was undertaken in this regard; the remainder of the paper is thus devoted to exploring the prevalence and predictors of stunting and underweight only.
Table 1 presents the characteristics of the study sample; it outlines percentages of stunted and underweight children by possible explanatory variables in absolute values.
Table 1 Characteristics of the study sample and levels of stunting and underweight in children aged 0–23 months (n 1004), Kitui and Machakos counties, south-east Kenya, January 2018
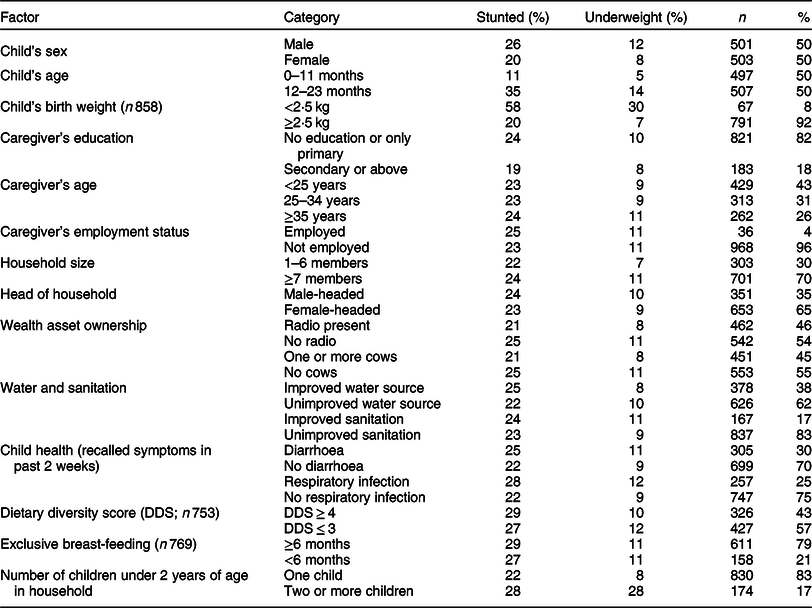
The results demonstrate that a higher percentage of boys were stunted compared with girls, and that stunting was higher in children during the second year of life. These patterns by age and sex were mirrored by the underweight outcome (WAZ < –2). The child’s birth weight was available only for 858 children and only 9 % had LBW (less than 2·5 kg). However, 30 % of LBW children were underweight and 58 % were stunted, more than double the values observed in children with birth weight of 2·5 kg or more.
Most caregivers had either no education or only primary education, with just 18 % achieving secondary education or above. Although the prevalence of stunting was lower for children with caregivers who had secondary schooling (19 v. 24 % for those with none), no differences were observed for underweight. Only 4 % of caregivers had employment. The mean age of caregivers was 30 years and most were younger than 35 years (74 %). There were no major differences in undernutrition of the child by caregiver age.
Households were large, with 70 % having seven or more members. Compared with those with six or fewer members, these larger households had a marginally higher prevalence of stunted (24 v. 22 %) and underweight children (11 v. 7 %). Seventeen per cent of the children belonged to a household with two or more children under the age of 2 years. These children were more likely to be stunted and underweight.
The majority of households were female-headed (65 %). Female household heads were, on average, 57 years of age and 38 % were older than 60 years, suggesting that many household heads are grandmothers. Levels of undernutrition were similar in female- and male-headed households. According to local knowledge, cow and radio ownership are generally believed to wealth proxies in this rural population. Nearly half of the children resided in households that owned a key wealth asset, either a radio and/or at least one cow, and 25 % of these households had both. In these wealthier households, the levels of undernutrition were consistently lower. There were also marginally lower levels of undernutrition in the 17 % of households with improved sanitation facilities and in the 38 % with improved sources of drinking-water.
Diarrhoea and/or respiratory symptoms in the past 2 weeks were reported for over a quarter of children. In these, the proportion of stunted and underweight children was higher. Twenty-eight per cent of those with a recent respiratory infection were stunted compared with 22 % with no reported symptoms, and 12 % of those with a recent respiratory infection were underweight compared with 9 % without.
Only 57 % of the 753 children with dietary diversity information had a minimally acceptable DDS of at least four food groups. The mean DDS was 3·7 (sd 1·3). Ninety-six per cent of children had consumed a cereal, root or tuber, and this was most commonly ugali (75 %) or porridge (72 %). Although many had consumed a vitamin A-rich fruit or vegetable, for 60 % this was only mango. Similarly, the range of food items being consumed under fruit and vegetables was limited, with most consuming only tomato or onion (77 % of the 94 % of children who consumed this food group). The diversity of food items for the 32 % who had consumed legumes and nuts was the most varied: dried beans (65 %), peas (e.g. chickpeas, cowpea, green peas, pigeon peas; 41 %) and green grams (15 %). More than half of children had consumed milk (55 %), the major food item under dairy products as only 4 % had consumed yoghurt or cheese. Eggs and ‘flesh foods and organ meats’ were consumed by 11 and 14 % of children, respectively. The DDS in children was similar across the different measures of undernutrition.
Most children aged 6–23 months were exclusively breast-fed for the first 6 months of life, with only 21 % given complementary foods before their 6-month birthday. Differences in the prevalence of stunting and underweight in these children were also marginal, as reported in absolute terms.
Crude OR for stunting and underweight
Despite a range of variables showing differences in undernutrition metrics, the crude OR results demonstrate that child sex, child age, child birth weight and having two or more children under the age of 2 years in the household were significantly associated with a child’s nutritional status at the 5 % confidence level (Table 2).
Table 2 Associations between individual factors and stunting/underweight, based on univariable analysis, among children aged 0–23 months (n 1004), Kitui and Machakos counties, south-east Kenya, January 2018
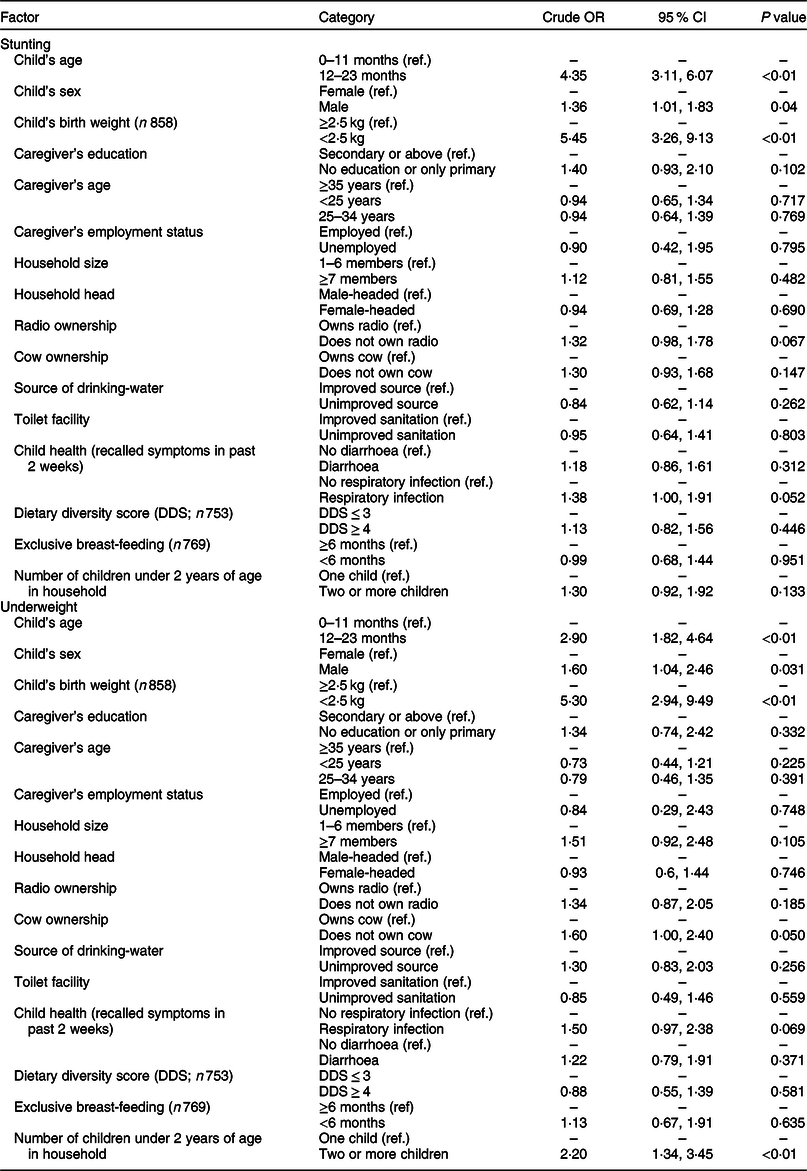
Ref., reference category.
Notably, LBW increased a child’s risk of being stunted and underweight by more than five times; and children older than 11 months were four times more at risk of being stunted and three times more at risk of being underweight. Being born in a household where there were two or more children under 2 years old doubled the risk of being underweight, and being male increased the risk of being stunted 1·4 times and underweight 1·6 times. LBW, therefore, appears to be the most crucial factor associated with both being stunted and underweight as an infant.
For stunting, radio ownership, caregiver education level and recent respiratory infection showed a significant higher risk at the 10 % level with crude OR of 1·3–1·4. For underweight, the OR were marginally higher at 1·5–1·6 for cow ownership, recent respiratory infection and residing in a household with seven or more members.
Multivariate logistic regression
The logistic regression on stunting and underweight was performed only using those explanatory variables significant at the 10 % level in the univariate analysis and only on the sample with complete birth weight data. The 146 children without birth weight data had a similar characteristics profile as the main study sample in Table 1, suggesting no bias in excluding these from the multivariate logistic regression. The variables included were child age, child sex, LBW and respiratory infection in the last 2 weeks for both stunting and underweight. In addition to these, radio ownership and caregiver education were included for stunting, and cow ownership and household size for underweight.
The variables significant at the 5 % level in the multivariate model using backward stepwise regression are summarised in Table 3. The analysis showed that LBW and being aged between 12 and 23 months were significantly associated with being underweight and stunted. In addition to these, residing in a household that owned at least one cow and in a household with two or more children under the age of 2 years were also significantly associated with being underweight (Model 1, n 858). The OR were highest for age (range 2·88–4·06) and LBW (4·36–4·93), and lowest for the wealth proxy (1·8) and having more than one young child (1·9). When the regression was run only on the data for 12–23-month-olds (Model 2, n 438), excluding age as a covariate, being male was now also significant at the 5 % level for stunting and having more than one young child was no longer significant at the 5 % level for being underweight (Table 3).
Table 3 Predictors of stunting and underweight, based on backward logistic regression analysis*, among children aged 0–23 months, Kitui and Machakos counties, south-east Kenya, January 2018
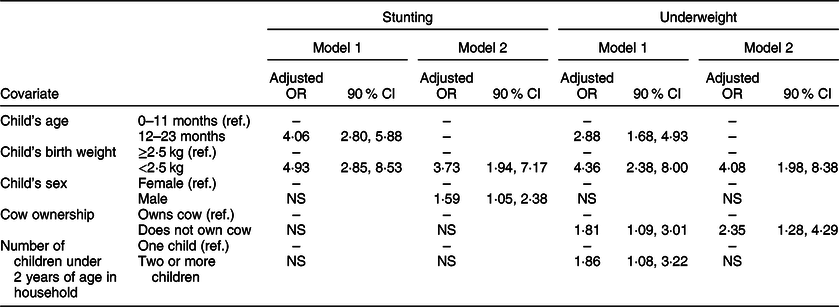
Ref., reference category.
* Adjusted OR (and 90 % CI) for the covariates in the logistic models for stunting and underweight for all ages (Model 1, n 858; all with birth weights) and for 12–23-month-olds excluding age as a covariate (Model 2, n 438).
Discussion
In the present study based in south-east Kenya, LBW was the most important risk factor for both stunting and being underweight in children aged 0–23 months. Children with a birth weight under 2·5 kg were four to five times more likely to suffer undernutrition than those with a normal birth weight. Most recent studies in Kenya that assess possible predictors of undernutrition fail to consider birth weight(Reference Bloss, Wainaina and Bailey21–Reference Shinsugi, Matsumura and Karama23). However, similar to our study, in their assessment of children aged 0–42 months residing in the slums of Nairobi, Abuya et al.(Reference Abuya, Ciera and Kimani-Murage10) found LBW to be the most significant risk factor for stunting. Weighing less than 2·5 kg at birth correlated more strongly with below-average height and weight than any other characteristic. It is difficult to obtain reliable information on birth weight and, unless documented on a health card or a recent birth, few mothers can recall the exact value. In large surveys, including the 2010 Kenya Demographic Health Survey, 72 % of records are missing data for birth weight(Reference Kariuki, Gichuhi and Wanjoya24), and a recent study in Kenya used ‘small birth size’ rather than actual birth weight in its analysis, as half of records had missing birth weight information(Reference Gewa and Yandell25). While ‘small birth size’ is highly subjective, it is used in many studies assessing factors associated with undernutrition(Reference Akombi, Agho and Hall9).
Based on the findings of the present study and those of Abuya et al.(Reference Abuya, Ciera and Kimani-Murage10), it is evident that investing in accurately assessing the contribution of LBW to undernutrition may lead researchers to identify this as a key risk factor, with important implications for the design of programmes to alleviate undernutrition. With LBW increasing the risk of stunting and underweight by four to five times in our study, improving birth weight outcomes and growth in utero may be highly effective in improving the nutritional status of young children. This could be achieved by targeting pregnant women with interventions such as bed nets and sulfadoxine–pyrimethamine prophylaxis to prevent malaria(Reference Guyatt and Snow26), along with promoting healthy diets and access to health services in adolescence, while pregnant and after giving birth.
Although LBW is an important factor, it affected only 9 % of the children in the present study, while many more remain stunted and underweight. Other risk factors, while not as significant as LBW, remain important factors associated with undernutrition in this study population. The most significant is the age effect, where children aged 12–23 months are three to four times more likely to be stunted and underweight than those aged 0–11 months. In other studies in Kenya, children in their second (sometimes, third) year of life have also been shown to be more at risk of undernutrition than younger or older children(Reference Altman20–Reference Badake, Maina and Mboganie22). The general consensus is that the increased risk in children aged 12–23 months is related to the transition from breast-feeding to weaning, when nutritious breast milk is replaced by high-starch and low-protein foods, and children lose passive immunity from their mothers.
Previous studies in Kenya show that children introduced to foods early are more likely to be underweight and stunted(Reference Bloss, Wainaina and Bailey21,Reference Onyango, Koski and Tucker27) , and that dietary diversity can be associated with undernutrition outcomes(Reference Onyango, Koski and Tucker27), but not consistently(Reference Badake, Maina and Mboganie22). In the present study, children as young as 2 months had been given cereals, but no significant association was found between undernutrition metrics and exclusive breast-feeding in the first 6 months. Similarly, dietary diversity scores were not significantly different in children who were stunted and underweight compared with those who were not. The present study did not, however, assess the quantities of different food types that were consumed. If many food groups are given, but in small quantities, diversity scores may be less nutritionally meaningful. Although dietary diversity is a relatively easy-to-measure proxy for nutrient intake, more research may be required to clarify relationships between dietary diversity and nutrient intake, adequacy and density(Reference Arimond and Ruel28). However, given the information available on the complementary food practices in this study population, it is unclear what action could be given to alleviate these higher risks in children aged 11–23 months.
Interestingly, when age was removed as a covariate in the logistic regression, being male emerged as an important risk factor for stunting (OR = 1·6). A meta-analysis by Wamani et al.(Reference Wamani, Åstrøm and Peterson29) of sixteen Demographic and Health Surveys in ten sub-Saharan African countries showed that the prevalence of stunting in children under 5 years of age is consistently lower among females than males. This suggests that boys may be more vulnerable to health inequities than their female counterparts, particularly in the poorest groups. This male–female malnutrition imbalance is also apparent in recent studies(Reference Abuya, Ciera and Kimani-Murage10,Reference Gewa and Yandell25) . Wells(Reference Wells30) argues that male children are more vulnerable than females, particularly in poor environments, partly because natural selection may favour female offspring survival. Cultural and behavioural factors may also play a part, as female children spend more time with their mothers and receive more attention than male children who may be spending more time out of the house(Reference Gewa and Yandell25). Understanding the mechanisms behind this gender effect could help in designing educational messages for caregivers.
Although being male had an increased risk of being underweight, this was not significant for 12–23-month-olds in the logistic model, where only LBW and cow ownership remained significant risk factors. In this study population, livestock ownership is a robust wealth proxy for a household and it is not surprising that wealthier households have healthier children. The question is what could be done to improve the nutritional status in poorer households. When the analysis was run with all age groups, as well as cow ownership, having two or more children under the age of 2 years was a significant risk factor. These two factors individually increase the risk of children being underweight by 1·8 times. Encouraging households to increase the birth spacing between siblings or reduce the number of children overall could go some way in improving the nutritional outcomes of the children they have.
Strengths and limitations
The present study covers a large, widely dispersed and robust sample of children under 2 years of age in a poor area of south-east Kenya, reporting the strength of association between key metrics, including household and demographic characteristics, and nutritional status. In particular, fieldwork yielded data on LBW. The limitations are that the data are cross-sectional and from a single point of time in a geographical location where food availability is highly seasonal, thus yielding associative rather than causal relationships. Additionally, we were unable to gather data on potential confounders, such as parasitic infection, HIV status, or mother’s stature and BMI. Furthermore, the study sample consists solely of beneficiary households of the CT-OVC social protection programme, a non-random, selective slice of the population that represents the area’s most vulnerable households and hence not fully representative of the general population. Many are also female-headed and are very large in size.
Conclusion
In the present study, LBW was a major driving factor in increasing the risk of undernutrition. Future studies investigating predictors of stunting and underweight in children should include this metric in their analyses. Undernutrition prevention programmes could potentially reduce adverse birth weight outcomes by increasing their targeting of pregnant women and the development of the child in utero. Additionally, the higher risk of undernutrition in the second year of life suggests a critical transition period from exclusive breast-feeding to food that requires more support for the caregiver in making correct decisions related to the timing, adequacy, safety and proper complementary feeding practices. Although wealth status is important, it cannot fully explain these age effects. Disentangling the factors responsible for these age effects, and the factors that predispose male children to an increased vulnerability of stunting, requires further research that goes beyond traditional caregiver status metrics into behavioural and socially driven decision making.
Acknowledgements
Acknowledgements: The authors would like to acknowledge the contributions of Perry Ndila, Flavia Della Rosa, Cecilia Thiga and Hophine Emaseh in the training and supervision of data collection, and the local enumerators from Kitui who undertook the household visits. They would also like to extend thanks to Humphrey Mosomi (UNOPS Nutrition Support Officer, East Africa Hub-Lower Eastern), Philip Nzenge (County Coordinator, Department of Children’s Services, Kitui County), Salome Muthama (County Coordinator, Department of Children’s Services, Kitui County), Samuel Ochieng (Deputy County Coordinator, Department of Children’s Services, Kitui County), Jackson Matheka (County Nutrition Coordinator, Kitui), Mary Makau (County Nutrition Coordinator, Machakos) and Veronica Mwangangi (County Community Strategy Focal Point, Machakos) for their support of the study; as well as Joan Gathu for her help with the map. Financial support: The European Union funded the Nutritional Improvements through Cash and Health Education (NICHE) programme as part of a grant to the Government of Kenya to specifically enhance the nutritional status of pregnant and lactating women and children under 5 years of age (grant number FED/2014/348-408). The European Union had no role in the design, analysis or writing of this article. Conflict of interest: None. Authorship: H.G. oversaw and directed the study design, data analysis and report writing. F.M. and P.M. managed the database and ran the analyses. A.R. contributed to the writing of the manuscript. Ethics of human subject participation: This study was conducted according to the guidelines laid down in the Declaration of Helsinki and all procedures involving human subjects were approved by the AMREF Health Africa ethics and scientific review committee (reference AMREF-ERSC P294/2016). Written informed consent was obtained from all subjects.