Demographic changes are affecting our meal patterns such as when we eat, where we eat and who we eat with( Reference Papier, Jordan and D’Este 1 , Reference Arruda, da Silva and Kac 2 ). Even though a healthy diet is an important aspect of a healthy life, maintaining a healthy diet is not an easy task in today’s society. An increase in dual-income households and long work hours are attracting individuals and families to dine out, take out or order in from restaurants( Reference Zang, Luo and Wang 3 ). Likewise, the proportion of one-person households and dual-income households is expanding and an increasing number of individuals are enjoying eating out rather than cooking their own meals in South Korea( Reference Kwon and Ju 4 ). While the variety of menus and convenience of eating out or ordering in have been improving, it is still generally difficult to maintain a well-balanced diet from available restaurant menus.
In fact, dining out alone has become popular in recent years, especially among the younger generation, and many restaurants nowadays have customized menus and special seating for customers who come alone( Reference Kant and Graubard 5 ). Moreover, delivery service for restaurants has improved significantly; some companies specialize in delivering takeout meals where individuals can order food from any restaurant and even have meals delivered to an outdoor location such as a public park( Reference Hillier-Brown, Summerbell and Moore 6 ).
The popularity in eating out is due to its convenience, mainly because it is the best option for saving time. However, the general guideline is to avoid dining out frequently because it is difficult to consume all the necessary nutrients that are recommended for a healthy diet.
The dine-out culture of Korea is unique because Korean restaurants do not serve full-course meals and most restaurants that serve main dishes do not offer dessert. A main menu is usually served with several side menus, but dessert menus are often skipped because they cannot be consumed in one seating. While Korean meals use various grains, meats and vegetables, it is very rare for fruit and dairy products to be used as ingredients. Hence, a critical concern with the Korean dine-out culture is the shortage of fruit and dairy products that results in imbalance of nutritional intake.
Several studies have reported dine-out patterns and nutritional adequacy or health outcomes. A systematic review described that eating out of home was associated with a higher total energy intake and energy contribution from fat in the daily diet, as well as with a lower intake of micronutrients, particularly vitamin C, Ca and Fe( Reference Lachat, Nago and Verstraeten 7 ). Watts et al. have shown that more frequent dinner meals prepared away from home and eating out with friends were associated with lower scores on the Healthy Eating Index adapted to the Canadian context among adolescents with overweight or obesity( Reference Watts, Valente and Tu 8 ). Korean dine-out meals are known to be high in Na and low in vitamins and minerals( Reference Oh, Kim and No 9 ). National survey data showed that individuals in the non-homemade meal group had higher energy intakes, with higher percentages of energy from protein and fat and lower intakes of dietary fibre, P, K, niacin and vitamin C, than those in the homemade meal group among Korean adults( Reference Lee, Song and Cho 10 ). Dining out on a regular basis might have long-term effects on one’s health if one is not carefully selecting what to eat each day.
Therefore, the present study was conducted to discuss the nutritional shortcomings in Korean dine-out menus using linear programming (LP) and to suggest solutions to meet the recommended nutritional intake for people who habitually dine out using optimization models. Additionally, the study examined the possibility of application of LP as an approach for selecting a healthy diet plan.
Methods
Database for dine-out menu extraction
Korean dine-out menus and the nutritional information were taken from the nutrient composition tables for dine-out menus developed by the Ministry of Food and Drug Safety( 11 – 14 ) and the nutrient database from Computerized Analysis Program (CanPro 5.0)( 15 ). Acceptable macronutrient distribution ranges of macronutrients such as carbohydrate, protein and fat, and recommended intake levels for energy, vitamins, minerals and cholesterol, by sex, were based on the Dietary Reference Intake for Koreans( 16 ). We focused our analysis to the age group from 30 to 49 years.
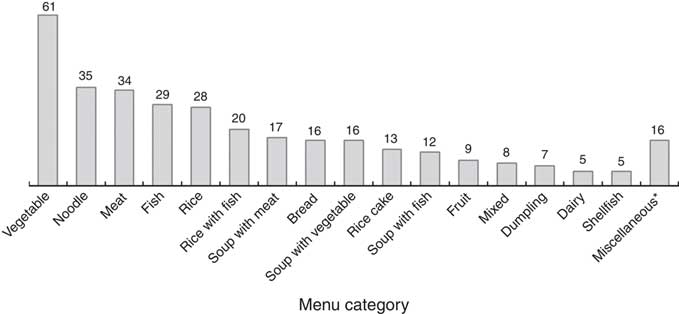
The distribution of dine-out menus used in the analysis is summarized in Fig. 1, where a total of 331 menus are included. Most menus categorized as rice, noodle or soup (with rice) are generally served as the main dish and other foods are often served together as side dishes. Since the number and type of side dishes depend mostly on the restaurant and not the menu ordered, it is common to eat from many menus on the list for a single meal. Fruit and dairy products are normally not included in Korean dine-out menus, but the nutrition data are used in our analysis as discussed further in the ‘Menu optimization: additional model’ subsection below.

Menu optimization: formulation
We first present the formulation of the mathematical program used in the present study in this subsection and then include intuitive descriptions of various models that were analysed in the next two subsections. It should be noted that the proposed formulation does not find a dine-out menu combination relative to another plan (i.e. improve an existing plan) and, thus, the solution is the absolute optimal decision that provides the best possible nutrient combination. The dine-out menu optimization problem can be formally expressed as:
 $${\rm Minimize}\;{{\sum_{i \in L} \max \left( {l_{i} {\minus}x_{i} ,0} \right){\plus}\sum_{i\in U} {\rm max}\left( {x_{i} {\minus}u_{i} ,0} \right)} \over N}$$
Subject to l cal ≤x cal ≤u cal
0≤w j ≤1 for each menu j $x_{i} {\equals}\mathop \sum\limits_j n_{{i,j}} w_{j} \,\,{\rm for}\,{\rm each}\,{\rm nutrient}\,i$
where the decision variable x i represents the total consumption level of the ith nutrient and w j represents the consumption of the jth menu expressed as a proportion of a single serving. The sets L and U represent nutrients that have recommended lower and upper levels, respectively. Furthermore, the constant l i represents lower limits for nutrients in L, and u i represents upper recommended levels for nutrients in U. Since bounds on total energy (calories) are included as a strict restriction, x cal is constrained to be within l cal and u cal . Finally, n i,j represents the amount of the ith nutrient that can be consumed from eating the jth menu. The objective value computes the average deviation by dividing the total deviation by N, which is the number of nutrients optimized.
The optimization problem given by equation (1) can also be written as below without the maximization in the objective function as:
 $${\rm Minimize}\;{{\sum_{i \in L} {{d_{i} } \over {l_{i} }}{\plus}\sum_{i\in U} {{e_{i} } \over {u_{i} }}} \over N}$$
Subject to $l_{{cal}} \leq x_{{cal}} \leq u_{{cal}} $
0≤w j ≤1 for each menu j $x_{i} {\equals}\mathop \sum\limits_j n_{{i,j}} w_{j} \,\,{\rm for}\,{\rm each}\,{\rm nutrient}\,i$ $y_{i} {\equals}x_{i} {\minus}e_{i} {\plus}d_{i} \,\,{\rm for}\,{\rm each}\,{\rm nutrient}\,i$ $y_{i} \leq u_{i} {\rm \;for \;}i\in U$ $y_{i} \geq l_{i} \;{\rm for\; }i\in L$ $e_{i} \geq 0,{\rm }d_{i} \geq 0\,{\rm for}\,{\rm all}\,i$
where slack variables e i and d i represent the excessive consumption and the deficient amount of the ith nutrient, respectively. The use of slack variables and additional dummy variables y i formulates the original problem (1) into a problem (2) that is more solver-friendly. Solving the optimization problem (1) or (2) provides the optimal choice of dine-out menu that satisfies all constraints while minimizing the proportion of nutrients that do not fall within guidelines.
Menu optimization: base model
In our analysis, we formulated the dine-out menu optimization problem as below for finding a complete diet that attempts to satisfy recommended daily nutrition levels.Footnote * We refer to this formulation as Case A.
There is one decision variable for every dine-out menu considered in the problem. If a menu is not chosen, the corresponding decision variable will have a value of 0. If a decision variable has a value of 0·5, it shows that half a serving of the corresponding menu should be consumed. As shown above, in Case A the objective function is to minimize deviation from the recommended nutrition levels. Since some nutrients have recommended lower bounds while others have suggested upper bounds, the objective function measures deficiency of nutrients with lower bounds and excess of nutrients with upper bounds. Furthermore, since the recommended levels are different for different nutrients, we measured the percentage of deficiency or excess instead of the actual value.
Energy consumption is most critical for maintaining one’s health. It is known that energy restriction improves metabolic efficiency and reduces oxidative damage markers, which may decrease incidence and progression of chronic diseases such as obesity, metabolic syndrome and cancer( Reference Gilmore and Redman 17 ). Therefore, the first constraint of the menu optimization problem in Case A forces total daily energy to be within a recommended range. This constraint makes sure one consumes at least the minimum energy necessary for an average lifestyle and also avoids consuming too much food that will eventually lead to weight gain and reduced health conditions. The second constraint limits the consumption of each dine-out menu to a maximum of 1 serving/d and this reflects the unlikelihood of eating the same menu more than once on the same day. Together with the definition of the decision variables, each menu will have a value between 0 and 1.
The recommended nutrition levels are summarized in Table 1. We focused the analysis on nutritional recommendations for ages 30–49 years because this is the age group with the most frequent dine-outs in South Korea. The limits for energy are used in the first constraint and the other suggested levels are used for computing the objective function value.
Table 1 Lower and upper limits and recommended level of daily nutrient intakes for Korean adults aged 30–49 years, by sex( 16 )
%E, percentage of energy.
Menu optimization: additional model
In addition to the base model given by Case A, we compared a few variations to analyse how changes in allowed menu choices and constraints affect the optimal decision. The four cases are summarized below.
The first case is the base model introduced in the previous subsection. As shown in the ‘Results’ section, the base case revealed significant overconsumption of Na, which is a widely known concern in Korean meals( Reference Kwon and Ju 4 ). Thus, the second case, referred to as Case B, added a strict upper limit on total Na consumption. This second case will demonstrate how the optimal menus change when one is forced not to exceed the Na limit when excess use of salt is common in Korean meals. Case C solved the same optimization model as Case B, but it selected from more menus. More specifically, Case C will find the optimal diet when fruit and dairy products are included as shown in Table 2. This third case is important because fruit and dairy products are difficult to find in dine-out menus even though they are excellent choices for intake of vitamins and minerals. Finally, Case D restricted the total selection of fruits and dairy products to be at least 1 serving/d but less than 2 or 3 servings/d. The upper limit of 3 servings/d (300 %) for fruit and 2 servings/d (200 %) for dairy products reflects the recommended daily amount for adults aged 30–49 years whose recommended energy level is 10 042 kJ/d (2400 kcal/d)( 16 ). This last constraint portrays a more realistic situation since people usually do not eat excess amounts of fruit or dairy products, especially when one eats out regularly. In Cases C and D we included only fruit and dairy products but no other food groups such as grains or vegetables because, while most food groups including vegetables are commonly used as ingredients of Korean dine-out menus, fruit and dairy products cannot be consumed unless eaten separately (e.g. as dessert).
Table 2 List of fruit and dairy products included in menu data
Although the Cases B, C and D are variations of the base model (Case A), the additional cases do not change the overall structure of the optimization problem because the extra constraints are all expressed as linear functions. In the ‘Results’ section, results of the four models are compared to analyse optimal dine-out decisions under various conditions.
Optimization models
The menu optimization problems presented above allow the selection of any single menu in any proportion between 0 and 1; 0 represents not selecting the menu and 1 represents selecting one serving of the menu. Nevertheless, since fractions are also possible, it is possible to select, for example, half a serving (0·5) or a tenth of a serving (0·1).
The model is purposely designed this way because we are interested in observing the healthiest choice of dine-out menus under a situation that is not too restrictive. If a healthy diet is not possible under a non-restrictive condition, it will certainly be impossible under more restrictions. Limiting selections to be only either zero or one serving, or a choice among a few portions (e.g. quarter, half or full serving), becomes a more restrictive model.
Linear programming for nutrient analysis
Optimization methods compute the optimal solution under specified conditions and LP (or linear optimization) is the simplest form of optimization problems where the problem settings are described by linear functions( Reference Bertsimas and Tsitsiklis 18 , Reference Dantzig 19 ). More specifically, LP finds the best solution for achieving the decision maker’s objective, where the objective function could be to either maximize or minimize.
There have been studies that employ LP methods for analysing nutrients and recommending diet guidelines. One of the most popular approaches for utilizing linear optimization is to find a healthy diet (or food combination) that satisfies given nutrient recommendations but requires minimum change from the current diet pattern( Reference Soden and Fletcher 20 – Reference Ferguson, Darmon and Briend 22 ).
In contrast to previous studies, we introduce a new formulation that finds the optimal dine-out menu combination without reference to any previous pattern. Since the formulation in our analysis is expressed as a linear program, the solution is the absolute optimal decision that provides the true optimum and best possible nutrient combination.
Results
Findings from the four cases were compared and we begin by discussing results for males before mentioning those for females. The results from our optimization analyses are presented by gender in Tables 3–8.Footnote *
Table 3 Results on optimal nutrition levels for Korean males aged 30–49 years from the dine-out menu optimization
Table 4 List of menus selected by dine-out menu optimization in Case D for Korean males aged 30–49 years (sorted by decreasing optimal amount)
Table 5 Food categories selected by dine-out menu optimization in Case D for Korean males aged 30–49 years
Table 6 Results on optimal nutrition levels for Korean females aged 30–49 years from the dine-out menu optimization
Table 7 List of menus selected by dine-out menu optimization in Case D for Korean females aged 30–49 years (sorted by decreasing optimal amount)
Table 8 Food categories selected by dine-out menu optimization in Case D for Korean females aged 30–49 years
Males
First, Case (A), which is the base case that restricts only total energy consumption and the amount of serving per menu, could not satisfy all recommended nutrient levels and even the optimal choice showed 3·03 % average deviation from recommendation. The most noticeable issue is a 56 % excess in Na. This shows that the optimal combination of dine out-menus can satisfy the guideline levels of most nutrients except for Na (deficiency in K is only about 1 %). In other words, it will be possible to find a healthy menu combination if Korean meals contained less Na. This observation on Case A confirms, through optimization, that the main concern in Korean meals is the excessive amount of Na (Table 3).
When the level of Na is restricted to a maximum of 2000 mg in Case B, the optimal decision became worse with an increased average deviation of 5·84 %. Even though no nutrients had excessive levels, minerals such as niacin, folate, K and Mg could not reach their recommended minimum levels of consumption. This illustrates that simply limiting the consumption of Na is not the solution to reaching a balanced diet (Table 3).
Cases C and D, that add fruits and dairy products to the list of candidate menus, support how additional sources of vitamins and minerals are critical. Case C clearly showed the most efficient selection with less than 1 % average deviation and only Mg being below recommended levels. Moreover, Case D, which is a more realistic situation, formed a meal plan that is more ideal than Cases A and B. In comparison to Case B, Case D reduced the deficiency levels of folate, K and Mg, and satisfied the recommended level for niacin (Table 3).
The optimal menu combination for Case D is presented in Tables 4 and 5. The optimal meal for one day included portions of beef cutlet with rice, rice with curry, and ox bone soup with rice as main dishes, with several sides including sweet potatoes, starch jelly and stir-fried dried shrimps. More importantly, the meal showed that it is optimal to meet the recommended levels of fruit and dairy product consumption (3 servings/d for fruit and 2 servings/d for dairy products) through yoghurt, milk and some fruits. Our observations stress that one should not restrict one’s diet to dine-out menus and should consciously add fruits and dairy products to his/her diet.
Females
The results for females, as shown in Table 6, were consistent with our findings for males above. Case A, the base case, again exhibited very high levels of Na and slight deficiency in a few minerals. When Na was controlled to not exceed the maximum allowed amount, the degree of deficiency in minerals increased and the average deviation from recommendations also rose. More importantly, adding fruits and dairy products found a perfect meal plan with no excessive or deficient nutrients. Even Case D, which limited the maximum consumption of fruits and dairy products, showed minimal insufficiency. Overall, the cases for females displayed a healthier diet in each case, but the key issues with dine-out menus were consistently observed. The list of menus selected for Case D are presented in Tables 7 and 8.
Discussion
The results of the present nutrient analysis for dine-out menus in Korea demonstrated issues in dining out and the need for consuming vitamins and minerals from additional sources for both males and females. The high usage of Na in Korean dine-out menus was found to be the biggest concern and this had broad effect because limiting the intake of Na resulted in dine-out plans with low content of minerals.
The model used in our analysis allowed investigating nutrient information in the most optimal combination among all possible combinations of dine-out menus because it was formulated as an LP problem. Formulating a diet optimization problem as a linear program is a major advantage because the problem can be efficiently solved and include various restrictions on nutrients or eating habits.
Linear optimization models have been applied to nutrient analysis under various settings. Most of the studies have focused on improving one’s diet in order to meet certain health goals. Soden and Fletcher( Reference Soden and Fletcher 20 ) formulated a linear program that computes the optimal food quantities of an observed diet and demonstrated the case for a 50-year-old overweight female with nutrient targets for energy, fibre, Na and fat. Masset et al.( Reference Masset, Monsivais and Maillot 21 ) also concentrated on improving one’s original diet with minimum change but they applied constraints based on guidelines for cancer prevention. The model was further explored in Okubo et al.( Reference Okubo, Sasaki and Murakami 24 ) as they designed a diet model optimized for the food intake patterns in Japan by considering twenty-eight nutrients. The case for developing countries was illustrated in Ferguson et al.( Reference Ferguson, Darmon and Briend 22 ), who also discussed testing the robustness of their model using a second LP model; and the nutritional quality of food aid delivered by food banks in France was analysed by Rambeloson et al.( Reference Rambeloson, Darmon and Ferguson 25 ). Moreover, there are studies that have incorporated cost into the model to analyse the effect of having a budget on healthy food choices( Reference Darmon, Ferguson and Briend 26 , Reference Darmon, Ferguson and Briend 27 ) and extensions for revising over-restricted or unrealistic diet choices using goal programming( Reference Anderson and Earle 28 , Reference Ferguson, Darmon and Fahmida 29 ).
The most relevant to the present study is the work by Asano( Reference Asano 30 ) that focused on nutrient optimization in Korean meals. Asano studied the food intake patterns of Koreans and formed a healthy Korean diet based on the widely used formulation given by equation (1). As discussed in the ‘Methods’ section, our approach is distinct from previous studies because the goal here is not to improve an existing diet pattern but to analyse the nutritional deficiency of the most optimal choice. Furthermore, we examined a comprehensive list of dine-out menus in Korea that provide detailed information rather than observing food groups or categories.
First, we found that a healthy diet cannot be achieved with any combination among Korean dine-out menus; it is impossible to meet all recommended nutrient guidelines regardless of which combination of dine-out menus is selected. Second, our results confirmed that excessive intake of Na is the major concern for Korean menus. Finally, we showed that dine-out meals require additional consumption of fruits and dairy products in order to achieve a balanced diet. It is also noteworthy to mention that additional consumption of fruits and dairy products was necessary to meet daily requirements of vitamins and minerals. The addition of fruits and dairy products in optimization models to solve the deficiency of vitamins and minerals is due to the characteristics of Koreans’ diet. Unlike the Western diet, the traditional Korean diet is composed of rice and various side dishes such as meat, fish, legumes and vegetables( Reference Lee and Kim 31 ), but it does not include fruits and dairy foods. Thus, people should consume those foods separately from meals as a dessert or snack in order to achieve a balanced diet. However, it is hard to eat them when eating out unless people go to a café or dessert shop because Korean restaurants usually do not provide a dessert menu with meals. Given that, it is meaningful to add fruits and dairy products, not other food groups, in dine-out menus for the optimized diet among Koreans. This result emphasizes the importance of a balance diet comprised of various food groups for nutritional adequacy. Dine-out menus lack variety because the menu is mainly single dish not like a meal at home. Therefore, the optimization proves that the additional supplements are needed to secure the balance and variety in food choice for nutritional adequacy in dining out.
The optimization formulation tested here is less restricted than real-world dine-out decisions. In reality, individuals will also take price, taste, restaurant location and time constraint into consideration when deciding where to eat out. Since our optimization problem could not find a well-balanced dine-out menu combination, this shows that excess of Na and deficiency of minerals are more critical and it is impossible to maintain a healthy diet from eating out in real life in South Korea.
While the less restricted analysis provides meaningful findings, we note that there are a few limitations that can be improved in future work. It will be possible to analyse more intuitive diet plans if common dining patterns were reflected in the model. For example, it is less likely that one would eat pizza with kimchi, and these could be avoided if we add constraints to the model. Moreover, current analysis found the optimal menu combination for daily consumption without making distinction among breakfast, lunch and dinner. Incorporating eating patterns will help prepare an optimal meal plan for a day. Nevertheless, this task requires much observation, data and careful modelling because common dining patterns do not represent everyone’s eating habits. In addition, the analysis can be improved by expanding the data on dine-out menus. The analysis presented herein includes 317 dine-out items, nine fruits and five dairy products, which covers a wide range of dining options, but it will be interesting to observe the results when further extending the list of menus.
Conclusion
In conclusion, our findings revealed that it is unlikely to satisfy all nutrient recommendations with any combination of dine-out menus. Specifically, high levels of Na must be resolved with extra consumption of fruits and dairy products. Our results showed that the best meal combination, even though the proportion and pairing of menus may be unrealistic, is not healthy and thus one should not fully depend on eating out.
Acknowledgements
Financial support: This research was supported in part by the Basic Science Research Program of the National Research Foundation of Korea (NRF), funded by the Ministry of Education, Science, and Technology (grant number NRF2016R1D1A1B03931307). The NRF had no role in the study design, data analysis or writing of this article. Conflict of interest: None. Authorship: J.H.K. contributed to the acquisition of the data, the analysis and interpretation of the data and wrote the paper; W.C.K. helped with research design and interpretation of the data; J.K. contributed to research design, interpretation of the data, writing paper and had primary responsibility for the final content. All authors read and approved the final manuscript. Ethics of human subject participation: Not applicable.