


Excess Na consumption is linked to hypertension and risk of CVD, and a shift towards a lower sodium to potassium ratio (Na/K ratio) in the diet has shown improved outcomes in terms of lowering blood pressure and reducing cardiovascular morbidity and mortality(Reference Newberry, Chung and Anderson1–Reference Brand, Visser and Schoonees6). A global initiative to reduce dietary salt intake for improving cardiovascular health is coordinated by the WHO(7). In all member states of the WHO European Region where Na intakes have been assessed by urine collections, average intakes clearly exceed the recommended maximum level of 2 g/d for adults, corresponding to approximately 5 g salt(8–Reference Kwong, Whiting and Bunge10). Several countries, including Norway, have committed to reduce population salt intakes by 30 % between 2010 and 2025(7,11) . Strategies to achieve this goal involve reductions of salt content in processed foods and increasing consumers’ awareness through information and food labelling. National policies that involve structural interventions have a potential for reducing population salt intake(Reference Barberio, Sumar and Trieu12). The interventions should be implemented gradually to allow for adapting to the less salty taste of foods, thus preventing consumers from shifting to saltier products or compensating by adding more salt during preparation and consumption. As in several countries, there has been progress in Norway(13) with reduced salt content in common foods through a commitment between food industry and the government(14). Monitoring time trends in salt consumption is necessary for evaluating the public health impact of these initiatives. In the large population-based HUNT Study in mid-Norway, systolic blood pressure declined sharply from the mid-1990s to the mid-2000s(Reference Holmen, Holmen and Tverdal15), and thereafter there was a continued slight decline until 2017–2019(16,Reference Åsvold, Langhammer and Rehn17) . There has so far not been available data to indicate if population salt consumption has changed during the last decade.
Approximately 90 % of ingested Na is excreted through the urine, and measurements of 24-h urinary Na excretion in representative samples are recommended as an indicator of average population Na intake(Reference Kwong, Whiting and Bunge10,18) . However, collecting 24-h urine is resource-demanding, and collection of spot urine samples may often be more feasible. Therefore, equations for predicting 24-h excretion from spot urine concentrations have been developed in different populations(Reference Toft, Cerqueira and Andreasen19–Reference Tanaka, Okamura and Miura22). A meta-analysis of validation studies concluded that the mean population 24-h salt intake can be predicted fairly accurately from spot urine samples collected in the same population(Reference Huang, Crino and Wu23). In a population-based study in Northern Norway, excretion of Na, K and creatinine was measured in both 24-h urine and spot urine(Reference Meyer, Johansson and Eggen24). Among three previously developed equations for estimating salt intake from spot urine concentrations, the equation developed in the International Cooperative Study on Salt, Other Factors, and Blood Pressure (INTERSALT) study with the coefficient for the Northern European region(Reference Brown, Dyer and Chan20,Reference Stamler25) yielded the most accurate estimate of average 24-h Na excretion and thus represents the preferred choice in an adult Norwegian population(Reference Meyer, Johansson and Eggen24).
Urinary Na, K, and creatinine concentrations were available from spot urine samples of participants in two waves of a large population-based health study in mid-Norway in 2006–2008 (n 500 aged 25–64 years) and 2017–2019 (n 500 aged 25–64 years and n 250 aged 70–79 years). Participant sampling, urine collection and biochemical analyses were performed using identical methods in both waves(Reference Åsvold, Langhammer and Rehn17). We aimed to assess whether there has been a change in salt intake during the period and to assess possible variations in urinary concentrations of Na, K and Na/K ratio and estimated salt intake across sex, age and educational level.
Methods
Study population
The HUNT Study is a population-based cohort study of the adult population in Trøndelag County in mid-Norway, a region characterised by a relatively homogenous ethnic population and low migration, suitable for examining time trends(Reference Åsvold, Langhammer and Rehn17). The study has been running in Nord-Trøndelag since 1984, inviting all inhabitants aged 20 years and older to participate. The data collection covers a wide range of health-related topics through repeated surveys with questionnaires, interviews, clinical examinations, laboratory measurements and stored biological samples. The third wave (HUNT3) was carried out in 2006–2008, and the fourth wave (HUNT4) was carried out in 2017–2019. The overall participation rate, defined as completing the main questionnaire and attending the clinical screening(26), was the same in these two waves: 54 % (49 % in men and 59 % in women). Spot urine samples were collected from approximately 12 000 participants in HUNT3 and 26 900 participants in HUNT4. The urine samples were collected at the health examination stations and frozen immediately before transport to the biobank(Reference Åsvold, Langhammer and Rehn17). For our purpose, age- and sex-stratified subsets of 500 HUNT3 participants and 750 HUNT4 participants were drawn randomly from participants who had donated a spot urine sample and had no known kidney disease, heart failure or cerebral stroke. Following the WHO recommendation for sampling(18), these comprised 125 individuals of each sex in each of the age strata 25–44 years and 45–64 years in both waves and an additional 125 individuals of each sex aged 70–79 years who attended the HUNT 70+ extension of HUNT4. Within our sample, nine participants were by chance included in both waves (accounting for 1·4 % of the data points).
Biochemical analyses
In both waves, spot urine samples were non-fasting and taken at any time during the day (09.00–20.00). The samples were immediately cooled down to 4°C, transported at 4°C to HUNT Biobank the same day and frozen to –80°C the following day for storage. The analyses were performed at Levanger Hospital with Architect ci8200. Urinary Na and K were assessed with an indirect ion-selective electrode to determine ion concentration. Urinary creatinine was assessed using an enzymatic assay. The measurement range was 220–35 360 µmol/l. Total assay CV was 24 % (5790 µmol/l).
Covariates
Height was measured to the nearest centimetre, and weight was measured to the nearest half-kilogram without shoes and wearing light clothing. BMI was calculated as body weight in kilograms divided by the squared value of body height in metres (kg/m2). In HUNT4, self-reported educational attainment was collected through a questionnaire asking for the highest completed education, with six response options ranging from primary school to college/university education of ≥ 4 years, based on the Norwegian Standard Classification of Education(27). Response options 1 and 2 and response options 3 and 4 were combined, resulting in four categories: primary education (completed primary school or 1–2 years of high school/vocational school), secondary education (completed high school or certificate of apprenticeship), university or other postsecondary education < 4 years and university/college education of ≥ 4 years. For studying differences by age, individual age was categorised into 25–44 years, 45–64 years and 70–79 years.
Prediction of 24-h sodium intake
Urinary concentrations of Na, K and creatinine were determined in mmol/l. Na/K ratio was defined as urinary Na concentration (mmol/l) divided by urinary K concentration (mmol/l). The INTERSALT equation with coefficients for the Northern European region(Reference Brown, Dyer and Chan20) was used to estimate 24-h Na excretion. This equation has been validated and found to perform well in the age range 40–69 years in a population-based study carried out in a geographically close Norwegian city with a comparable population to that in HUNT in terms of a homogenous ethnic background(Reference Meyer, Johansson and Eggen24). The equation is shown in online supplementary material, Supplemental Fig. 1. It is separate for men and women and includes age (years), BMI (kg/m2) and spot urine concentrations of Na, K and creatinine (mmol/l). To convert from mmol to g Na/24 h, results were multiplied by a factor of 0·023, then multiplied by a factor of 2·54 to obtain NaCl (g/24 h).
Statistical analysis
Statistical analysis was performed in Stata SE version 17·0 (Stata Corp.). All analyses were performed in the age groups represented in both waves (25–44 and 45–64 years). Participants aged 70–79 years were included only when describing mean values by age in HUNT4.
Differences in mean values between HUNT3 and HUNT4 were tested with two-sided t test and in linear regression to include covariates (age, sex and BMI). To estimate mean values with sd and 95 % CI within groups of sex, age and education level, we performed linear regression followed by post-estimation of marginal effects. Mean estimated salt intakes (g/24 h) by educational level were age-standardised by including individual age as a covariate in the regression model and stratified by sex. Differences between age groups were tested by ANOVA, while differences between groups of educational level were tested by ANCOVA taking age into account. For results presented as supplementary material, median values by sex, age and educational level were obtained by performing quantile regression followed by post-estimation of marginal effects.
Results
Characteristics of the study population
We included 499 HUNT3 participants and 500 HUNT4 participants aged 25–64 years and an additional 250 participants aged 70–79 years in HUNT4. Mean characteristics in the age span represented in both waves (25–64 years) are shown in Table 1. The corresponding median values are shown in the online supplementary material, Supplemental Table 1. The mean age was 46 years in both waves as a result of the age-stratified sampling (Table 1). BMI in men 25–64 years old was similar in HUNT4 as in HUNT3: mean 27·6 v. 27. 8 kg/m2, P = 0·55. In women 25–64 years old, mean BMI was 26·7 kg/m2 in HUNT4 v. 25·9 kg/m2 in HUNT3, P = 0·09.
Table 1 Characteristics of men and women aged 25–64 years with spot urine samples in the HUNT Study: HUNT3 (2006–2008, n 499) and HUNT4 (2017–2019, n 500). Mean (sd)

Na, urinary sodium concentration; K, urinary potassium concentration; Na/K ratio, ratio of urinary sodium to potassium concentrations; NaCl, salt.
* Estimated using the INTERSALT equation with sex-specific coefficients for the Northern European region(Reference Brown, Dyer and Chan20).
† Independent samples t test for mean difference between HUNT3 and HUNT4 within sex.
Urinary sodium, potassium and sodium to potassium ratio in HUNT3 and HUNT4
Mean urinary Na concentrations in adults aged 25–64 years were not significantly different in HUNT3 and HUNT4 (Table 1). In men, mean urinary K concentrations were 74 mmol/l in HUNT4 v. 68 mmol/l in HUNT3 (P = 0·054). The difference in urinary K in women was small and not statistically significant, mean 63 v. 59 mmol/l (P = 0·24). Urinary Na/K ratio was not statistically significantly different in HUNT4 compared with HUNT3: mean 1·92 v. 2·08 in men (P = 0·13) and 1·77 v. 1·83 in women (P = 0·53) (Table 1). Median values showed a similar pattern (see online supplementary material, Supplemental Table 1).
Estimated salt intake in HUNT3 and HUNT4
Among men aged 25–64 years, the mean estimated 24-h salt intake was 11·1 g (95 % CI 10·8 g, 11·3 g) in HUNT3 and 10·9 g (95 % CI 10·6 g, 11·1 g) in HUNT4 (Table 1). In women, the corresponding values were 7·7 g (95 % CI 7·5 g, 7·9 g) in HUNT3 and 7·7 g (95 % CI 7·5 g, 7·9 g) in HUNT4. Results were similar for median values (see online supplementary material, Supplemental Table 1). In men and women combined (not shown in table), the mean estimated salt intake was 9·37 g in HUNT3 and 9·28 g in HUNT4 (P = 0·52), that is, a difference of –0·09 g (95 % CI –0·38 g, 0·20 g). After adjustment for age, sex and BMI, the estimated mean difference was –0·15 g (95 % CI –0·32 g, 0·03 g).
Variations across sex, age and educational level
Gradients across age and educational level are described for HUNT4 only. Overall and within categories of age and education, women had a lower estimated 24-h salt intake than men. In women, there was a clear age gradient, with mean estimated salt intake being highest in younger adults (8·1 g) and lowest in the 70–79-year-old women (5·9 g, P < 0·001) (Table 2). In men, the estimated 24-h salt intake was similar across age (mean 10·7 g for ages 25–44, 11·0 g for ages 40–64 and 11·1 g for ages 70–79, P = 0·24 in ANOVA). While urinary K concentrations were similar across age groups (Table 2), there was an age gradient in urinary Na concentrations in both men and women, with the highest concentrations in the younger adults. Consequently, urinary Na/K ratio was higher in those aged 25–44 years, with a ratio above 2 in both men and women. In age groups ≥ 45 years, Na/K ratio was approximately 1·7 in men and below 1·6 in women (Table 2). In participants aged 25–64 years, 23 % had completed college/university education of at least 4 years, 26 % had completed college/university education of less than 4 years, 36 % had completed secondary school, and 15 % had reported primary school as their highest completed education. Age-standardised mean estimated 24-h salt intake did not differ significantly across educational attainment (Table 3). The corresponding median values are shown in online supplementary material, Supplemental Tables 2 and 3.
Table 2 Spot urinary sodium (Na), potassium (K), sodium to potassium ratio (Na/K ratio), creatinine and estimated 24-h salt intake by age groups in men and women participating in HUNT4 (n 750). Mean (sd)
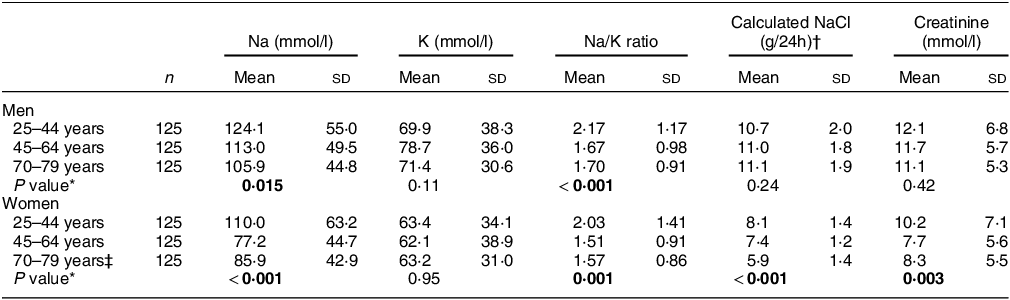
NaCl, salt.
P values < 0·05 bolded.
* Difference between age groups tested with ANOVA.
† Estimated using the INTERSALT equation with sex-specific coefficients for the Northern European region(Reference Brown, Dyer and Chan20).
‡ Three women aged 70–79 years had missing values for BMI and thereby calculated NaCl.
Table 3 Age-standardised mean urinary sodium (Na), potassium (K), sodium to potassium ratio (Na/K ratio) and estimated 24-h salt intake by educational attainment in men and women aged 25–64 years participating in HUNT4
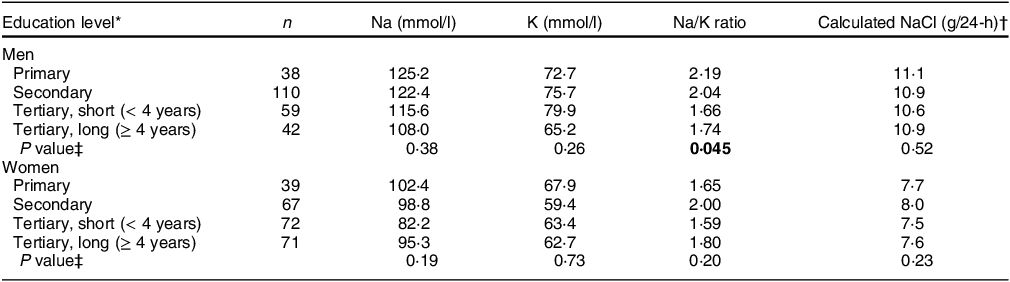
NaCl, salt.
P values < 0·05 bolded.
* Attained educational level in four categories: primary education, completed primary school or 1–2 years of high school/vocational school; secondary education, completed high school or certificate of apprenticeship; tertiary short, university or other postsecondary education less than 4 years; tertiary long, university/college education of 4 years or more.
† Estimated using the INTERSALT equation with sex-specific coefficients for the Northern European region(Reference Brown, Dyer and Chan20).
‡ P values obtained by linear regression followed by the Wald test.
Discussion
When estimating 24-h salt intake from spot urine samples using the INTERSALT equation, we found that salt intake in adult men and women in mid-Norway did not change significantly from 2006–2008 to 2017–2019. We observed an overall difference in estimated salt intake of –0·09 g between the two time points, with 95 % CI ranging from –0·38 g to 0·20 g. The results suggest that salt consumption did not decrease in adults in mid-Norway during this period. There was a slight decline in blood pressure levels in this population during the same period(16,Reference Åsvold, Langhammer and Rehn17) , suggesting that blood pressure may have been affected by changes in other risk factors. The magnitude of 24-h salt intake was comparable with that in adults aged 40–69 years in the population-based Tromsø Study in 2015–2016 (mean 10·4 g in men and 7·6 g in women)(Reference Meyer, Johansson and Eggen24).
Estimating 24-h sodium intake from spot urine samples
For monitoring average Na intake in populations, 24-h urinary assessment is the recommended method(18). Dietary assessment methods have shown large measurement errors due to reporting errors, highly variable Na content of food products which challenges food composition databases and the difficulty to capture the amount of salt added during preparation and consumption(Reference Freedman, Commins and Moler28–Reference McLean, Cameron and Butcher30). Spot urine samples are often available in large population-based studies, and equations to estimate 24-h salt excretion have been developed(Reference Toft, Cerqueira and Andreasen19–Reference Tanaka, Okamura and Miura22).
In the population-based Tromsø Study 2015–2016, both 24-h urine excretion and spot urine concentrations of Na, K and creatinine were measured in 475 men and women aged 40–69 years(Reference Meyer, Johansson and Eggen24). Among three previously developed equations for estimating average 24-h Na intake from spot urine concentrations(Reference Toft, Cerqueira and Andreasen19,Reference Brown, Dyer and Chan20,Reference Tanaka, Okamura and Miura22) , the INTERSALT equation with the coefficients for the Northern European region yielded the most accurate estimate(Reference Brown, Dyer and Chan20,Reference Meyer, Johansson and Eggen24) . The mean 24-h Na excretion estimated by the INTERSALT equation was 4 % higher in men and 1 % lower in women than that measured by 24-h urine, corresponding to an overestimation of 0·4 g salt in men and an underestimation of 0·1 g salt in women(Reference Meyer, Johansson and Eggen24). The similarity of our findings in the HUNT population to those of the Tromsø population supports the generalizability of our results in adults aged < 70 years. A previous validation study in a US population aged 18–39 years also found the INTERSALT equation to perform well among several equations examined(Reference Cogswell, Wang and Chen31), but its validity is not clarified in older adults(Reference Allen, Zhao and Loria32). Furthermore, the INTERSALT equation tends to underestimate 24-h NaCl at high intakes and overestimate NaCl at low intakes(Reference Brown, Dyer and Chan20), with the inherent risk of failing to detect a true decline. However, reassuringly, we observed that Na concentrations in spot urine were also unchanged and showed in general the same pattern across subgroups of sex, age, education and study wave, supporting a true null finding.
Variations by age
There was a clear age gradient in both men and women in 2017–2019, with higher urinary Na concentrations in the youngest participants. Estimated salt intake was lowest in the oldest women, while in men, there was no significant difference by age. This is in line with findings from the Tromsø Study where calculated salt intake based on 24-h urine collection was inversely related to age in women but not in men(Reference Meyer, Johansson and Eggen24). We may speculate that the finding of higher salt intakes in younger compared with older women may reflect a more frequent consumption of processed foods and take-away and readymade foods with a higher salt content in the younger age groups, at the expense of homemade food prepared from raw ingredients(Reference Bugge33). Furthermore, salt intake may be lower in older women both due to a lower energy intake and a greater attention to sources of salt. Notably, a nationwide online public health survey conducted in people aged 18 years and older in Norway in 2020(Reference Abel and Totland34) showed an age gradient in the proportion who reported adding additional salt ‘often or usually’ to food during preparation and serving, with higher proportions in younger adults. While the proportion was up to 30 % in the younger age groups (up to 54 years), it was lower in those 55 years and older and lowest in women aged > 75 years (11 %). In addition, the proportion who reported frequent consumption of potato chips and salty snacks was highest in younger age groups (18–49 years). Younger age was a stronger predictor than geography and education for both salt added to meals and frequency of salty snacks consumption(Reference Abel and Totland34).
Urinary sodium to potassium ratio
The mean urinary Na/K ratio in people aged 25–64 years in 2017–2019 was approximately 1·9 in men and 1·8 in women. Urinary Na/K ratio was highest (above 2) in younger adults. This difference reflected the age difference in Na concentrations, while K concentrations did not exhibit a trend across age. Na/K ratio can be lowered both by lowering Na through salt reduction and by increasing K, for example, through increased fruit and vegetable consumption, and is proposed to be the most relevant measure in relation to blood pressure and CVD risk(Reference Iwahori, Miura and Ueshima35). While there is no officially recommended target value for Na/K ratio, meeting the dietary target intake of Na would result in a ratio of approximately 1(Reference Yatabe, Iwahori and Watanabe36–Reference Stamler, Rose and Stamler38). Maintaining Na/K ratios below 2 may represent an intermediary target expected to contribute to reducing blood pressure and CVD risk(Reference Iwahori, Miura and Ueshima35,Reference Cook, Obarzanek and Cutler39) .
Salt reduction and health outcomes
A modest reduction in salt intake causes a reduction in blood pressure in both hypertensive and normotensive individuals, with clear public health relevance(Reference Aburto, Ziolkovska and Hooper2,Reference He, Li and Macgregor5) . There is also emerging evidence that salt reduction and increased use of potassium based salt substitutes may decrease cardiovascular morbidity and mortality(Reference Newberry, Chung and Anderson1,Reference Neal, Wu and Feng4) . The addition of salt in meal preparation and consumption on the household and individual level is highly variable, and existing evidence is underpowered to support individual dietary advice on salt reduction to achieve clinical benefits in terms of CVD and mortality(Reference Adler, Taylor and Martin40). However, pre-processed foods contribute a large proportion of total salt intake, and there is a large potential for improving health outcomes through national structural interventions for salt reduction(Reference Barberio, Sumar and Trieu12).
Ongoing action for salt reduction
As part of Norway’s commitment to the global initiative to reduce morbidity and mortality of non-communicable diseases(11), an action plan for salt reduction was introduced in 2014(41), aiming for a reduced population salt intake towards a target of 2·3 g Na (5·75 g salt) per d(Reference Jula42). Initiatives include increasing public awareness through communication campaigns, nutrition labelling, monitoring and an intention agreement for salt reduction(43). The intention agreement on facilitating a healthier diet was signed in 2016 by food industry sectors and the Minister of Health and Care services, thus committing the parties to continue to work towards reducing salt consumption. Between 2014 and 2018, average salt content was successfully reduced in many breads and cereals, while it remained mainly unchanged in most meat and fish products. Overall, 49 % of selected food products had a salt content within target levels in 2018, compared with 36 % in 2014–2015(14). Hence, the changes were moderate, and we may also speculate that a shift towards a higher consumption of pre-processed foods might have counteracted the potential benefits of salt reduction of individual foods. Continuous effort by the food industry and catering services has the potential to make a large contribution to reduced population salt intake.
Strengths and limitations
To our knowledge, this is the first population-based study to examine time trends in estimated salt intake in Norway based on urinary Na concentrations. The HUNT Study invited all inhabitants in the former Nord-Trøndelag County region and had a reasonably high participation of 54 %(26). The study covered only one region in Norway. However, the population is considered to be fairly representative of Norway except for the lack of large cities and immigrant populations(Reference Åsvold, Langhammer and Rehn17). Data from HUNT used in the international NCD Risk Factor Collaboration (NCD-RisC) show that the population also follows global health trends(Reference Zhou, Bentham and Di Cesare44). The participant sampling, urine collection and biochemical analyses were performed using identical methods in both waves. Another strength is that we had recently validated the INTERSALT equation and found it to perform well in a Norwegian adult population(Reference Meyer, Johansson and Eggen24), and the findings in HUNT were comparable to those of that study. Based on the 95 % CI for the observed change in estimated salt intake (–0·38 g to 0·20 g), it is unlikely that we have failed to detect a mean decrease of more than 0·38 g due to type 2 error. A limitation is that we did not have information about the time of day of collection of the individual urine samples. However, we may expect that the variation in the time of day of sampling was similar in the two waves.
Our study comprised two repeated cross-sectional data collections. A design with repeated measures in the same participants could have accounted for unmeasured confounding. On the other hand, such a design would prevent us from examining age-specific time trends and would have introduced challenges with comparability due to age-related changes between the two surveys.
Electrolyte concentrations in a single spot urine sample are an inferior, but more feasible, method for assessing salt intake in populations, as compared with the total Na excretion measured in 24-h urine collections. It is thus appropriate for epidemiologic studies aiming at a high participation rate and representativeness. Using spot urine results is reasonable if 24-h urine samples have been collected from the same population, to achieve the most accurate prediction of 24-h salt from spot urine(Reference Brown, Dyer and Chan20,Reference Huang, Crino and Wu23) . However, studies have suggested a poorer performance of the INTERSALT equation in older adults(Reference Allen, Zhao and Loria32). The INTERSALT study included participants aged 20–59 years, while we included ages 25–64 years in our main analysis and an additional older cohort aged 70–79 years in HUNT4. Inferences concerning salt consumption in the oldest HUNT4 participants should therefore be drawn with caution. Another limitation of the INTERSALT equation is that it tends to underestimate 24-h salt at higher intakes and overestimate at lower intakes, with the risk of failing to detect a true decline. However, the unchanged spot urinary Na concentrations over the period supported our null finding.
In conclusion, we observed no change in estimated 24-h salt intake in adult men and women in mid-Norway from 2006–2008 to 2017–2019. Estimated 24-h salt intakes were lower in women than in men. There was a clear age gradient in women, with the highest mean estimated salt intake in younger adults, but we observed no statistically significant educational gradient in salt intake.
Acknowledgements
The HUNT Study is a collaboration between the HUNT Research Centre (Faculty of Medicine and Health Sciences, Norwegian University of Science and Technology NTNU), Trøndelag County Council, Central Norway Regional Health Authority and the Norwegian Institute of Public Health.
Financial support
This study received no external funding.
Conflict of interest
There are no conflicts of interest.
Authorship
H.E.M. conceived the idea of this study. J.H. and S.K. planned and organised the HUNT data collections. H.E.M. carried out the data analysis and prepared tables. K.H. drafted the manuscript. K.H., M.H.A., J.H., S.K., T.H.T. and H.E.M. contributed to the interpretation of data and critical revision for important intellectual content. All authors read and approved the final version of the manuscript.
Ethics of human subject participation
This study was conducted according to the guidelines laid down in the Declaration of Helsinki, and all procedures involving research study participants were approved by the Regional Committee for Medical Research Ethics Mid-Norway (REK midt 20 339). Written informed consent was obtained from all participants.
Supplementary material
For supplementary material accompanying this paper, visit https://doi.org/10.1017/S136898002400082X.


 Open access