


Obesity is defined as excessive fat accumulation that may impair health( 1 ). BMI is the main standard measure used to estimate fatness in individuals and populations, especially due to its ability to express body mass independently of height. However, such independence remains a polemical issue among children and adolescents( Reference Metcalf, Hosking and Frémeaux 2 ). For this reason, to analyse the secular trend in height is as important as to analyse the secular trend in body mass at this age.
The rise of obesity among young people is worldwide and has reached elevated values in developing countries( Reference Ng, Fleming and Robinson 3 ). A further positive secular trend has been observed in countries such as Germany( Reference Zellner, Ulbricht and Kromeyer-Hauschild 4 ) Portugal( Reference Cardoso and Caninas 5 ) and Greece( Reference Papadimitriou, Konstantinidou and Christopanou 6 ). In the 1980s, acceleration of physical development had already reached a plateau in developed countries like Portugal( Reference Padez and Johnston 7 ) and Poland( Reference Krawczynski, Walkowiak and Krzyzaniak 8 ). In contrast, secular trends are just in their early stages in some developing countries, especially those undergoing a socio-economic transition period( Reference Castilho and Lahr 9 ).
In Brazil, from 1974/5 to 2002/3 there was an overall increase in mean BMI and prevalence of overweight and obesity among adolescents( Reference Conde and Monteiro 10 ). The most recent data reveal that 21·7 % of Brazilian adolescents are overweight( 11 ). Analyses of secular trends in growth are particularly meaningful because they highlight inequalities of health, nutrition and social wealth within populations( Reference Cole 12 ) and provide markers of public health as it changes over time( Reference Tanner 13 ). Furthermore, they provide biological evidence to help policy makers identify strategies for further improving children’s and adolescents’ health and welfare.
Previous studies suggest that improvement in socio-economic status, change in diet and nutrition, and considerable medical developments, which translate into better medical care and better hygienic and sanitary conditions( Reference Kryst, Kowal and Woronkowicz 14 ), constitute an important cause of secular changes( Reference Malina 15 ).
Positive correlations between BMI and height have been described before( Reference Metcalf, Hosking and Frémeaux 2 ). What we have to consider is that, under 20 years of age, an increase of height could play a double role: to elevate BMI at the population level – by positive correlation – and to decrease individual BMI since it is calculated from the ratio between weight and height.
The analysis of secular change in height among Brazilian children (under 5 years old) in the period from 1974/5 to 2006/7 showed a positive scenario on stunting prevalence (64 % reduction) and no evidence of overweight increase( Reference Monteiro, Benicio and Conde 16 ). Conde and Monteiro( Reference Conde and Monteiro 10 ) have described changing trends of overweight in Brazilian adolescents and Castilho and Lahr( Reference Castilho and Lahr 9 ) analysed the secular trends in growth among Brazilian adolescents, but to date no research has examined the impact of increment in height on BMI, considering the main large national surveys conducted since the 1970s. The present study explored if the secular trend in height contributed to delay overweight rise among Brazilian adolescents.
Methods
Source population and study design
Data analysed in the present study are representative of the 10–19 years age range in Brazil and come from four national surveys: (i) ENDEF (acronym in Portuguese for National Study on Family Expenditures) with 64 180 adolescents (31 381 boys and 32 799 girls) carried out in 1974–75( 17 ); (ii) PNSN (acronym in Portuguese for National Health and Nutrition Survey) with 13 707 adolescents (6920 boys and 6787 girls) carried out in 1989( 18 ); and two POF (acronym in Portuguese for Family Budget Survey), (iii) the first with 37 567 adolescents (19 549 boys and 18 018 girls) carried out in 2002–03( 19 ) and (iv) the second with 35 404 adolescents (18 077 boys and 17 327 girls) carried out in 2008–09( 11 ). The four surveys were planned using household complex sampling design and are representative of the Brazilian population. The first two surveys did not sample the scarcely populated rural census sectors in the northern and central western regions of Brazil that were included in the two POF, the two more recent surveys. However, as all of the surveys provide Brazilian representative data, we decided to compare data directly as we present estimates at the country level throughout. The four surveys were carried out by the IBGE (acronym in Portuguese for Brazilian Institute of Geography and Statistics). The sampling schemes, variables and data collection procedures are described elsewhere( 11 ). Socio-economic position was described by quintile of household per capita income, where the first quintile contains the poorest and the fifth quintile contains the richest.
BMI was calculated as weight (in kilograms) divided by the square of height (in metres). Nutritional status was classified as overweight when the age- and sex-specific BMI was equal to or greater than the adult equivalent cut-off value of 25 kg/m2, as proposed by the International Obesity Task Force( Reference Cole, Bellizzi and Flegal 20 ).
Statistical analysis
The secular trends of BMI and height were expressed as mean values by age, sex and survey year.
The annual increment rate for height or BMI mean was calculated as an exponential series by dividing the second height or BMI mean by the first one and ratios raised to a power calculated as the inverse of the time span between surveys. Therefore, the annual increment rate is a multiple, in original values, of wavering in BMI or height between periods. The estimation of annual increment rate was computed in three time periods: (i) from 1974/5 to 1989; (ii) from 1989 to 2002/3; and (iii) from 2002/3 to 2008/9.
Changes in BMI over time were fitted using linear regression. The original values of BMI were log-transformed to provide a b coefficient that is interpretable as the ratio of BMI values induced by unit changes in independent variables. This ratio also can be interpreted as percentage changes if multiplied by 100. To complete the model, a constant variable equal to 1 was included as an independent variable and the option ‘no constant’ was added to the command. That procedure induced the software to calculate the b coefficient to the constant variable as a geometric mean for the dependent variable. This model and its respective interpretation/purpose were delineated by Newson( Reference Newson 21 ) and is commonly used for skewed dependent variables. Another advantage of using the log-transformed outcome is to compare at the same unit the effect of exploratory variables on BMI and overweight prevalence. In our model, we included survey year, height, survey-specific income quintiles, age, and an interaction term between height and survey year as explanatory variables.
The changes in overweight prevalence over time were fitted using a Poisson regression with overweight status as the outcome and survey year, height, survey-specific income quintiles, age, and an interaction term between height and survey year as explanatory variables.
The interaction term between height and survey year allows one to assess the effect of height increment among survey years on BMI change or overweight prevalence.
All statistical analyses were performed taking into account sample strata, cluster and weighting structure and were carried out using the statistical software package Stata® version 12·1.
Results
The secular trends of height and BMI of Brazilian adolescents were systematically positive across all ages for both sexes, except for girls aged 14–19 years from 1989 to 2002/3. The average increment of height was greater for 10–15-year-olds in both sexes. The overall BMI trend was positive except for the age and time period highlighted above and proportionally higher than the height increment from one survey to the next.
The mean values of height and BMI by survey year are displayed in Table 1. Girls entered adolescence taller than boys and maintained that status until 12 years. After 13 years of age boys tended to become taller. Height differences pro-boys have increased across surveys. Among boys, height increased by roughly 0·2 cm per year from 1974/5 to 1989, by 0·3 cm per year from 1989 to 2002/3, and by 0·2 cm per year from 2002/3 to 2008/9. For girls, considering the same periods, the average increments of height were approximately 0·2, 0·2 and 0·1 cm per year, respectively. BMI changes were, for the same periods, 0·05, 0·06 and 0·10 kg/m2 per year for boys and 0·06, −0·02 and 0·09 kg/m2 per year for girls, respectively. At end of adolescence, at 19 years old, height increased by 0·2 cm per year from 1974/5 to 1989, by 0·1 cm per year from 1989 to 2002/3, and by 0·3 cm per year from 2002/3 to 2008/9 among boys. Among girls at the same age, height increased by 0·1 cm per year from 1974/5 to 1989, by 0·2 cm per year from 1989 to 2002/3, and by 0·1 cm per year from 2002/3 to 2008/9. In these time periods and age, BMI tended to be higher in girls than in boys but differences were narrowing across surveys.
Table 1 Mean height and BMI of male and female Brazilian adolescents according to age and survey year
Figures 1 and 2 display annual increment rates from the prior to the next time period for height and BMI, respectively, according to age and sex. Mean rates of height increment were greater among adolescents at age 10–14 years than those at age 15–19 years in both sexes. Mean rates were different among time periods; the highest rates were observed from 1989 to 2002/3. During this period height increase was almost double that relative to the next period in some age groups (Fig. 1).
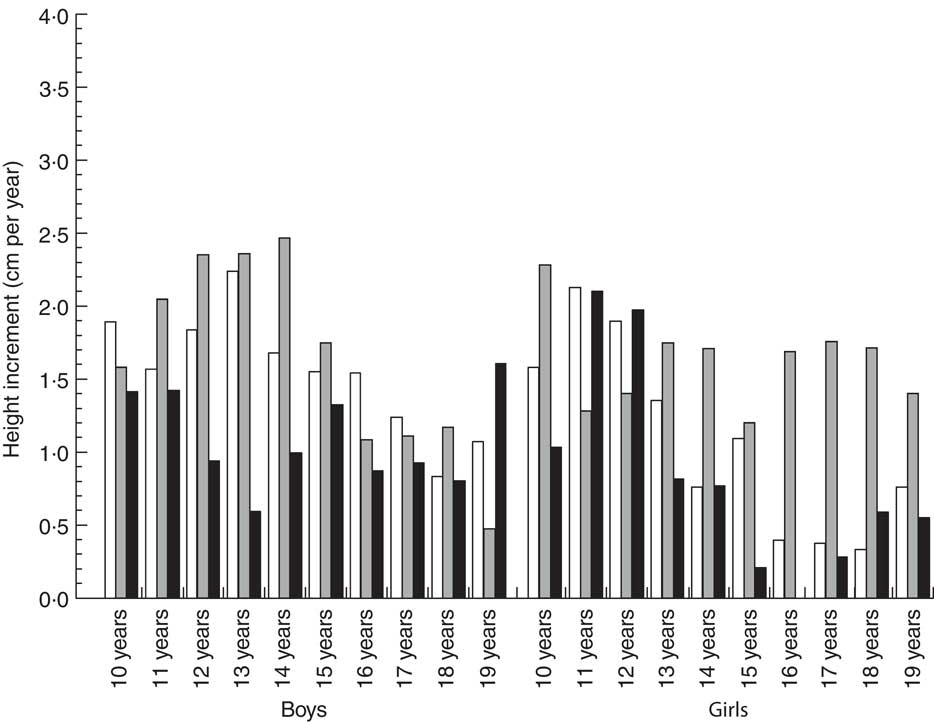
Fig. 1 Rate of annual increment in height of Brazilian adolescents, by age and sex, across three time periods: 1974/5 to 1989 (![]() ), 1989 to 2002/3 (
), 1989 to 2002/3 (![]() ) and 2002/3 to 2008/9 (
) and 2002/3 to 2008/9 (![]() )
)
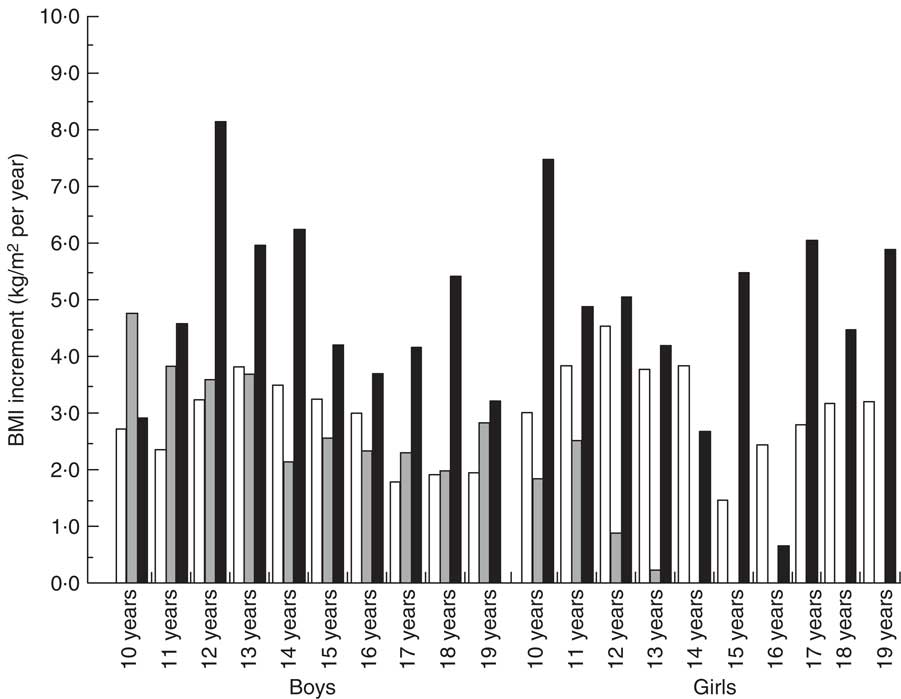
Fig. 2 Rate of annual increment in BMI of Brazilian adolescents, by age and sex, across three across three time periods: 1974/5 to 1989 (![]() ), 1989 to 2002/3 (
), 1989 to 2002/3 (![]() ) and 2002/3 to 2008/9 (
) and 2002/3 to 2008/9 (![]() )
)
From 2002/3 to 2008/9, annual increment of height decreased relative to 1989–2002/3 and was highlighted by the highest increment in BMI rates. At the last time period observed, a span of 6 years, mean of BMI grew exponentially in boys and girls and among all age groups (Fig. 2).
This complementary symmetrical behaviour of height and BMI among periods suggests that height plays a protective role in the evolution of mean body mass and overweight indicators across time in Brazilian adolescents. To evaluate this hypothesis we performed two regressions: the first one, a linear regression, with BMI log-transformed as outcome and the second one, a Poisson regression, with overweight status as outcome. Results of both models, including the interaction term of height × survey year adjusted for income and age, are presented in Table 2.
Table 2 Effects (b coefficients and relative risks (RR)) of height, adjusted for income, age and survey year, on BMI and overweight increase in Brazilian adolescents over four surveys (1974/975, 1989, 2002/3 and 2008/9)
*P<0·01.
Fractional figures in linear regression coefficients indicate the proportion of change in BMI mean associated with that variable. Household per capita income is seen to be a strong vector increasing BMI mean in both sexes. The time span among surveys is another factor strongly associated with increase of BMI mean. Height secular trend is positively associated with increase of BMI mean and overweight.
The survey year variable accounts for all environmental influence except income in our modelling. Among boys, relative risks estimated in Poisson regression indicate that the environmental context from 1989 to 2002/3 is highly associated with overweight, attenuating from 2002/3 to 2008/9. Unexpected high relative risk values observed from 1989 to 2002/3 among boys are partially explained, as well, by the very low prevalence of overweight in 1974/5, the comparison base survey. For girls, relative risk always increases from the prior to the next time period. Household per capita income quintiles are positively associated in a linear way with overweight in both sexes. Isolated height effect is positively associated with risk of overweight in boys and girls. Changing increment rate of height among periods, provided by the interaction term in our models, plays a protective role against overweight in the two last time periods for boys and girls, but the effect is greater in girls. The changing increment of height among time periods is the only vector protective against overweight observed in our analysis.
Discussion
Our analyses indicate three major findings: (i) BMI and height of adolescents have increased in different ways and at different rates throughout four decades in Brazil; (ii) the changing increment rate of height has played a protective role against overweight in adolescents; and (iii) height is associated with overweight among boys and girls in a complex way.
Obesity spreads from older to younger age groups over time. This trend is global and the gap is closing in many countries( Reference Popkin 22 ). In 2009 in Brazil, one in two adults and one in six adolescents were overweight. Six years before, overweight affected one in 2·5 adults and one in eight adolescents( 11 ).
Brazil is facing nutrition and epidemiological transitions and there has been a clear, positive, secular trend in growth across the last four decades among Brazilian adolescents. Below we explore some remarkable socio-economic and health changes carried out from the 1950s to the 1990s to support and discuss our findings. That is, we take those changes as an exposure process for several generations of adolescents to discuss how they could be connected to the increment of height and BMI over the decades.
Adolescents surveyed in 1974/5 lived mainly in rural areas, with low coverage of sanitation and health services. One decade later, adolescents surveyed in 1989 grew up under a new national context with increased gross national product and of students enrolled in college or high school( Reference Paim, Travassos and Almeida 23 ). These changes, combined with expansion of the health-care system( Reference Paim, Travassos and Almeida 23 ), have contributed to decrease infectious diseases, epecially in infancy and early childhood, as well as malnutrition in low-income children and mothers( Reference Victora, Aquino and do Carmo Leal 24 ). Adolescents who grew up in the 1980s or 1990s, who were surveyed in the 2000s, experienced a country under changes in health care and social programmes, and from 1988 onwards, under a new Federal Constitution that has ruled a universal health system( Reference Paim, Travassos and Almeida 23 ).
Thus all major environmental factors that could fuel achievement of the genetic potential for growth in the first years of life were positively improved. These factors influence trends in both height and body mass. In Brazil we have seen a wavering pattern in both trends. Height increment was high from 1989 to 2002/3 and less intense from 2002/3 to 2008/9. Conversely, the increment of BMI was less intense from 1989 to 2002/3 and high from 2002/3 to 2008/9.
A similar wavering pattern for height and body mass was also described in South Korea from 1965 to 2005( Reference Kim, Oh and Lee 25 ). In Poland, taking into account an even larger time period, 1938 to 2010, wavering trends for height and BMI growth were similar. From 2000 to 2010 Polish boys became heavier, except at the ages of 7·5 and 12·5 years, and the authors attributed this to the increase of height over the same period( Reference Kryst, Kowal and Woronkowicz 14 ). In Iran, similar secular trends of height and weight resulted in no change in BMI( Reference Hosseini, Taslimi and Dinarvand 26 ). All of these studies have attributed the trends to socio-economic and health-care changes.
From 2002/3 to 2008/9, Brazilian boys completed their adolescence having grown by about 3 cm per decade, a velocity superior to that observed in China( Reference Ying-Xiu and Shu-Rong 27 ) and inferior to that observed in Western Europe and Japan( Reference Hauspie, Vercauteren and Susanne 28 ). This comparison indicates that probably Brazilian boys can grow more and faster over the next decades once the many factors that have propelled the overweight increase have contributed to the height increase as well. Brazilian girls present values similar to those observed in China over last decades( Reference Ying-Xiu and Shu-Rong 27 ) and to some extent inferior to those observed in Western Europe and Japan( Reference Hauspie, Vercauteren and Susanne 28 ). Again, comparison indicates that Brazilian girls have some quantity of individual growth potential to fulfil to an extent superior to that observed in boys. The question here is if the positive changes will remain for long.
The result of social, economic and health changes has been expressive among Brazilian infants, especially in the last decade. The fall of stunting from 1996 to 2006 can be connected, in about 50 % of all cases, to changes in income and schooling( Reference Monteiro, Benicio and Konno 29 ). Part of that generation analysed by Monteiro et al.( Reference Monteiro, Benicio and Konno 29 ) has been captured at ages 10–12 years in our study and growth is especially expressive among girls. Probably the same factors that fuelled height increases at infancy have continued to impact across age until adolescence.
A remarkable issue in adolescence is that the growth in body mass is more intense than that in height. Height increase was continuous across time periods analysed and more intense from 1989 to 2002/3 for both boys and girls. The height secular trend suggests a protective effect on BMI increase. When the height increase during a period is less than observed in the former one, the increase in BMI is more intense.
The protective effect of height on overweight was modelled as an interaction with survey year in multiple regression. Height effectively played a role in attenuating the expansion of overweight among adolescents in Brazil, even if it was insufficient to block the overweight increase. This trend was more intense in girls than in boys and we can see stabilization in BMI values and a decrease in overweight prevalence from 1989 to 2002/3 in girls.
We highlight that adolescents surveyed in 2002/3 grew up during a huge reform process carried out in health services in the 1980s and laid down in the Brazilian constitution in 1988. We have no variables in our data to provide a separation of that effect from other ones. The variable survey year in the period 1989–2002/3, however, probably includes some of these effects.
What is driving the overweight girls’ trajectory is not clear. Komlos and Baur( Reference Komlos and Baur 30 ) have hypothesized that excess adiposity could act as a hormone promoting fast growth across pre-puberty ages but closing bone epiphyses and stopping growth earlier. We cannot say that it would explain the Brazilian girls’ height trajectory actually. However, the mix of strong increase in height from 2002/3 to 2008/9 among 10–14-year-olds and a virtually null increase in next ages suggests we should investigate this hypothesis when a new anthropometry survey runs.
Our results are submitted to two constraints. The first one is the limited number of variables available to use in the models. Proximal determinants such as physical activity and food patterns were not investigated and some relevant variability was lacking in consequence. The second one is the limitation to explore interactions among variables. As we had few variables available we decided to limit interactions to the combination of survey year and height to avoid any spurious correlations.
Despite these limitations, our finding of alternate trends in height and BMI among Brazilian adolescents shows that social drivers are fuelling overweight and there are few options to block or reverse these trends. The biological driver of height growth has played an effective role in attenuating that, even if insufficient.
Conclusion
Our analyses indicate that BMI and height of adolescents have increased in a wavering and alternate way throughout four decades in Brazil. The rate of height increment has played a protective role against overweight in adolescents.
Results from Brazil add to others that indicate a relevant but limited role of height growth in protecting against overweight. We need to implement more policies and actions to block overweight using other ways, related to social and economic determinants.
Acknowledgements
Financial support: This research received no specific grant from any funding agency in the public, commerecial or not-for-profit sectors. Conflict of interest: None. Authorship: W.L.C. contributed to the conception, design, analysis, interpretation and discussion of the data, and wrote the final version of the manuscript. A.E.M.R. and C.C.E. contributed to the analysis, writing and have revised the manuscript. All authors approved the final version of the manuscript. Ethics of human subject participation: Not applicable.


