The relationship between sugar-sweetened beverage (SSB) consumption and chronic disease is well established(Reference Malik, Pan and Willett1–Reference Hu and Malik10), yet consumption is high in many jurisdictions(Reference Popkin and Hawkes11). Reducing population-level SSB consumption is necessary to improve health(12). Barriers to behaviour change include widespread availability and promotion(Reference Welsh, Lundeen and Stein13) and lack of clear and tangible advice about how much can be consumed(Reference Miller, Braunack-Mayer and Wakefiled14).
The Australian Dietary Guidelines recommend ‘limiting’ food and beverages considered unhealthy without quantifying a limit(15). Moreover, consumers find nutrition information panels, which include sugar, difficult to interpret(Reference Rothman, Housam and Weiss16). Health Star Ratings – Australia and New Zealand’s interpretive front-of-pack labelling scheme – is intended to facilitate consumer understanding; however, there has been low uptake of this voluntary system(Reference Brownbill, Braunack-Mayer and Miller17). Other countries have overcome such limitations with mandatory warning labels or via policies such as taxes on SSBs(Reference Backholer, Blake and Vandevijvere18,19) . However, many countries, including Australia, are yet to implement regulatory change despite the need for action to address high rates of overweight and obesity(20) and the known contributing factor of high SSB consumption.
To date, most population studies of adult SSB consumers have examined only demographic characteristics as correlates of current consumption, with higher consumption rates among males, younger adults and socioeconomically disadvantaged populations(21–Reference Miller, Ettridge and Wakefield31). While these studies are informative, for behaviour change to occur, it is useful to identify modifiable predictors of SSB consumption that can be targeted through public health interventions. Behavioural intention is an important antecedent to behaviour change, with the intention–behaviour pathway described in multiple theories, including the Theory of Reasoned Action(Reference Fishbein and Ajzen32), Theory of Planned Behaviour (TPB)(Reference Ajzen33) and the Integrated Model of Behavioural Prediction (IM)(Reference Fishbein34). While research shows that intentions may be influenced by other cognitive influences and situational cues resulting in an intention–behaviour gap, intentions have been associated with corresponding behaviour in many contexts(Reference Papies35,Reference Sheeran and Webb36) .
Studies of adolescents/young people using the TPB have shown that attitudes, subjective norms and/or perceived behavioural control variables were associated with intentions to reduce consumption, which in turn were associated with lower rates of actual consumption(Reference Riebl, MacDougal and Hill37–Reference Sharma, Catalano and Nahar41). These studies also showed that more distal variables such as parental discouragement, low availability in the home and opportunity to purchase water instead of SSBs when needed were also associated with change in SSB consumption(Reference Riebl, MacDougal and Hill37,Reference Ezendam, Evans and Stigler39–Reference Sharma, Catalano and Nahar41) . Non-TPB variables (takeaway food consumption, availability of soda in home, depression diagnosis and heart disease) were also related to higher SSB consumption in an adult population, with type 2 diabetes related to lower consumption(Reference Miller, Ettridge and Wakefield31). Using the IM, one study found that nutritional knowledge (the only non-demographic predictor) predicted consumption(Reference Gase, Robles and Barragan42). Another study among overweight and obese adults found that perceived behavioural control, environment and intentions had the largest influence on SSB consumption(Reference Collado-Rivera, Branscum and Larson43). These theories offer a useful framework to guide an understanding of key influences on behaviour, but the literature suggests that other modifiable factors may be important when targeting health behaviour change.
One such factor is risk perception, acknowledged as a key determinant of behaviour by other well-known behavioural theories, e.g., Health Belief Model (HBM)(Reference Rosenstock44–Reference Ferrer, Klein and Persoskie46). Increasing awareness of health risks is a key strategy used in emerging policy approaches to reduce SSB consumption, with intervention studies showing a reduction in SSB selections following exposure to mass media campaigns(Reference Morley, Niven and Dixon47–Reference Boles, Adams and Gredler49) and on-package warning labels(Reference Grummon and Hall50). Cross-sectional population surveys have also established associations between current consumption and knowledge of health risks(Reference Rampersaud, Kim and Gao51–Reference Park, Lundeen and Pan54) or the healthiness of various beverage types(Reference Thomson, Worsley and Wang55–Reference Munsell, Harris and Sarda58). However, SSB-related health risk perceptions have not been assessed in population studies in relation to intention to change behaviour. Intention may be overlooked as an intermediary variable in some theories that incorporate risk perceptions as a direct determinant of behaviour (e.g. HBM), and risk perception may be excluded from studies of SSB consumption among younger participants because the health risks are considered too distal to be a predictor(Reference Zhang, Wong and Zhang59). Establishing the extent to which risk perception relates to intentions to reduce SSB consumption would add to the evidence of risk perception as a potentially modifiable factor for incorporation into SSB interventions.
In the absence of large longitudinal studies examining the relationship between predictors and behaviour change, examining the intention to change can offer insights into the modifiable factors to increase intentions and potentially assist in reducing the consumption of SSBs. We compiled a list of predictor variables from the literature to test which were more strongly associated with intentions to reduce SSB consumption in a subsample of regular SSB consumers drawn from a nationally representative population survey. Specifically, we tested four sets of variables: (1) demographics, (2) SSB attitudes and behaviour, (3) health risk perceptions and (4) social and environmental exposure.
Methods
A nationally representative sample of Australian adults (≥18 years; n 3430; participant rate = 44 %) was surveyed in 2017 using a computer-assisted telephone interview lasting approximately 20 min. Participants were sourced through random-digit dialling of landline and mobile phones (35:65 split) in accordance with telecommunication use in Australia(60). Full methodological details of the survey are reported elsewhere(Reference Miller, Dono and Wakefield61). This study reports on a subsample of 1165 participants who met the following criteria: (1) regularly (at least weekly) consumed either soda, fruit drinks, sports drinks or energy drinks and (2) consumed at least one SSB in the past week.
The self-report questionnaire (see Supplementary Material) included intention to reduce consumption; demographic and health characteristics (i.e. age, gender, area-level socioeconomic disadvantage (postcode matched to the Index of Relative Socioeconomic Disadvantage based on 2011 Census data(62)), BMI, ever received a diagnosis of type 2 diabetes, heart disease, arthritis, depression or lung condition); SSB consumption (i.e. past week and regular SSB consumption, perception of whether amount of SSB consumed is appropriate, habitual consumption and difficulty in reducing consumption); health risk perceptions (i.e. perception of BMI, likelihood of benefitting from reduced consumption and current and future health risks associated with SSB consumption); and social and environmental exposure (i.e. takeaway food consumption, availability of SSBs at home and at others’ homes, perceptions of others’ SSB consumption and perceived pressure to consume SSBs).
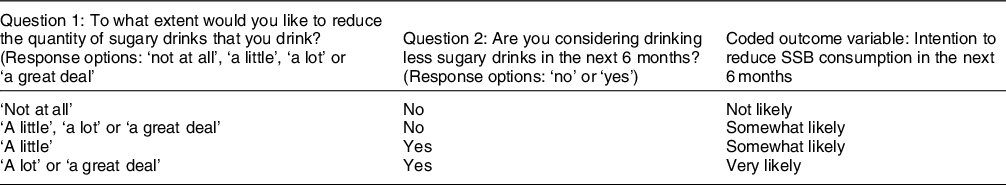
The outcome variable, ‘intention to reduce SSB consumption in the next 6 months’, was derived from responses to two questions: extent they would like to reduce SSB consumption, and considering drinking less sugary drinks in the next 6 months as described in Table 1. Four sets of predictor variables – (1) demographics, (2) SSB consumption, (3) health risk perceptions and (4) social and environmental exposure – were tested against the outcome variable using nominal logistic regressions. ‘Somewhat likely’ was used as the reference category (i.e. ‘very’ v ‘somewhat’ likely and ‘not at all’ v ‘somewhat likely’ (order reversed to ‘somewhat’ v ‘not at all’ likely to facilitate interpretation of categories relative to ‘somewhat likely’)). Each predictor was tested independently of other variables (unadjusted) and in combination with other variables in the same grouping while controlling for demographic characteristics (adjusted). Statistically significant associations were identified using a P-value <0·05.
Table 1 Coding of outcome variables from responses to questions about intentions to reduce sugary drink consumption

Results
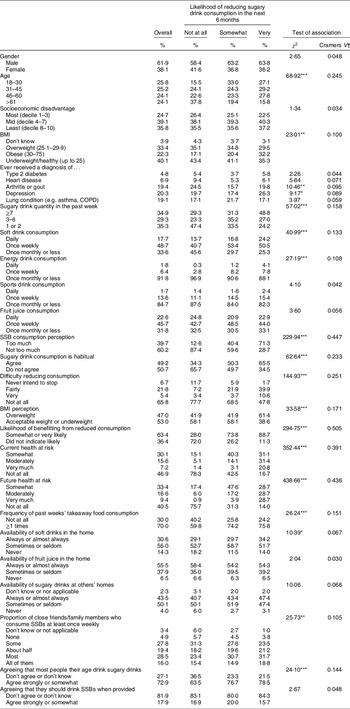
Demographic characteristics of the participants who were regular SSB consumers are reported in Table 2. Age was evenly distributed, but there were more males than females, and fewer participants in the most socioeconomic disadvantaged deciles than the mid- and least disadvantaged deciles. About one-fifth of participants had ever received a diagnosis of arthritis/gout, depression or a lung condition, but very few had type 2 diabetes or heart disease. These variables were controlled for in the adjusted logistic regression analyses. Regarding the likelihood of reducing SSB consumption in the next 6 months, 30·1 % indicated it was ‘not at all’ likely, 43·9 % indicated it was ‘somewhat’ likely and 25·2 % indicated it was ‘very’ likely. As shown in Table 2, the variables with the strongest relationship with the likelihood of reducing consumption in bivariate analyses were perceptions about benefitting from reduced consumption, future health risks and current consumption (Cramer’s V > 0·4).
Table 2 Sample characteristics by the likelihood of reducing sugary drink consumption in the next 6 months

Note. *P < 0·05; **P < 0·01; ***P < 0·001.
† Cramer’s V is a measure of effect size for nominal variables that can range between 0 and 1, with values closer to 1 indicating a stronger association.
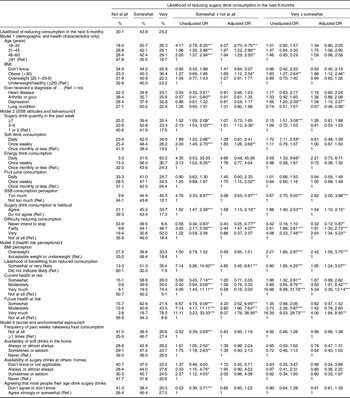
The nominal logistic regression results are reported in Table 3. The most consistent predictors of intending to reduce consumption (across both unadjusted and adjusted results) were variables relating to the perceptions of SSB consumption and health risks. Specifically, greater intentions to reduce consumption were more likely among those who perceived themselves as consuming too much; that their consumption was habitual; that it would be fairly difficult to reduce consumption; that they would likely benefit from reduced consumption; and that their future health was very much at risk. Furthermore, those who perceived that their future health was very much at risk were 8·07 (95 % CI 1·76, 36·95) times more likely to indicate ‘somewhat’ compared to ‘not at all’ likely, and 4·06 (95 % CI 1·84, 8·95) times more likely to indicate ‘very’ compared to ‘somewhat’ likely to reduce consumption.
Table 3 Nominal logistical regression analyses

Ref. = reference category.
Note. Variables included in the analysis but results not reported as they were not statistically significant in any of the models: gender; socioeconomic disadvantage; ever had type 2 diabetes; sport drink consumption; availability of juice in the home; proportion of friends consuming sugary drinks; pressure to consume sugary drinks.
*P < 0·05; **P < 0·01; ***P < 0·001.
† Controlling for demographic and health characteristics: age, gender, socioeconomic disadvantage, BMI, ever have a diagnosis of type 2 diabetes, heart disease, arthritis or gout, depression or lung condition.
There were some additional statistically significant associations for predicting the likelihood of reducing consumption, but there was a different set of predictors for indicating moderate v high likelihood of change. Based on adjusted ORs, moderate likelihood of change (i.e. ‘somewhat’ rather than ‘not at all’) was more common among younger participants, those classified as obese, those consuming 3–6 SSBs in the past week, those consuming soft drinks or fruit juice weekly and those perceiving their future health to be at risk. Conversely, a high likelihood of change (i.e. ‘very’ rather than ‘somewhat’) was more common among those without a lung condition diagnosis, classified as obese, perceiving self as overweight and perceiving current health to be at risk. Social and environmental exposure variables had significant bivariate associations with moderate likelihood of change, whereby increased exposure reduced intentions. However, these associations were non-significant in the multivariate analysis.
Discussion
An intention to drink lesser SSBs was more likely among those who perceived themselves as consuming too much and to be susceptible to health consequences of overconsumption than those who did not hold these views. While it is unknown whether these intentions would translate into behaviour change, these results suggest that people who consider themselves to benefit from reducing consumption may be most responsive to interventions aimed at encouraging people to consider their personal risk. Furthermore, interventions that successfully highlight adverse consequences of consuming SSBs may be particularly influential in changing consumption intentions among regular SSB consumers. The results also indicate the importance of educating those at risk (high consumers) who do not view their consumption as problematic. High consumers with low intention to change may benefit from interventions/campaigns that communicate the health risks of consumption, which may lead to the consideration of behaviour change.
These findings are consistent with experimental and field studies showing that exposure to SSB-related health information corresponds with increased perceptions of personal health risks and reduced intentions to select an SSB from a range of drink options(Reference Morley, Niven and Dixon47–Reference Grummon and Hall50). Similarly, risk perceptions have been linked to intentions and behaviour in other domains, although the direct effects of risk appraisals on behaviour are generally small(Reference Brewer, Chapman and Gibbons63,Reference Sheeran, Harris and Epton64) . Also noteworthy is that the indirect route of risk perceptions via intentions may have limited impact in real-world settings due to barriers to implementation resulting in an intention–behaviour gap(Reference Papies35,Reference Sheeran and Webb36) . Michie et al.’s(Reference Michie, van Stralen and West65) framework suggests that three essential conditions are needed for implementing a successful behaviour change: capability, opportunity and motivation. Accordingly, intent is only one component of behaviour change, but this does not diminish its importance when developing public health interventions. Further research is needed to investigate what additional factors will support those intending to reduce their SSB consumption to succeed.
More broadly, for risk perceptions to have any influence, they should be conveyed in a way that limits opportunity for self-exemption, for example, well-designed social marketing campaigns(Reference Morley, Niven and Dixon47,Reference Robles, Blitstein and Lieberman66) and factual on-bottle warning labels(Reference Acton and Hammond67–Reference VanEpps and Roberto73). Interventions/campaigns will need to address the self-exemptions that may also arise from people being unclear on what constitutes risky SSB consumption, unaided by the lack of quantified limits in the Australian Dietary Guidelines(15). Qualitative data indicate that Australian consumers’ perceptions of excessive consumption vary substantially(Reference Miller, Braunack-Mayer and Wakefiled14). Moreover, while participants could name the potential health effects associated with SSB consumption, they tended to see these health effects as having low personal relevance and that could be offset by ‘balancing’ sugary drink consumption with diet and exercise(Reference Miller, Braunack-Mayer and Wakefiled14). Interventions/campaigns will need to be designed to avoid dismissive reactions to information regarding unhealthy consumption behaviours that are common(Reference van ‘t Riet and Ruiter74) and reinforced by industry marketing practices that downplay the risks(75).
Each of the social and environmental exposure variables differentiated those ‘somewhat’ from ‘not at all’ likely to reduce SSB consumption in the bivariate analyses, but not in the multivariate analyses adjusting for demographics. Age remained a significant predictor throughout and so could have masked the relationship due to young adults being both higher SSB consumers and more influenced by social and environmental variables. Relationships between social and environmental variables and a reduction, or intended reduction, in SSB consumption were observed in studies of adolescents and university students(Reference Riebl, MacDougal and Hill37,Reference Ezendam, Evans and Stigler39,Reference Deliens, Clarys and De Bourdeaudhuij40,Reference Gregorio-Pascual and Mahler76) . Moreover, population-level environmental interventions addressing SSB consumption have been effective(Reference von Philipsborn, Stratil and Burns77).
Limitations of the study include the cross-sectional design and self-reported intentions to change. There is a noted intention–behaviour gap(Reference Papies35,Reference Sheeran and Webb36) , and therefore, the extent to which intentions translate into behaviour are ultimately unknown in this study. Measures were based on existing literature but were rudimentary (i.e. single-item questions for complex behaviours) due to questionnaire length and telephone survey methodology. Future research would benefit from using validated measurement scales, conducting follow-ups of behaviours and investigating mediators of the relationship between social and environmental factors and SSB consumption, as suggested in the theoretical models of behaviour change. To truly assess the predictors of change in behaviour(s), a longitudinal study is warranted, but was beyond resourcing of the current study. The results may not be generalisable to jurisdictions where population-wide interventions have already been implemented.
Obesity and other health effects associated with SSB consumption are global major burdens of disease. However, many countries have been slow to implement population-wide strategies to reduce consumption. This study showed that those who are aware of the risks and acknowledge that they consume too much have intentions to change. Capitalising on these intentions to facilitate behaviour change is possible through policy reforms that have successfully reduced SSB consumption in other countries (e.g. taxes, warning labels) and would add value to educational approaches that raise the awareness of health risks associated with SSB consumption.
Acknowledgements
Acknowledgements: Thank you to the Social Research Centre for conducting the fieldwork component of the study. Financial support: This research was supported by a National Health and Medical Research Council (NHMRC) project grant. C.M. is supported by an NHMRC Career Development Fellowship, a Cancer Council Principal Research Fellowship, and a Heart Foundation Future Leader Fellowship, and M.W. is supported by an NHMRC Principal Research Fellowship. These funders have not had any role in the design, analysis or writing of this article. Conflict of interest: C.M., K.E., J.D., M.W., J.C., D.R., S.D. and G.W. declared no competing interests. S.P. declares expert membership of Australian government’s Health Star Ratings Committees, and J.C. declares membership of the Social Sciences and Economy Advisory Group of Food Standards Australia New Zealand. Authorship: C.M. conceptualised and led the design of the study with substantial contributions from J.D., K.E., M.W., S.P., S.D., J.C., D.R., G.W. and J.M. J.D. and K.E. coordinated the questions, and J.D. conducted the analyses. J.D. and C.M. drafted the manuscript, and all authors contributed to the interpretations of data and critically revised the article for important intellectual content. All authors approved the final manuscript. Ethics of human subject participation: This study was conducted according to the guidelines laid down in the Declaration of Helsinki, and all procedures involving research study participants were approved by the University of Adelaide Human Research Ethics Committee. Verbal consent was obtained from all participants prior to commencing the telephone interview and was formally recorded.
Supplementary material
For supplementary material accompanying this paper visit https://doi.org/10.1017/S1368980021000239