


The Household Dietary Diversity Score (HDDS) has been used in multiple countries as a proxy indicator of the household access to food component of food security( Reference Jones, Ngure and Pelto 1 – 3 ). Using this tool, previous studies have shown that increases in household dietary diversity are associated with increasing socio-economic status and household food security( Reference Hatloy, Hallund and Diarra 4 – Reference Kennedy, Ballard and Dop 6 ). Promoting food security continues to be an important priority for the Ethiopian government( 7 ) because approximately 10·2 million people in Ethiopia were food insecure in February 2016( 8 ).
In addition to providing a proxy measure of food security, the HDDS also gives an idea of the different types of foods people are consuming. Monotonous diets high in carbohydrates and low in nutrient-rich foods are common in many parts of the world, even among households who can afford to eat better. Diets high in carbohydrates but low in protein and micronutrients can result in malnutrition, even if one’s daily energy supply is adequate( Reference Greiner 9 , Reference Nubé and Voortman 10 ). Knowing the types of foods consumed is particularly important in the Ethiopian context given that food consumption patterns there are diverse and no single crop dominates the national food basket( Reference Berhane, Paulos and Tafere 11 ). Additionally, diets in Ethiopia are known to be monotonous and the lack of dietary diversity is one of the key challenges to improving child health and nutrition in Ethiopia( 12 ). There is also a high prevalence of vitamin A deficiency in Ethiopia. In 2010 it was reported that, nationally, 37·7 % of children between 6 and 71 months of age had deficient serum retinol levels( Reference Demissie, Ali and Mekonen 13 ). This suggests that vitamin A-rich foods are not being adequately consumed in Ethiopia.
Given that households in all regions of Ethiopia have limited dietary diversity, the objectives of the present study were to: describe household dietary diversity in four zones of the Tigray region of Ethiopia; consider the relationship between household dietary diversity and consumption of vitamin A-rich foods; and consider if a relationship between household dietary diversity and food security status exists in the Tigray region of Ethiopia after controlling for administrative zone, household economics, education and other household characteristics.
Project background
The International Potato Center was founded in 1971 as a research-for-development institution committed to achieving food security, improved well-being and gender equity for poor people in root and tuber farming and food systems of the developing world. In 2011 with funding from Irish Aid, the International Potato Center initiated its first integrated agriculture and nutrition programme in five woredas (districts) in the Tigray region of northern Ethiopia with the goal of increasing the production and consumption of orange-fleshed sweet potato (OFSP) to reduce vitamin A deficiency and improve overall dietary diversity and nutrition for rural households. In 2013, the International Potato Center scaled-up its project, adding five woredas in four administrative zones of Tigray: Central, Eastern, South Eastern and Southern. The present study uses data from one component, the baseline survey, of an overall impact evaluation that collected cross-sectional demographic and socio-economic data from households within the study site.
Methods
Sample
The sample included 300 households from ten districts in the Tigray region of Ethiopia. Trained enumerators collected data from the household heads in the local language using a structured survey. Data were collected in February and March of 2014. Specific kebeles within these woredas were selected through a joint planning process with the Board of Agriculture and other implementing partners. Participant households were identified based on the following selection criteria: households where primary targets for food security interventions live (children aged 6–59 months, lactating mothers and pregnant women); ability (land and labour) to grow OFSP; and a physical location that is accessible for trainers and International Potato Center staff. Ethical approval was obtained from the Health Sciences Institutional Review Board at the University of Wisconsin–Madison. Participants provided verbal consent to participate in the study prior to data collection.
Measures
The independent variable, household dietary diversity, was calculated using the guidelines outlined in Swindle and Bilinsky’s report for the Food and Nutrition Technical Assistance project( Reference Swindale and Bilinsky 14 ). Household heads were asked if in the last 24 h anyone in the household had eaten a list of forty-five different foods from twelve food groups: cereals; roots and tubers; vegetables; fruits; meat and poultry; eggs; fish and seafood; pulses, legumes and nuts; dairy and dairy products; oils and fats; sugar and honey; and beverages (see online supplementary material, Supplemental Table 1). Separately, the percentage of households that had consumed vitamin A-rich foods in the last 24 h was identified based on whether they reported having eaten one or more of the following foods: mango; papaya; OFSP; pumpkins or squash that are orange inside; carrots; dark leafy greens; moringa; and berbere or mitmita. Berbere and mitmita are traditional Ethiopian spice mixtures that blend ground red chillies with other seasonings. Both are spicy, but mitmita is spicier than berbere.Footnote *
To assess potato production, consumption and cooking practices, households were asked the following questions: ‘Have you grown Irish potatoes in the last 12 months?’ (yes, no); ‘Have you grown-white fleshed sweet potato in the last 12 months?’ (yes, no); ‘Have you grown OFSP in the last 12 months?’ (yes, no); ‘Has anyone in the household consumed OFSP in the last 24 h?’ (yes, no); and ‘Has any child aged 6–59 months consumed OFSP in the last 24 h? (yes, no). Finally, participants were asked, ‘Do you eat OFSP with any fat?’ (do not consume OFSP, never, rarely/sometimes).
Enumerators recorded the administrative zone where participants lived (Central, Eastern, South Eastern or Southern). We measured economic characteristics of a household using multiple measures. We measured households’ tropical livestock holdings where cattle and oxen were worth 0·7 units, sheep and goats were worth 0·1 units, and chickens were worth 0·01 units( Reference Otte and Chilonda 15 ). Additional household economic characteristics that were collected included: average size of landholdings (in timad); on-farm income (yes, no); off-farm income (yes, no); access to credit (yes, no); has electricity (yes, no); has latrine (yes, no); has radio (yes, no); and has cell phone (yes, no). For education variables, the highest level of education completed by the household head was identified (illiterate, read/write, primary school (1–6 years), secondary school (7–10 years), vocational school (11–12 years), college or above). For the ordinal logistic regression model, the education variable was collapsed into two categories: those who were illiterate and everyone else (read and write or above). For household characteristics, the number of people in the household was summed and we asked if the household had a female head (yes, no).
Household food security was determined using two measures. A modified version of the Household Food Insecurity Access Scale (HFIAS) measurement tool was used to assess households’ food security status in the last 30 d( Reference Coates, Swindale and Bilinsky 16 ). Household heads were asked six yes/no questions related to different dimensions of food security such as worry about lack of food, insufficient quality, eating smaller meals, eating fewer meals, not having enough food and going to sleep hungry (Table 1). If they answered yes, they were asked to report the frequency of the experience (rarely, sometimes or always). Table 1 lists the questions asked and how households were classified (food secure, mildly food insecure, moderately food insecure, severely food insecure)( Reference Coates, Swindale and Bilinsky 16 ). Households were classified according to their most severe response to get a measure of household food security (i.e. if any of their responses indicated severely food insecure, then that household was classified severely food insecure). Due to low numbers in the mild, moderate and severely food insecure categories, these three categories were collapsed into one for the ordinal logistic regression model for a dichotomous variable (food insecure v. food secure). Subsequently, in order to gauge seasonal experiences of food insecurity, we asked ‘Was there a period in the last 12 months when you did not have enough food for your household?’ (yes, no). If the participant responded yes, he/she was asked to name all the months when this applied. Then, the total number of months of self-reported insufficient food to feed the household was totalled from this variable.
Table 1 Description of food insecurity classification
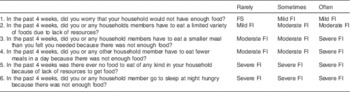
FS, food security; FI, food insecurity.
Analysis
Responses were compared for the variables of interest using χ 2 tests for categorical variables and one-way ANOVA for continuous variables to test for independence across the four administrative zones. To further describe household dietary diversity, a cumulative HDDS was created by adding the total number of food groups consumed by a household, ranging from 0 to 12. Next, to understand dietary diversity within the Tigray context, the sample was divided into tertiles (low, medium and high dietary diversity). In this sample, households eating five food groups or fewer had low dietary diversity, six food groups had medium dietary diversity and seven or more food groups had high dietary diversity. To understand what food groups were most commonly eaten in each dietary diversity tertile, the percentage of households that ate each of the twelve food groups was calculated by tertile( Reference Kennedy, Ballard and Dop 6 ). We listed the food groups that were consumed by greater than one-third of households in each tertile( Reference Kennedy, Ballard and Dop 6 ). The χ 2 test was used to test if vitamin A consumption varied by HDDS tertile. Potato production, OFSP consumption and OFSP cooking practices by administrative zone were documented.
To explore the relationship between household dietary diversity and food security status, staged ordinal logistic regression models were run using the statistical software package Stata 13. Four models were created. In model 1, the agricultural zone was included. In model 2, economic variables and education variables were included plus model 1. In model 3, household characteristics were included plus model 2. In model 4, food insecurity variables were included plus model 3.
Results
Of the 300 households, the Central, Eastern and South Eastern administrative zones each had ninety households and the Southern administrative zone had thirty households. Table 2 describes the household economic, education and other characteristics, food security and dietary diversity by administrative zone. Households had on average 2·1 tropical livestock holdings; there were significant differences across zones, with the Central zone having an average of 2·8 holdings while the Eastern zone averaged 1·6 holdings. Landholding size varied across zones, with the Eastern zone having an average of 2·0 timads of landholdings per household and the Central, South Eastern and Southern zones having 4·2, 3·7 and 3·5 timads (4 timads=1 ha), respectively. Households in the South Eastern zone were significantly more likely to have a radio than households in the Southern zone, while households in the Eastern and Southern zones were significantly more likely to have a cell phone compared with households in the Central and South Eastern zones. Households in the Southern zone had significantly smaller families compared with the other three zones. Households in the Eastern zone were food insecure for significantly more months out of the year than other households. Additionally, households in the Eastern zone were significantly less likely to be food secure than households in the other zones. Finally, there were differences in dietary diversity across the zones. Households in the South Eastern and Southern zones were significantly more likely to have high dietary diversity while households in the Central and Eastern zones were significantly more likely to have low dietary diversity than the households in the other two zones.
Table 2 Wealth, education, family characteristics, food security and dietary diversity characteristics, overall and by administrative zone, among rural households (n 300) in Tigray, Ethiopia, February–March 2014
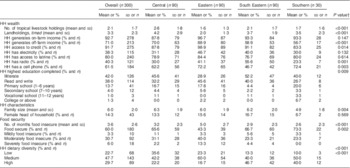
HH, household.
† P values measure any difference between the four administrative zones, using a Pearson χ 2 test for differences in categorical variables and one-way ANOVA for differences in means for continuous variables.
Table 3 describes the food groups that were eaten in each dietary diversity tertile by greater than one-third of the households. Greater than one-third of the households in all three tertiles consumed foods in the following food groups: cereals, beverages, pulses, sugar, vegetables and fats. In the high dietary diversity tertile, greater than one-third of households also consumed eggs and fruit. On average, 86 % of households consumed a vitamin A-rich food in the last 24 h; this did not differ by administrative zone or by dietary diversity tertile. However, of the households reporting eating vitamin A-rich foods, 77 % ate berbere only (data not shown). Table 4 describes potato production and OFSP consumption; 7·7 and 1·3 % of households grew Irish potatoes and white-fleshed sweet potatoes, respectively, in the last 12 months. Only 1·7 % of households grew OFSP in the last 12 months and this occurred only in the Central and South Eastern zones (Table 4). Only 1·7 % of households and children aged 6–59 months consumed OFSP in the last year. The majority, 82 % of households, did not consume OFSP; and of those that did consume OFSP (n 54), two households consumed OFSP with fat.
Table 3 Food groupsFootnote † consumed by greater than one-third of rural households (n 300) by dietary diversity tertile, Tigray, Ethiopia, February–March 2014
† Food groups included beverages; cereals; roots and tubers; vegetables; fruits; meat and poultry; eggs; fish and seafood; pulses, legumes and nuts; dairy and dairy products; oil and fats; sugar and honey.
Table 4 Potato and sweet potato production, consumption and cooking practices, overall and by administrative zone, among rural households (n 300) in Tigray, Ethiopia, February–March 2014
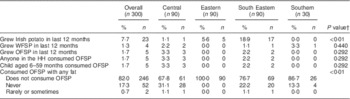
WFSP, white-fleshed sweet potato; OFSP, orange-fleshed sweet potato.
† P values measure any difference between the four administrative zones using a Pearson χ 2 test.
Table 5 includes results from the ordinal logistic regression models. In model 1, households in the South Eastern and Southern zones were 3·7 (95 % CI 2·1, 6·7) and 3·2 (95 % CI 1·5, 7·1) times more likely to have increasing levels of dietary diversity compared with households in the Central zone. In model 2, having on-farm income (OR=5·5; 95 % CI 2·1, 14·6), having access to credit (OR=5·2; 95 % CI 2·0, 13·0), having electricity (OR=2·6; 95 % CI 1·6, 4·3), having a radio (OR=1·8; 95 % CI 1·1, 2·9) and households where the head of household can read and write (OR=1·8; 95 % CI 1·1, 2·9) were significantly more likely to have increasing levels of dietary diversity. In model 3, all the previous variables were still significant; however, the family size and having a female head of household did not significantly affect levels of dietary diversity. In model 4, living in the South Eastern (OR=3·5; 95 % CI 1·8, 6·7) or Southern administrative zone (OR=3·7; 95 % CI 1·5, 9·3), having on-farm income (OR=7·3; 95 % CI 2·7, 20·2), having access to credit (OR=4·2; 95 % CI 1·6, 11·2), having a radio (OR=1·7; 95 % CI 1·0, 2·7), having a head of household who can read and write (OR=1·7; 95 % CI 1·0, 2·9) and being food secure (OR=1·8; 95 % CI 1·0, 3·2) were all significantly associated with increasing levels of dietary diversity.
Table 5 Factors increasing the odds of dietary diversity among rural households (n 300) in Tigray, Ethiopia, February–March 2014
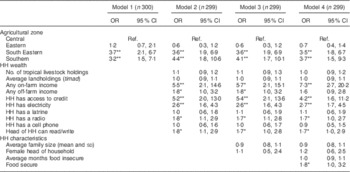
HH, household; ref., reference category.
Model 1 adjusted for agricultural zone. Model 2 adjusted for economic variables and education variables plus model 1 variable. Model 3 adjusted for household characteristics plus model 2 variables. Model 4 adjusted for food insecurity variables plus model 3 variables.
*P<0·05, **P<0·01.
Discussion
Overall, households consumed foods from six different food groups at the time of these surveys and the majority of the households had consumed some form of vitamin A in the last 24 h. Less than 5 % of the households reported producing or consuming OFSP. Additionally, increasing levels of dietary diversity were associated with improved food security in Tigray.
The number of different food groups that were consumed by people at all three levels of dietary diversity was impressive. It is known that food consumption patterns are often cyclical and vary in relation to the harvest( Reference Hirvonen, Taffesse and Worku Hassen 17 ). This survey was conducted one to two months after the main annual harvest and therefore we do not think these findings are representative of food consumption patterns throughout the whole year. Nevertheless, at this time of year it appears that cereals, pulses and vegetables are the staples consumed in Tigray. Additionally, it is not surprising to us that only in the highest dietary diversity tertile did greater than one-third of households consume any animal-source food because this type of food tends to be more expensive and is often sold for cash income rather than consumed by households. This finding is consistent with a previous study showing that consumption of food from animal sources is associated with higher economic status( Reference Herrador, Perez-Formigo and Sordo 18 ). It is also important to recognize that in Tigray a large majority of the population is Orthodox Christian. These surveys were conducted during the time of year when Orthodox Christians were fasting from meat consumption. Seventy-two per cent of our sample reported fasting and this could have influenced the number of households who reported eating meat.
The majority of households reported eating some source of vitamin A in the last 24 h. However, because three-quarters of the people who reported eating any vitamin A-rich food reported eating only berbere, the high consumption of vitamin A-rich foods likely does not equate to adequate vitamin A consumption.
All potato (Irish potato, white-fleshed sweet potato and OFSP) production is relatively limited in the Tigray region. OFSP is a newly introduced crop and it may be challenging for households to embrace its production especially given the fact that other potatoes are not commonly grown. Additionally, households often have limited and/or seasonal market access to OFSP and other foods that they do not produce themselves. Further, there are cultural/behavioural preferences to consume cereals and other grains, so even in areas where OFSP production rises there are other challenges to increasing consumption. For example, our data show that of the few households that do consume vitamin A-rich foods, none of the households cook their OFSP with fat. Because vitamin A is a fat-soluble micronutrient, to promote maximum absorption, OFSP should ideally be eaten with fat( 19 ). Our findings support the fact that much effort will be required to popularize the crop and develop different recipes and food products that the rural communities will be willing to use( Reference Kurabachew 20 ).
As suggested in previous work( Reference Jones, Ngure and Pelto 1 , Reference Kennedy, Berardo and Papavero 2 , Reference Hoddinott and Yohannes 5 ), increasing level of dietary diversity in Tigray is associated with increasing food security. This association remained even after controlling for location and household economic, education and other characteristics. Administrative zone also impacted dietary diversity: the results indicate higher levels of dietary diversity in the South Eastern and Eastern Zones, potentially due to these zones’ closer proximity to urban markets. Additionally, several economic measures (i.e. on-farm income, access to credit, having a radio) were also associated with increased dietary diversity. This supports the idea that household dietary diversity is a measure of economic access to food in our study: families with more money will have greater dietary diversity. Finally, having a household head who could read and write was associated with increasing levels of dietary diversity. This could be because household heads who can read and write likely have more formal schooling where they could have learned the value of having a diversified diet. Alternatively, being able to read and write could be a proxy indicator for household wealth.
Several methodological issues may limit the generalizability of our findings. The data were collected from a convenience sample of households, some of which were proximate to the main roads, and we were not able to survey households that were the most remote. Households that are more proximate to the main road may be different from more remote households because households closer to the main road have easier access to transport and markets. The study was conducted right after the harvest which is likely a time with more food security and therefore these results are not generalizable to all times of the year. Further, there could be under-reporting of food insecurity due to the sensitive nature of the questions around food security and foods consumed. Moreover, given the diverse nature of the foods consumed in different parts of Ethiopia( Reference Berhane, Paulos and Tafere 11 ), we do not think this information is generalizable to the country as a whole. Additionally, due to self-report or issues with translation we may have misclassified some families. Finally, there are no set cut-off points for defining low, medium and high dietary diversity so these results are context specific.
There are also several strengths to the current study. First, we surveyed and collected data on a rural population in Tigray, Ethiopia. Second, we used an exhaustive list of foods when asking families about the foods they had eaten in the last 24 h, which gives us confidence in the data.
Our study provides evidence that there is some dietary variety in foods consumed in Tigray post-harvest; however, animal-source foods are commonly consumed only among the wealthiest families. Additionally, the study provides additional evidence regarding the positive association between household food security and increasing dietary diversity. Future research should measure household dietary diversity at different time points throughout the year to see how it changes and compare intra-household food consumption patterns to see if all people in the household are eating similar types of foods or if certain family members get preferential treatment. Given the relationship between food security and increasing dietary diversity, it will be important for the government, local non-profit organizations and public health leaders in the region to continue to focus on these areas in order to enhance health and well-being among the most vulnerable.
Acknowledgements
Acknowledgements: The authors would like to thank all the participants and the staff members at the International Potato Center and the University of Wisconsin School of Medicine and Public Health for their contributions to the project as a whole. Financial support: The financial support for this study provided by Irish Aid is gratefully acknowledged. The contents of this document are the sole responsibility of the authors and do not reflect the views of Irish Aid. Irish Aid had no role in the design, analysis or writing of this article. Conflict of interest: None. Authorship: R.J.S. participated in formulating the research question, carrying it out, analysing the data and writing the manuscript. H.T. participated in formulating the research question, designing the study, carrying it out and writing the article. F.A. participated in designing the study, carrying it out and writing the article. W.J. participated in designing the study, carrying it out, analysing the data and writing the manuscript. H.B. participated in formulating the research question, designing the study, analysing the data and writing the manuscript. Ethics of human subject participation: The study was conducted according to the guidelines laid down in the Declaration of Helsinki and all procedures involving human subjects were approved by the University of Wisconsin ethics committee. Verbal informed consent was obtained from all subjects. Verbal consent was witnessed and formally recorded.
Supplementary material
To view supplementary material for this article, please visit http://dx.doi.org/10.1017/S1368980017000350


