


Since 2010, there is evidence that many European nations have experienced a marked rise in household food insecurity( Reference Loopstra, Reeves and Stuckler 1 ), broadly defined as insecure or insufficient access to the quality or quantity of food to meet needs( Reference Anderson 2 ). Over 2010 to 2013, the EU measure of food deprivation, namely self-reported inability to afford a meal containing protein-rich food every other day, increased by an average of 2·7 percentage points, corresponding to an additional 13·5 million people( Reference Loopstra, Reeves and Stuckler 1 ). In the UK, Greece and other nations, queues for emergency food assistance – commonly seen in the Great Depression of the 1920s – have become commonplace( Reference Smith 3 , 4 ).
There is clear evidence that food insecurity harms health, both in the short and long term. Food insecurity is correlated with inadequate dietary intakes, nutrient deficiency and other diet-related chronic conditions( Reference Rose and Oliveira 5 , Reference Seligman, Laraia and Kushel 6 ). Insecure and insufficient access to food can also lead to psychological distress and depression( Reference Vozoris and Tarasuk 7 – Reference Heflin, Siefert and Williams 10 ).
It is unclear what has caused the rise in food insecurity across Europe( 4 , Reference Taylor-Robinson, Rougeaux and Harrison 11 – Reference García 13 ). It does not appear to be a data artifact, as there was little change in the process used to collect data on EU food deprivation during this period( Reference Arora, Karanikolos and Clair 14 ). This rise is also a departure from the historical trend which, prior to 2009, had been declining( Reference Loopstra, Reeves and Stuckler 1 ). Economic shocks, such as rising unemployment and stagnating wages, appear to have contributed to the reported rise in food deprivation but explain only part of the increase( Reference Loopstra, Reeves and McKee 15 ).
One possible explanatory factor is the rising cost of food, which increased dramatically following the food price shock in 2007( 4 , Reference Gentleman 16 ). In Europe, for example, food prices rose by approximately 13 % between 2005 and 2008, while other goods and services remained relatively flat( 17 ). Since then (and until recently) food prices have continued to rise rapidly in many European countries. In the UK, for example, food prices rose by 32 % between 2007 and 2012( 18 ), corresponding to an 8·5 % decline in real household expenditure on food( Reference Griffith, O’Connell and Smith 19 ). Similarly, rising food prices in the USA are correlated with greater food insecurity( Reference Gregory and Coleman-Jensen 20 ). Notwithstanding these preliminary analyses, there is little evidence linking food prices and food insecurity in the EU.
Essential for understanding potential effects of rising food prices, however, is examining how prices have changed relative to trends in annual wages. Recent trends are particularly worrying because between 2009 and 2013, wages stagnated in most European nations( 21 ). As a result, recent rises in food prices have outstripped wage gains by as much as 1·7-fold in some countries. Together, rising food prices coupled with stagnating wages have potentially placed an additional burden on household budgets, leaving people to make difficult decisions regarding how they spend (in real terms) a smaller pot. We hypothesise that this growing disconnect between food prices and wages is a critical population driver of household food insecurity in Europe and that this would particularly be the case for low-income households, for whom food spending takes up a relatively larger proportion of disposable income compared with households with higher earnings( Reference Griffith, O’Connell and Smith 19 ).
Counteracting these processes, the generosity of social security may help buffer people from the consequences of rising prices and stagnating wages; and this may explain why reported inability to afford protein-rich foods has not risen everywhere across the EU( Reference Loopstra, Reeves and Stuckler 1 , Reference Loopstra, Reeves and McKee 15 , Reference Davis and Geiger 22 ). The food price–wage disconnect may have a lesser impact on the ability of households to feed themselves in countries where social security systems are well developed (e.g. able to respond quickly to rising need) and generous (e.g. increasing disposable incomes to a greater extent)( Reference Scruggs and Allan 23 , Reference Beckfield, Bambra and Eikemo 24 ). We hypothesise, therefore, that welfare regime types, which measure the generosity and extensiveness of social security, may alter the association between the food price–wage disconnect and reported food deprivation. For example, for a given rise in food prices over and above wages, countries with Social Democratic or Corporatist welfare regimes – the most generous and extensive welfare regimes – may have experienced smaller rises in food deprivation than the Mediterranean, Eastern European or even Liberal welfare regimes, where less generous social security systems are in place( Reference Abdul Karim, Eikemo and Bambra 25 ).
Here, using data from twenty-one EU countries between 2004 and 2012, we test the following two main hypotheses: (i) the rising disconnect in the cost and affordability of food is associated with recent rises in food deprivation, particularly among low-income households; and (ii) welfare regime type moderates the impact of this food price–wage disconnect on food deprivation.
Data and methods
Source of data
Our data come from two organisations that provide harmonised economic and social data across countries, namely the Organisation for Economic Co-operation and Development (OECD) and EuroStat. The former collects primarily economic and policy data from advanced economies; we extracted data on average annual wages from this database( 26 ). EuroStat is the statistical office of the European Union, responsible for processing and reporting on data collected from EU Member States and ensuring they are collected using harmonised methodology. Its database includes measures of material deprivation, which are collected in the EU Survey of Income and Living Conditions by Member States (EU-SILC)( Reference Arora, Karanikolos and Clair 14 ) and used to monitor poverty across the EU. One component is an indicator of food deprivation, which is the national estimate of the proportion of households reporting the inability to afford meat, chicken or fish (or a vegetarian equivalent) every second day, an amount generally recommended in food-based dietary guidelines across European countries( Reference Carney and Maitre 27 ). This measure captures qualitative compromises in food intake due to constrained financial resources, providing an indication of one dimension of household food insecurity( Reference Radimer, Olson and Campbell 28 ), although it has never been directly compared with household food insecurity scales used in other countries (e.g. the US Department of Agriculture’s Household Food Security Module). It has been found to correlate with other indicators of poverty and food hardship in Ireland, however( Reference Carney and Maitre 27 ). EuroStat also collects information on food prices, providing measures of inflation year on year, and other macroeconomic measures, including gross domestic product (GDP) and unemployment rates( 17 ).
Linking data from OECD and EuroStat databases, our data set covers twenty-one countries, including Austria, Belgium, Czech Republic, Denmark, Estonia, Finland, France, Germany, Greece, Hungary, Italy, Ireland, Luxembourg, the Netherlands, Poland, Portugal, Slovak Republic, Slovenia, Spain, Sweden and the UK, from 2004 to 2012, the latest available year for data on wages.
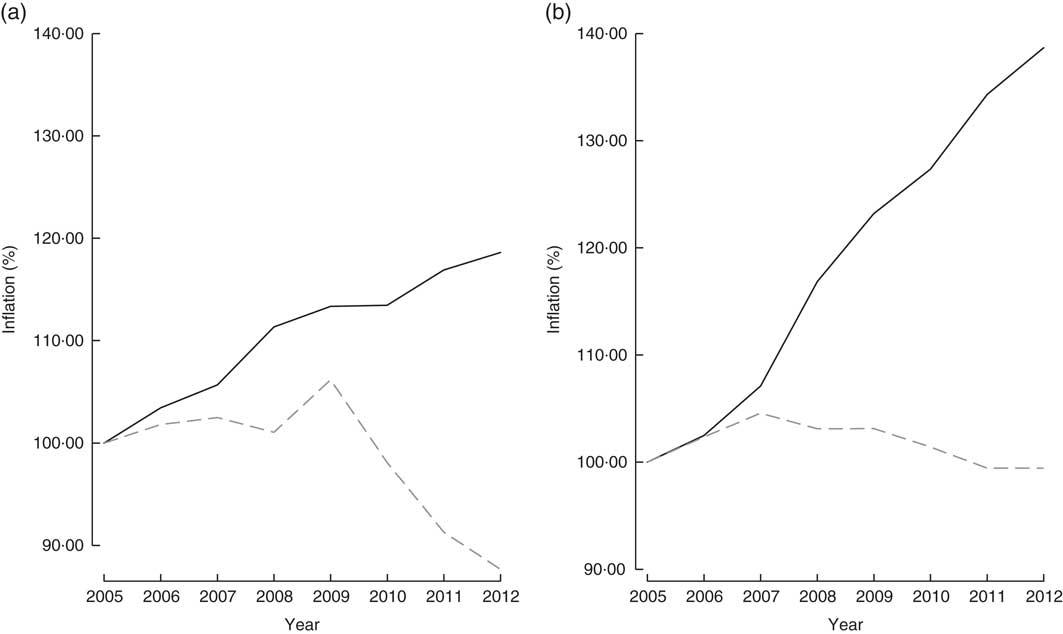
To measure the disconnect between wages and the cost of food, we constructed a new variable measuring the difference between food price inflation and wage inflation (based on earned incomes) as the percentage change in consumer prices for food minus the percentage change in wages. To illustrate this measure we use data from Greece and the UK (see Fig. 1). Food prices have risen twice as fast in the UK as in Greece; in fact, food prices fell in Greece in 2009. Yet, this slight fall in food prices likely did not ease the financial pressure faced by households because wages also fell. Thus, despite the divergent patterns in both countries, the difference between food inflation and wage inflation widened through this period.
Statistical models
To adjust for potential confounding factors, we used cross-national multivariate regression models, based on ‘first differences’ (annual changes), as follows:
 $$\eqalignno { \Delta FoodDep_{{ij}} \,{\equals}\,&\beta _{1} Disconnect_{{ij}} {\plus}\beta _{2} \Delta GDP_{{ij}} \cr & {\plus}\beta _{3} \Delta Unemployment_{{ij}} {\plus}\beta _{4} \Delta Year_{j} {\plus}{\epsilon}_{{ij}} {\rm .}$$
Here i is country, j is year and Δ captures annual change. This adjusts for country-specific differences that are relatively constant over time. As outlined, FoodDep is the prevalence of reported inability to afford a meal with a protein source every second day. Disconnect is the aforementioned measure of food price inflation net of wage inflation. GDP is a measure of gross domestic product per capita, adjusted for purchasing power and inflation; Unemployment is the unemployment rate; Year is the average change in food deprivation across countries and over time (which is effectively the constant in a first-difference model)( Reference Wooldridge 29 ); and ϵ is the error term. Both GDP and Unemployment capture the direct effect of the recession on rising food deprivation.
As rising food prices disproportionately affect households with smaller incomes( 18 ), we then stratified the analysis to compare associations among those in poverty (i.e. household income is below 60 % of the median income) and those not in poverty (i.e. household income is above 60 % of the median income).
In subsequent models we tested whether welfare regime type moderated the relationship between food deprivation and the food price–wage disconnect using a series of interaction terms with indicators of welfare regime type. Following Bambra and Eikomo, we defined welfare regimes according to commonly used definitions, which rank countries according to the generosity of their social protection programmes( Reference Eikemo and Bambra 30 , Reference Bambra and Eikemo 31 ). In our sample, the Social Democratic countries are Denmark, Finland and Sweden; the Corporatist (or Bismarckian) welfare regimes are Austria, Belgium, France, Germany, Luxembourg and the Netherlands; the Liberal (or Anglo-Saxon) welfare regimes are Ireland and the UK; the Mediterranean welfare regimes are Greece, Italy, Portugal and Spain; and the Eastern European welfare regimes are Czech Republic, Estonia, Hungary, Poland, Slovakia and Slovenia( Reference Reeves, McKee and Basu 32 – Reference Callan, Leventi and Levy 35 ).
Standard errors were clustered by country to reflect non-independence of sampling. All models were estimated in the statistical software package Stata version 13.
Results
Impact of the growing disconnect between food prices and wages
Table 1 reports the results of our cross-national models of food price–wage disconnect and food deprivation. As shown in Table 1 and Fig. 2, there was a positive, strong association. Each 1 % rise in food price inflation above wage inflation corresponded to an increase in food deprivation by 0·060 percentage points (95 % CI 0·024, 0·095). To take one specific example, food prices rose by 5·9 % over and above wages in the UK from 2009 to 2010. Our models suggest this corresponded to an increase in food deprivation of 0·353 percentage points (95 % CI 0·144, 0·563). This is about one-third of the overall rise in this period of 1·1 percentage points.
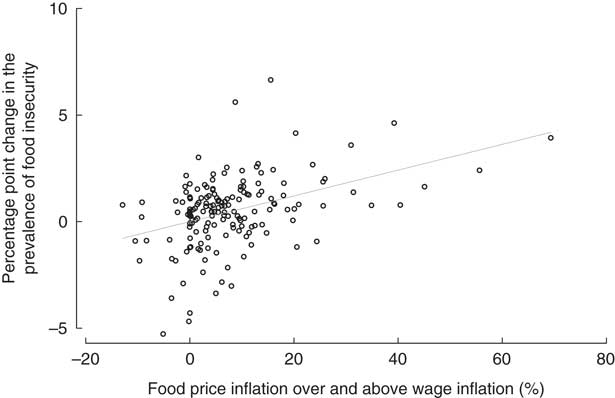
Fig. 2 Association between the food price–wage disconnect and change in food deprivation, twenty-one EU countries, 2004–2012. When the ‘Food price inflation over and above wage inflation’ variable is greater than zero, then the rise in food prices was greater than the rise in real wages. When the ‘Food price inflation over and above wage inflation’ variable is less than zero, then food price inflation was lower than the rise in real wages. Countries included were Austria, Belgium, Czech Republic, Denmark, Estonia, Finland, France, Germany, Greece, Hungary, Italy, Ireland, Luxembourg, the Netherlands, Poland, Portugal, Slovak Republic, Slovenia, Spain, Sweden and the UK. Model adjusted for annual changes in unemployment and gross domestic product, and includes average annual change in food deprivation over time; β=0·06, P<0·001. (Data from EuroStat( 17 ) and Organisation for Economic Co-operation and Development( 26 ) databases)
Table 1 Food deprivation and the food price–wage disconnect in twenty-one EU countries, 2004–2012. (Data from EuroStat( 17 ) and Organisation for Economic Co-operation and Development( 26 ) databases)
GDP, gross domestic product.
Constant (which in a difference model estimates the average annual change in food deprivation) is estimated but not shown. se are calculated to account for repeated observations within the same country. Countries included were Austria, Belgium, Czech Republic, Denmark, Estonia, Finland, France, Germany, Greece, Hungary, Italy, Ireland, Luxembourg, the Netherlands, Poland, Portugal, Slovak Republic, Slovenia, Spain, Sweden and the UK.
*P<0·05, **P<0·01.
We found this association was consistent, even after adjusting for falling GDP and rising unemployment, which had the anticipated associations, corresponding with worse food deprivation (β GDP=0·029, 95 % CI 0·001, 0·058; β Unemployment=0·383, 95 % CI 0·144, 0·621)( Reference Wooldridge 36 ).
To put the magnitude of these associations into perspective, each additional $US 100 per capita of GDP corresponded to a 0·029 % drop in food deprivation. Thus, to offset a 1 % rise in food prices, each person would need an additional $US 200 per year.
Next, we decomposed the explained variance into the component parts of the model using the Shapley method( Reference Huettner and Sunder 37 ). Most of the explained variance, approximately 54 %, was attributable to the disconnect between food prices and wages; the remaining 45 % was associated with changes in GDP and unemployment, and other time trends (see online supplementary material, Supplemental Table 1). A large portion of unexplained variance still remains.
As highlighted, we hypothesised the growing gap between food prices and wages would be most closely associated with rising food deprivation among the poorest groups. We tested this by stratifying households into those above and below the poverty line (i.e. incomes above and below 60 % of the median income). For every 1 % rise in food price inflation above wage inflation, food deprivation rose by 0·127 percentage points among people in poverty (95 % CI 0·081, 0·172; see Table 2) but by only 0·044 percentage points (95 % CI 0·023, 0·065) among people above the poverty line (test of effect heterogeneity: χ 2=14·02, P=0·001).
Table 2 Food deprivation, poverty and the food price–wage disconnect in twenty-one EU countries, 2004–2012. (Data from EuroStat( 17 ) and Organisation for Economic Co-operation and Development( 26 ) databases)
GDP, gross domestic product.
Constant (which in a difference model estimates the average annual change in food deprivation) is estimated but not shown. se are calculated to account for repeated observations within the same country. Countries included were Austria, Belgium, Czech Republic, Denmark, Estonia, Finland, France, Germany, Greece, Hungary, Italy, Ireland, Luxembourg, the Netherlands, Poland, Portugal, Slovak Republic, Slovenia, Spain, Sweden and the UK. Poverty line is defined as 60 % of median household income.
*P<0·05, **P<0·01.
Testing the role of welfare regimes
As noted, not all countries experiencing an increase in food prices also had rising food deprivation. For example, in Estonia, when the gap between prices and wages declined, food deprivation went down and when the gap increased, food deprivation rose (Fig. 3). However, Germany is quite different (Fig. 3). Food prices were rising at an accelerated rate above wages in almost every year across this period, and yet the prevalence of food deprivation steadily declined. The trends in Germany and Estonia suggest the food price–wage disconnect does not explain fluctuations in food deprivation alone, but that other factors also influence the affordability of food. Importantly, these two countries have quite different welfare regimes, with Germany an exemplar of the Corporatist welfare regime and Estonia an exemplar of the Eastern European welfare regime, suggesting welfare regime type may help buffer people against rising costs of food and stagnating wages. Thus, next we tested how different social welfare systems moderated the association between food deprivation and the food price–wage disconnect.
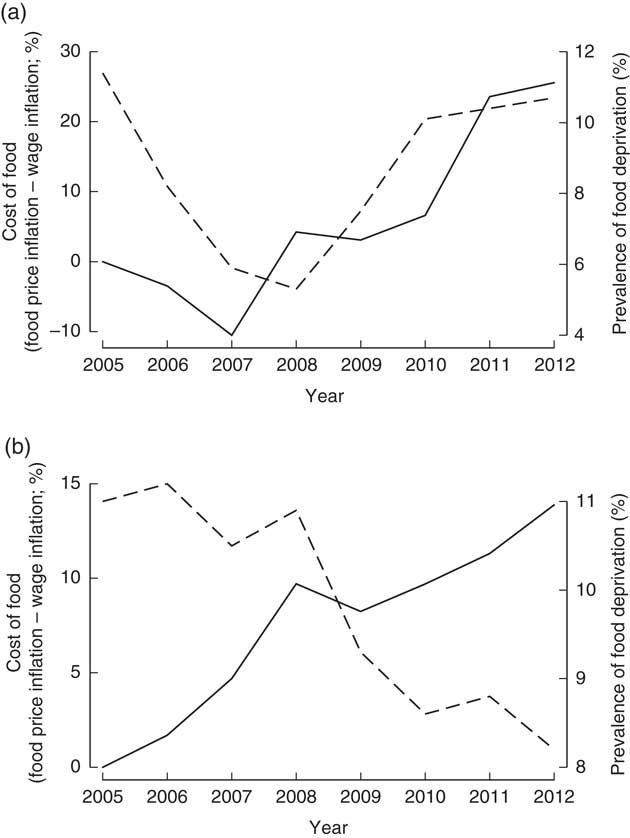
Figure 4 shows the results of the model comparing each welfare regime (see online supplementary material, Supplemental Table 2, for full model). We found marked differences in the magnitude of the association. The greatest was observed in Mediterranean welfare regimes, where each 1 % rise in the price of food over wages corresponded to rise in food deprivation by 0·120 percentage points (95 % CI 0·027, 0·213). Similar patterns were observed for the Eastern European and Liberal welfare regimes, albeit to a lesser degree. However, in Social Democratic regimes, this association disappeared (β=−0·003, 95 % CI −0·033, 0·028).
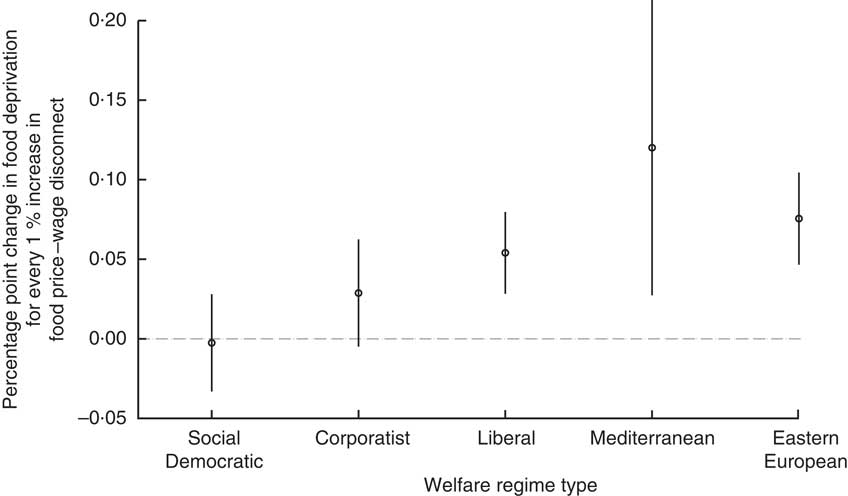
Fig. 4 Association between the food price–wage disconnect and food deprivation across welfare regimes, twenty-one EU countries, 2004–2012. Countries included were Denmark, Finland and Sweden (Social Democratic welfare regimes); Austria, Belgium, France, Germany, Luxembourg and the Netherlands (Corporatist); Ireland and the UK (Liberal); Greece, Italy, Portugal and Spain (Mediterranean); and Czech Republic, Estonia, Hungary, Poland, Slovakia and Slovenia (Eastern European welfare regimes). Results are based on model 3 in Table 1. The only difference is that an indicator of welfare regime type is included in the model and an interaction term is created between this indicator and the food price–wage disconnect measure. This model is reported in the online supplementary material, Supplemental Table 2. Hollow circles are the point estimates from the model; vertical bars represent 95% confidence intervals. (Data from EuroStat( 17 ) and Organisation for Economic Co-operation and Development( 26 ) databases)
Austerity and the rise in food deprivation
Following the Great Recession, some countries, particularly those in the Liberal, Mediterranean and Eastern Europe welfare regimes, implemented welfare reforms in an effort to reduce government spending. This may explain why these welfare regimes witnessed rising food deprivation when food prices were increasing faster than wages. To test this possibility, we added a measure of austerity to our model. Here, we define austerity countries as those governments that reduced government expenditure in any two years between 2008 and 2012. Using this definition, austerity countries include Estonia, Greece, Hungary, Ireland, Italy, Luxembourg, the Netherlands, Portugal, Spain and the UK; we confirmed this designation, where possible, using policy documents and other commentaries( Reference Reeves, McKee and Basu 32 – Reference Callan, Leventi and Levy 35 ). All other European OECD countries are the non-austerity nations. Even after controlling for this measure of austerity, we found that our results were largely unchanged albeit slightly attenuated (see online supplementary material, Supplemental Table 3). The association between the food price–wage disconnect and food deprivation remained greater in the Liberal, Mediterranean and Eastern European welfare regimes than in the Social Democratic welfare regime. Food deprivation also appeared to have risen faster in austerity countries than the non-austerity countries (β=0·636, 95 % CI −0·006, 1·293), suggesting that austerity may have had an independent effect on food deprivation over and above the effect of the food price–wage disconnect.
Robustness tests
We performed a series of tests to ensure our results were not driven by model specification or our sample. First, we decomposed our measure of the disconnect between food prices and wages, estimating whether both were independently correlated with rising food deprivation; and found that both were associated (see online supplementary material, Supplemental Table 4). Second, housing and energy prices were rising at the same time as food prices in many European countries and so we tested whether the disconnect between (i) the cost of housing and wages and (ii) energy prices and wages confounded the association between food prices, wages and food deprivation. After controlling for these measures, we observed that the food prices–wages disconnect remained correlated with rising food deprivation (see Supplemental Table 5).
Third, the disconnect between food prices and wages may also translate into a rise in the share of household budgets dedicated to food on average across the population. Here we replaced our measure of food deprivation with this alternative measure of food consumption, finding that the disconnect between food prices and wages was also associated with a greater share of household income spent on food (see online supplementary material, Supplemental Table 6). Importantly, this association likely understates the rise in the share of income spent on food among the poorest households( 18 ). Fourth, change in the level of relative poverty in the population (defined as 60 % of the median income) may also change the relationship between food price shocks, wages and food deprivation. We therefore added this variable to models, finding that increased relative poverty was associated with more food deprivation but that this did not remove the observed association between the food price–wages disconnect and inadequate access to food (see Supplemental Table 7).
We also excluded outliers from our models, measured as those observations with a standardised residual greater than 2 or less than −2. Our results were largely unchanged (see online supplementary material, Supplemental Table 8). Next, we tested the possibility of geospatial confounding, arising from the fact that the food price shock hit many countries simultaneously. We included time dummies in our model, finding that the association between the food price–wage disconnect was attenuated slightly but remained strongly linked to food deprivation (see Supplemental Table 9).
Discussion
Our statistical models demonstrate that the growing disconnect between rising food prices and stagnating wages is a significant determinant of food deprivation in Europe. Moreover, we find that this growing gap between prices and wages has hit the poorest hardest. However, where European welfare regimes are more generous or stronger, specifically the Social Democrat and Corporatist regimes, the association was mitigated( Reference Eikemo and Bambra 30 , Reference Bambra and Eikemo 31 ). In contrast, in Eastern European, the Mediterranean and the Liberal (or Anglo-Saxon) welfare regimes, there were strong associations of rising food prices over and above wages with food deprivation.
This rise in food prices has not been driven by any single item of the food basket. Between 2005 and 2012, the price of foods and non-alcoholic beverages increased, on average, by 24 % according to data from EuroStat. Within this category, bread and cereals rose by 29 %; meat rose by 23 %; fish and seafood increased by 23 %; dairy products rose by 23 %; oils and fats increased by 29 %; fruit rose by 23 %; vegetables increased by 26 %; and sugar and confectionery rose by 24 %. This Europe-wide increase in food prices will mask some variation across countries, but it is clear that the rise in the cost of food was not concentrated in any particular item of the food basket. Rather food price inflation represents a general rise across most food goods, placing additional pressures on household budgets and forcing households to make difficult choices about what to buy.
As with all cross-national studies, the current analysis has several limitations. First, our comparative measure of food deprivation, albeit commonly employed and standardised across nations, is imperfect and likely to understate the extent of households’ inability to afford sufficient and adequate food. Although this measure of food deprivation may capture qualitative compromises in food intake arising from resource constraint, it does not capture detailed data on dietary quality and is only a crude marker of insufficient protein intake. Moreover, it does not capture other dimensions of household food insecurity, which include reduced food intake, anxiety about food running out and individuals going without food( Reference Radimer, Olson and Campbell 28 ). Finally, it fails to adequately specify a time period, thereby likely missing households that may have experienced food hardships in the past 12 months but who are not, at the time of measurement, unable to afford food( Reference Iceland and Bauman 38 ). Food insecurity can be transient, and this indicator likely overlooks episodes of recent – but not current – food insecurity. Taken together, this Europe-wide measure of food insecurity has the advantage of being harmonised across countries and over time but it likely understates the true level of food insecurity, suggesting our results are conservative estimates of the association between food deprivation and the disconnect between food prices and wages.
To fully capture the burden of household food insecurity in populations, it should be measured using a multi-item scale and capture households experiencing instances of food insecurity in the past year, such as that used in the USA and Canada( Reference Tarasuk, Mitchell and Dachner 39 ). Future research is needed to develop better EU surveillance to monitor and track the scale of household food insecurity in Europe. Towards this aim, the FAO recently funded the inclusion of an eight-item household food insecurity module on the Gallup World Poll in 2014 and 2015( Reference Cafiero, Nord and Viviani 40 ). These data have provided an indication that rates of food insecurity varied from 4 to 20 % across Europe in 2014. Yet they were based on a telephone survey of only 1000 individuals per country, and there is an urgent need for countries to take up standardised monitoring on their own large-scale surveys( Reference Taylor and Loopstra 41 ).
Another limitation is that aggregate data create the possibility of ecological fallacy. However, our models had a high degree of both consistency across different measures and specificity regarding the groups likely to be affected. For example, we observed that the food price–wage disconnect was most closely associated with rising food deprivation among people in poverty, whose wages have stagnated and whose household budgets are disproportionally affected by rising food prices( Reference Iceland and Bauman 38 ). Our findings are also consistent with other data from studies at the individual level which have shown an impact of rising food prices on households’ level of food insecurity( Reference Zhang, Jones and Ruhm 42 ).
We also note that although welfare regime types have been relatively stable historically, austerity measures and social security reforms following the Great Recessions may have undermined some of the generosity of particular regimes. Since most of these reforms were implemented during or after 2012, it is unlikely that they have confounded our results; indeed, we found that even after controlling for austerity, our results were robust( Reference Loopstra, Reeves and Taylor-Robinson 43 ).
We were also unable to test the role of other potential mediating factors, such as charitable food provisioning and school-based food programmes. To our knowledge these data are not available across countries and over time. Where some data do exist they are also incomplete, focusing on large national food charity networks which will underestimate the prevalence of such services. More work is needed to understand how these alternative food responses may moderate the effect of the disconnect between food prices and wages on household food insecurity.
Our studies point to several directions for future research. One is developing better monitoring and understanding of the food price–wage disconnect. Future research is needed to identify those policies which can combat hunger, potentially through interventions that make food more affordable or increase wages. For example, indexing benefit support to the cost of living may be an important way to protect households from food price increases. Similarly, Living Wage commitments could ensure that wages rise in tandem with living costs. Further, introducing a basic income may eliminate (or at least radically reduce) food insecurity for those both inside and outside the formal labour market as long as it is indexed to the cost of living( Reference McIntyre, Dutton and Kwok 44 , Reference Atkinson 45 ). There is a body of research exploring policy interventions in relation to household food insecurity in North America( Reference McIntyre, Dutton and Kwok 44 , Reference Loopstra, Dachner and Tarasuk 46 – Reference Arteaga, Heflin and Gable 48 ) but, to our knowledge, little has been done in this regard in Europe. Similarly, while studies have explored what impact charitable food assistance has on household food insecurity in North America( Reference Loopstra and Tarasuk 49 ), given the recent rapid expansion of food charity in the EU( Reference Loopstra, Reeves and McKee 15 , Reference Loopstra, Reeves and Taylor-Robinson 43 ), there is an urgent need to understand the effectiveness of charitable food interventions on food insecurity in this context.
Second, as highlighted, more needs to be done to understand the extent to which households are unable to afford adequate and sufficient food in Europe using validated measures of household food insecurity and in detailed national household surveys, and in turn the consequences of this problem for health and nutritional status.
These findings also have important policy implications. They show that, especially during periods of economic hardship, it is important to place priority on the food security of vulnerable groups. This can be compounded, or alleviated, by social security systems, such as a basic income, as well as by external forces outside the control of policy makers( Reference Hacker and Pierson 50 ). Several events suggest imminent change, for better and for worse. One is that there are signs of a slow return to economic growth in Europe which, if it leads to modest increases in real wages, could mitigate rising household food insecurity. At the same time, a secular decline in oil prices has contributed to falling food prices, reducing the food price–wage disconnect. Yet these positive trends may be counteracted by deep austerity measures in Europe, as governments continue to scale back social protection systems. What is clear is that the inability of households to afford basic foods in Europe indicates a massive problem for countries where social security is weak, especially in the face of food price shocks.
Acknowledgements
Financial support: A.R., R.L. and D.S. are funded by a Wellcome Trust Investigator Award. The Wellcome Trust had no role in the design, analysis or writing of this article. Conflict of interest: The authors declare that they have no conflicts of interest. Authorship: A.R. and R.L. designed the research questions, collected the data, conducted the analysis and wrote the first draft of the paper. D.S. contributed to the interpretation of the results and helped write the final paper. Ethics of human subject participation: Not applicable.
Supplementary materials
To view supplementary material for this article, please visit http://dx.doi.org/10.1017/S1368980017000167


