Nearly one in eight US households experiences food insecurity( Reference Coleman-Jensen, Rabbitt and Gregory 1 ), defined as lacking the resources to reliably access adequate food (in terms of quantity or quality)( Reference Coleman-Jensen, Gregory and Rabbitt 2 ). People with disabilities are 2·8 times more likely to experience food insecurity than people without disabilities( Reference Coleman-Jensen and Nord 3 ), and the health of people with disabilities is especially sensitive to food insecurity given their reduced baseline health status and their elevated risk for having an underlying health condition exacerbated( Reference Coleman-Jensen and Nord 4 ). The Supplemental Nutrition Assistance Program (SNAP; formerly the Food Stamp Program) is the largest food assistance programme in the USA. Prior studies have found that food insecurity rises before initial SNAP uptake( Reference Nord and Golla 5 ) and falls after receipt( Reference Nord and Golla 5 – Reference Ratcliffe, McKernan and Zhang 8 ). However, less is known about the relationship between food insecurity and Supplemental Security Income (SSI), a federal cash assistance programme benefiting individuals who have severe work-limiting disabilities and highly limited economic resources. Given the disproportionate impact of food insecurity on people with disabilities( Reference Coleman-Jensen and Nord 4 ) and the fact that SSI benefits – although not specifically tethered to food-related purchases – may be used to alleviate hunger, we hypothesized that food insecurity might fluctuate before and after initial SSI receipt as it does in relation to SNAP.
Methods
We utilized data from the 2008 panel of the nationally representative Survey of Income and Program Participation (SIPP)( 9 ). The 2008 panel was administered to approximately 42 000 US households over sixteen waves occurring every four months. Core questions about income, public benefits and other topics were asked every wave. Additional questions were covered during selected waves (e.g. assets: wave 7; food insecurity: waves 6 and 9; disability: wave 6). We generated two analytic samples from these data: one sample to assess food insecurity at two time points just prior to entry into the SSI programme (‘pre-entry analysis’) and one sample to assess food insecurity at time points both before and after entry (‘pre–post analysis’).
Pre-entry analysis
To examine pre-SSI patterns in food insecurity, we identified 209 individuals who started receiving SSI in the year after the wave 9 measurement of food insecurity (i.e. in wave 10, 11 or 12). For this treatment group, the wave 6 measurement of food insecurity occurred 1–2 years before SSI entry and the wave 9 measurement occurred less than 1 year before entry (Table 1). Controls included 4454 eligible non-recipients: they did not receive SSI during the study period but met categorical requirements (here, as previously( Reference Gettens, Lei and Henry 10 ), this meant reporting disability or age greater than 65 years based on data collected in wave 6) and income/asset requirements (for these, we relied on methods described by Davies et al.( Reference Davies, Huynh and Newcomb 11 ) utilizing variables in waves 6 and 7 of the SIPP).
Table 1 Identification of treatment groups for the pre-entry and pre–post analytic samples

SSI, Supplemental Security Income.
Pre–post analysis
To examine potential effects of initial SSI entry on food insecurity, we identified seventy-seven individuals who started receiving SSI in the year between the wave 6 and wave 9 measurements of food insecurity (i.e. in wave 7 or 8). For the treatment group, the wave 6 measurement of food insecurity occurred less than 1 year before SSI entry and the wave 9 measurement occurred less than 1 year after entry (Table 1). Controls included 3856 eligible non-recipients identified as in the pre-entry analysis described above. The waves utilized for the pre-entry and pre–post analyses differed slightly, however, causing the difference in sample sizes of the control groups.
Samples for both the pre-entry and pre–post analyses were limited to adults (18 years or over). To preserve sample size, we did not limit the sample to individuals present in all sixteen waves; rather, we only required that an individual be present in the waves required for the identification strategies identified above. Sensitivity analyses using data from all waves to assess trends pre- and post-SSI entry did not yield substantively different findings. Separately, sensitivity analyses using long-term SSI recipients as controls did not produce substantively different results either.
Measures
The SIPP measured food insecurity with a validated five-item screener( Reference Nord 12 ) that can categorize households as having food insecurity or not; this measure has previously been used to estimate the effects of SNAP benefits on food insecurity( Reference Gundersen, Kreider and Pepper 13 ). We counted individuals living in a household with food insecurity as having experienced food insecurity. A binary ‘post’ term indicated whether a measure of food insecurity was from wave 9 (v. wave 6) and a binary treatment variable indicated whether a person was in the treatment group (v. control). Additional covariates included binary measures of race/ethnicity (non-Hispanic White or not), gender, education (high-school diploma/equivalent or not) and marital status (married and living with spouse or not). Sensitivity analyses including further adjustment for concurrent enrolment in SNAP and other public benefit programmes did not alter findings.
Statistical approach
For both sets of analyses, we estimated logistic regression models with difference-in-differences estimators to compare changes in food insecurity between treatment and control groups, adjusting for all covariates. The coefficient on a post × treatment interaction was the term of interest in each model. The SIPP provides weights and we utilized these in the calculation of all point estimates and statistical models.
Results
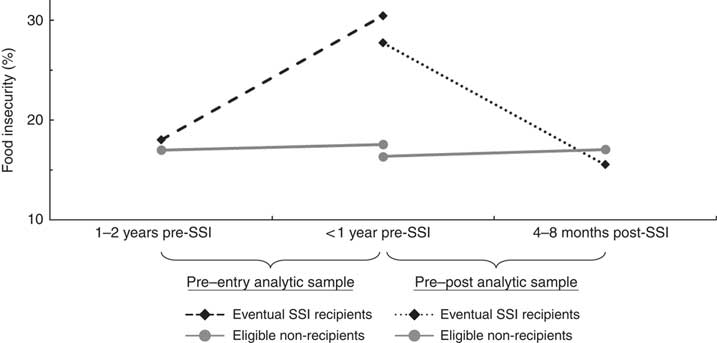
Figure 1 summarizes findings for both the pre-entry and pre–post analyses. In the pre-entry analysis, the percentage of individuals experiencing food insecurity rose from 18 (95 % CI 13, 24) % at 16–24 months before SSI entry to 30 (95 % CI 24, 38) % just before SSI entry, compared with a change from 17 (95 % CI 16, 18) % to 18 (95 % CI 16, 19) % among eligible non-recipient controls over the same period. In the pre–post analysis, the percentage of individuals experiencing food insecurity fell from 28 (95 % CI 18, 41) % just before SSI entry to 16 (95 % CI 8, 27) % after SSI entry, compared with a change from 16 (95 % CI 15, 18) % to 17 (95 % CI 15, 19) % among controls.
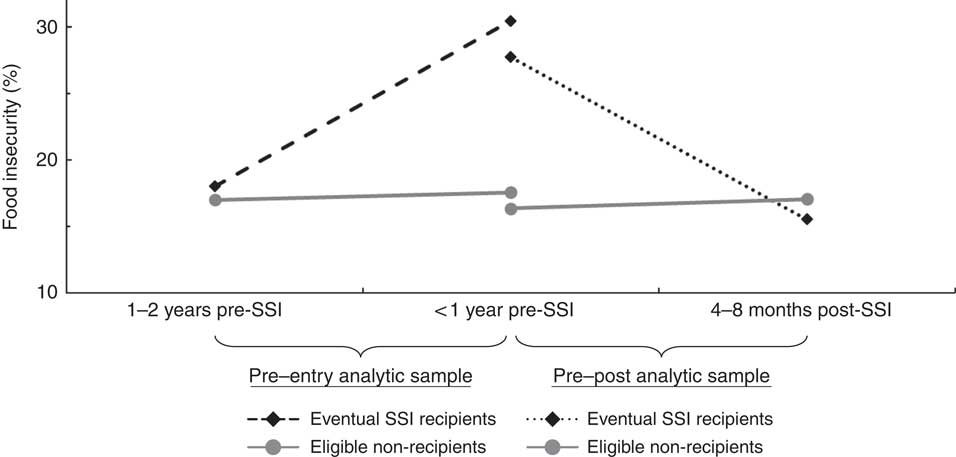
Fig. 1 Graphical representation of observed food insecurity patterns among treatment and control groups immediately before and after the treatment groups’ initial Supplemental Security Income receipt; non-institutionalized US adults aged≥18 years, 2008 panel of the Survey of Income and Program Participation
The difference-in-difference estimator was significant in the weighted logistic regression model for the pre-entry analysis (P=0·01), adjusting for covariates, indicating food insecurity increased just prior to SSI entry among eventual SSI recipients above and beyond secular changes among controls (Table 2). In the pre–post analysis, the difference-in-difference estimator was marginally significant (P=0·07), providing modest evidence for a decline in food insecurity after SSI receipt (Table 2).
Table 2 Logistic regression models including difference-in-difference estimators assessing patterns of food insecurity before and after initial receipt of Supplemental Security Income (SSI) benefits among non-institutionalized US adults aged ≥18 years, 2008 panel of the Survey of Income and Program Participation

(*) P<0·10, *P<0·05, ***P<0·001.
† Model included 209 eventual SSI recipients and 4454 eligible non-recipients.
‡ Model included seventy-seven eventual SSI recipients and 3856 eligible non-recipients.
§ The reference group was eligible non-recipients. In the pre-entry model, the food insecurity of eventual SSI recipients was measured 1–2 years before programme entry and then <1 year before programme entry. In the pre–post model, the food insecurity of eventual SSI recipients was measured <1 year before programme entry and then <1 year after programme entry.
║ Dummy variable indicating the time of the second measurement of food insecurity. The first measurement occurred around June 2010, the second occurred 1 year later around June 2011.
¶ This difference-in-difference estimator represents the difference between eventual recipients and eligible non-recipients in how the log-odds of food insecurity changed between the two measurements of food insecurity. This compares the change in log-odds of experiencing food insecurity of eventual SSI recipients with that of eligible non-recipients.
Discussion
We have found evidence that food insecurity rises before initial SSI receipt and falls afterwards, similar to patterns observed in relation to SNAP( Reference Nord and Golla 5 – Reference Ratcliffe, McKernan and Zhang 8 ). Family, health and employment shocks typically drive the rise in food insecurity seen before SNAP application and receipt( Reference Leete and Bania 14 ), indicating relatively direct lines between crisis, need and benefits-seeking. Such processes likely occur among eventual SSI recipients as well. However, SSI applications can take 6 months to several years to process, whereas SNAP applications are usually processed more quickly. The longer wait between applying for and receiving SSI benefits suggests the pre-SSI increase in food insecurity may also stem from economic vulnerabilities escalating over time as applicants await benefits. Investigations with longitudinal data may be needed to more fully examine potential mechanisms underlying the increase in food insecurity observed here.
Self-reporting in the SIPP was a limitation, particularly given stigma around SSI, disability and food insecurity, although these stigmas would likely not have affected our comparison groups differentially over time. However, the SIPP has previously been used to examine the relationship between SNAP receipt and food insecurity( Reference Gundersen, Kreider and Pepper 13 ), and it has been used by the US Census Bureau to produce national estimates for the prevalence of disability in the USA( Reference Taylor 15 ). Separately, small sample sizes were also a key limitation, particularly affecting statistical power in the pre–post analysis.
The SSI programme serves over 8 million individuals( 16 ). These recipients are socially vulnerable and have elevated health-care needs( Reference Riley and Rupp 17 ). As food insecurity is particularly problematic for this population( Reference Coleman-Jensen and Nord 4 ), a sharp rise in food insecurity at any time may drive negative health and health-care outcomes. Many states have interim benefit programmes for individuals awaiting SSI decisions( 18 ). Expansions of these programmes may reduce economic hardships and improve outcomes for this population. Additionally, although food insecurity fell after SSI receipt, it was not eliminated. Thus, future research should examine whether increasing SSI benefit levels (as has been suggested for SNAP( Reference Gundersen, Kreider and Pepper 19 )) and fostering greater coordination between the SSI and SNAP programmes may also be warranted by these findings, particularly given past findings that SNAP also partially reduces food insecurity( Reference Nord and Golla 5 – Reference Ratcliffe, McKernan and Zhang 8 ).
Acknowledgements
Financial support: This work was supported by a Social Security Administration Disability Determination Process Small Grant Program grant and a Heller Annual Fund grant. The funders had no role in the design, analysis or writing of this article. Conflict of interest: None. Authorship: R.A.S. led the formulation of the research questions, the study design, the analysis and the writing. S.L.P. and M.M. provided feedback and contributed to the formulation of the research questions, the study design and the writing. Ethics of human subject participation: Not applicable; because the study utilized de-identified secondary data, the Brandeis University Institutional Review Board deemed it exempt from ethical review under exemption 4.