


Food safety is a public health issue. It is estimated that each year in the UK, food-borne illness affects about a million people. About 20 000 people receive hospital treatment, there are about 500 deaths and the total cost of food-borne illness to the UK economy is nearly £1·9 billion. All of these food-borne diseases are gastrointestinal (GI) diseases or have GI symptoms( 1 ). In April 2013, public health functions moved back to local authorities from the National Health Service (NHS) in England. This means that more joined-up work around food hygiene and other nutritional issues such as fat, salt and sugar content in foods should be possible as food safety, environmental health and public health practitioners will all be working for one organisation.
Since 2010, local authorities in the UK have supplied data to the UK Food Standards Agency (FSA) about food hygiene ratings for premises selling or providing food in their areas. These data are based on visits from local authority food safety officers which typically happen on a rolling basis on a schedule of between every six months and three years. Included in the FSA data are type of premises, score (out of 5, although some local authorities use only pass or fail) and postcode for the premises. The scores indicate the level of food hygiene where 0 indicates that urgent improvement is required, while 5 indicates that hygiene standards are very good. These scores are based on whether premises meet FSA guidelines with regard to the four ‘C's, (Cleaning, Cooking, [Avoiding] Cross-contamination and Chilling), have a food safety management system and keep a cleaning diary. Premises which score badly for food hygiene will be revisited more often by food safety officers and can be shut down if they do not improve. Premises are encouraged to display their rating, but this is currently on a voluntary basis. The FSA is carrying out research around the effect of displayed food hygiene ratings on consumer choices( Reference Husain and Vowden 2 ). The FSA has carried out research on whether consumers use the ratings in choosing where to eat, and found that use is limited( 3 ). In Denmark it is believed that mandatory reporting of food hygiene scores contributed to driving up standards( Reference Spear 4 ). In Los Angeles the publication of hygiene scores was linked to a 20 % drop in food-borne illness-related visits to local hospitals( Reference Jin and Leslie 5 ).
In the present paper, these FSA data have been analysed to determine whether there was a statistical relationship between type of premises, local deprivation and food hygiene. The Index of Multiple Deprivation( Reference McLennan, Barnes and Noble 6 ) (IMD) 2010 scores used are based mainly on administrative data about the population in a small area. This index is a summary measure based on scores across thirty-eight indicators organised across seven domains (Income Deprivation; Employment Deprivation; Health Deprivation and Disability; Education Skills and Training Deprivation; Barriers to Housing and Services; Living Environment Deprivation; Crime). This analysis is working on the assumption that premises are related to the populations who live in the same area, which may not be the case; for example, premises in town centres or employment hubs may not have a localised clientele. However, deprived and affluent areas tend to be clustered so premises in deprived areas are likely to be used by individuals from adjacent deprived areas.
It was hypothesised that premises in the most deprived areas may have lower food hygiene scores on average than those in less deprived areas. The reasons why it was thought this may be the case are that people in deprived areas may make decisions based more on price than food hygiene ratings; whereas in more affluent areas people would be more likely to consider food hygiene ratings, which would be an incentive for businesses to get a better hygiene rating. It may also be that businesses in more deprived areas find it more difficult to recruit and retain well-trained staff, who are more likely to be aware of food hygiene standards and procedures( Reference Rowley and Purcell 7 ). Businesses in more deprived areas may also be more likely to use cheaper ingredients from the supply chain. Taking the dairy industry as an example, businesses who are competing more on price may be more likely to use imported eggs which are more likely to have salmonella( Reference Little, Walsh and Hucklesby 8 ) and this increased risk from the supply chain will either be amplified or ameliorated by local hygiene practices on site, which vary( Reference Clayton, Griffith and Price 9 ).
Food hygiene regulations have been in place in the UK since 2006 which state that all food businesses must follow hazard analysis and critical control points (HACCP) principles. Barriers to implementation of HACCP in small premises are said to include expense, lack of expertise and lack of a legal mandate( Reference Egan, Raats and Grubb 10 ). In the UK there is variation in whether or not suppliers follow HACCP procedures; a survey of dairy producers in 1999 found that there was a lot of variation in how long they had been implementing HACCP( Reference Henson, Holt and Northen 11 ). This is why local authorities and the FSA need to work together in regulating both the food supply chain and local storage and preparation practices.
Data have also been analysed to see if there was any correlation between average food hygiene ratings at a local authority level and rates of laboratory-reported GI diseases, outbreaks of which are often caused by food poisoning due to bad food hygiene practice and are often associated with food from catering premises. A study found that 64 % of outbreaks of campylobacteriosis in England and Wales were associated with catering premises, and most commonly with poultry products( Reference Frost, Gillespie and O'Brien 12 ). A study found that 97 % of food-borne illnesses that were linked with catering premises were associated with poor food handling( Reference Howes, McEwen and Griffiths 13 ). Rates of infectious intestinal diseases in England have been monitored in two studies, one looking at 1993–96( Reference Wheeler, Sethi and Cowden 14 ) and one looking at 2008–09( Reference Tam, O'Brien and Tompkins 15 ). The more recent of these found that rates of infectious intestinal diseases were higher in 2008–09 than 1993–96, but that fewer people were visiting their general practitioner or other health-care services due to an episode of this type of illness.
Experimental methods
Records were extracted for 369 885 premises that had food hygiene ratings from the FSA food hygiene ratings website (http://ratings.food.gov.uk/), as of 28 September 2012. These files were extracted as thirteen XML files, each with about 30 000 records, which were combined and put into the statistical software package IBM SPSS Statistics 20.
Figure 1 shows a data process flow diagram. First, premises that did not have a numerical rating value were excluded (n 58 369; they were mainly in Scotland where there is a pass/fail system), leaving 311 516 premises. Then fifty-eight duplicate premises were taken out, based on their codes, leaving 311 458. These premises were all analysed by type of premises and by local authority to see if there were significant differences in average scores between types of premises and between local authorities.
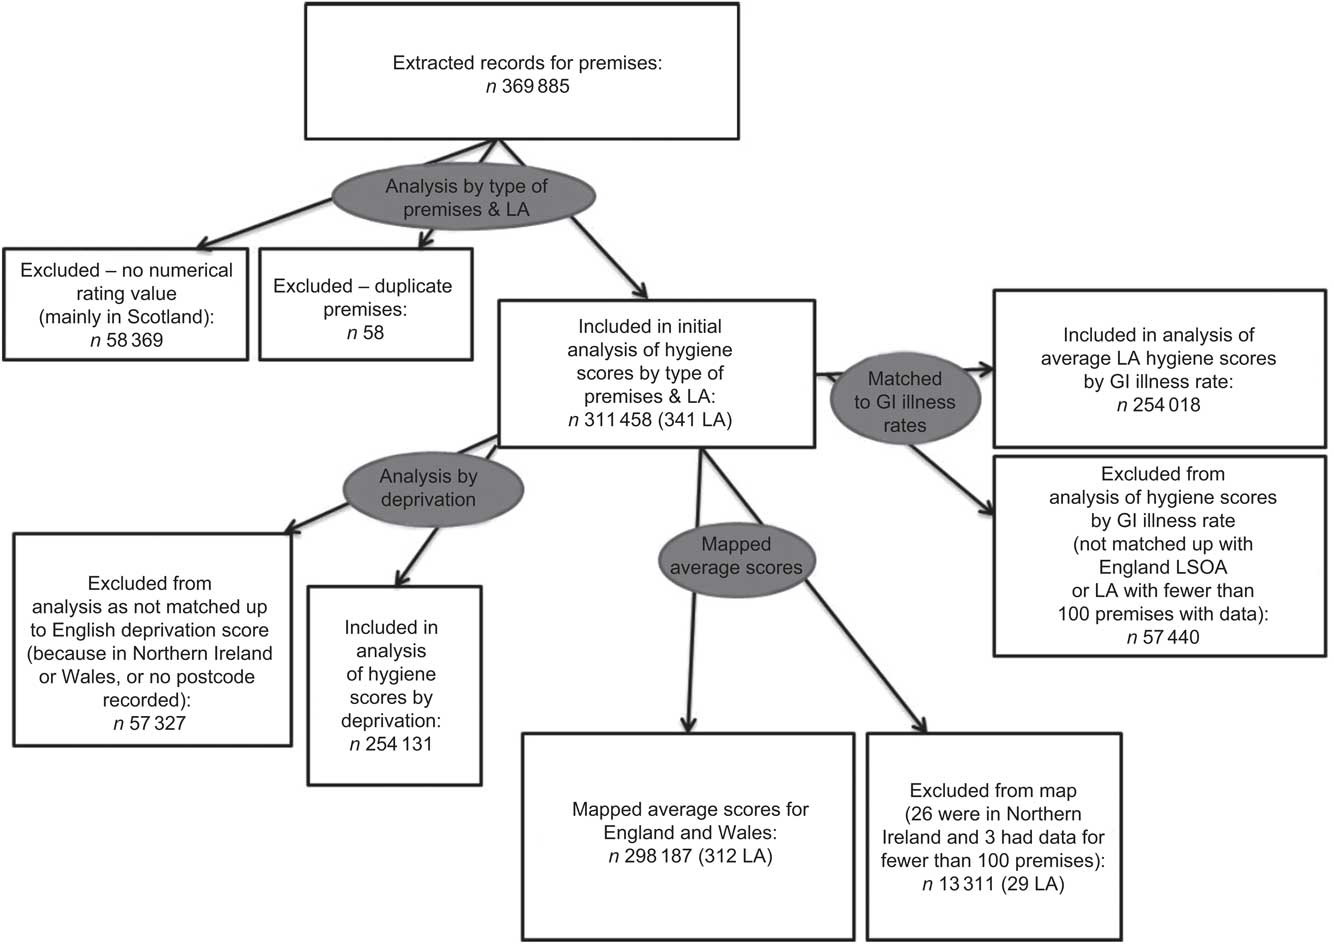
Fig. 1 Data process flow diagram (LA, local authority; GI, gastrointestinal; LSOA, lower layer super output area)
Of these 311 458 premises, 254 131 were matched up to England lower layer super output areas (LSOA; a small-area geography, each with an average population of 1500 persons, used by the UK Office for National Statistics) using the NHS Gridlink postcode file. The 57 440 premises that were excluded had postcodes that did not match up to English LSOA. These were mostly in Wales and Northern Ireland, or had incomplete postcodes. There were five English local authorities (Hull City, St Helens, Southend-On-Sea, Preston and North East Derbyshire) that had no postcodes recorded for premises in the data and so could be included in the analysis by local authority but not the analysis by deprivation. Excluding these five local authorities and the Wales and Northern Ireland premises, in total 254 018 out of 274 207 (93 % of the remaining premises) were matched to English LSOA and to their respective IMD 2010 scores( Reference McLennan, Barnes and Noble 6 ).
The FSA food hygiene score data for local authorities in England were compared with data from the Health Protection Agency on the number of laboratory-confirmed cases of GI disease per 100 000 population, by local authority, in 2011. GI diseases are caused by a variety of organisms and are acquired by coming into contact with contaminated food, water or surfaces. In England the most common bacterial infection is campylobacteriosis, while Escherichia coli infection, though relatively rare, poses the most severe risk to the population( 16 ). Data are collected by the Health Protection Agency on laboratory-confirmed rates of adenovirus, astrovirus, Bacillus spp., botulism, calicivirus, Campylobacter spp., Clostridium perfringens, Cryptosporidium spp., E. coli O157, Giardia lamblia, Helicobacter spp., Listeria monocytogenes, norovirus, rotavirus, Salmonella spp., Shigella spp. and Yersinia spp. These data exclude any cases that were most likely contracted in other countries( 17 ). These data were matched for all local authorities where there were 100 or more premises that had numerical scores for food hygiene as it was decided that local authorities with data for fewer than 100 premises may have too large a confidence interval or may skew any correlation calculation. In total 133 local authority areas were matched between average food hygiene rating and GI disease rates. The food hygiene ratings for England and Wales were also mapped using Mapinfo version 10, using Ordnance Survey ‘Meridian’ mapping files.
Results
Table 1 shows the average scores out of 5 by type of premises in England, Wales and Northern Ireland. The highest average scores were for schools/colleges (n 21 940) while the lowest average scores were for takeaways (n 36 708). Using 98 % CI, four types of premises were significantly worse in terms of hygiene score than the average for all premises; these were pub/club (n 40 525), restaurant/café/canteen (n 73 052), small retailer (n 42 932) and takeaway (n 36 708).
Table 1 Mean hygiene score by type of premises in England, Wales and Northern Ireland, 2011
Figure 2 shows the average food hygiene score by local authority in England and Wales; there are 312 areas shown. Bexley had the lowest average score (2·99), while North Devon had the highest (4·77). Using 99 % CI, for England, Wales and Northern Ireland, 102 local authorities were significantly worse than the national average, 152 were significantly better and eighty-seven were not significantly different from the national average. In England and Wales only, 101 local authorities were significantly worse than the national average, 138 were significantly better and seventy-three were not significantly different from the national average. This is shown in the map in Fig. 3. The reason why 99 % CI were used was because with 341 observations one would expect some significant results by chance. The local authority areas that are left blank on the maps in Figs 2 and 3 are cases where there were fewer than 100 premises with hygiene scores in the local authority, or where no food hygiene data were available at all so no average score could be calculated.
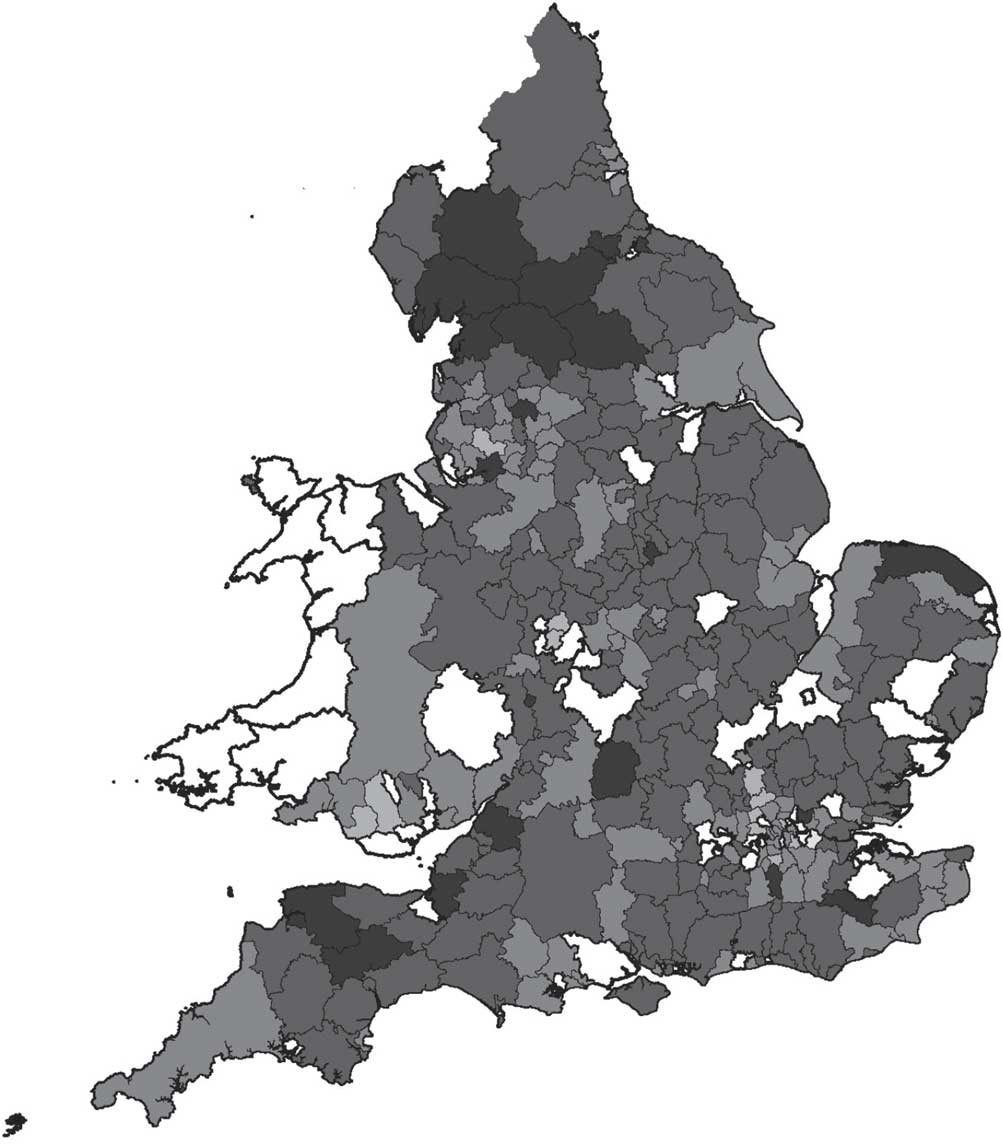
Fig. 2 Average hygiene score (![]() , 4·5–5·0;
, 4·5–5·0; ![]() , 4·0–4·5;
, 4·0–4·5; ![]() , 3·5–4·0;
, 3·5–4·0; ![]() , 3·0–3·5;
, 3·0–3·5;
![]() , 2·5–3·0) by local authority, England and Wales, 2011
, 2·5–3·0) by local authority, England and Wales, 2011
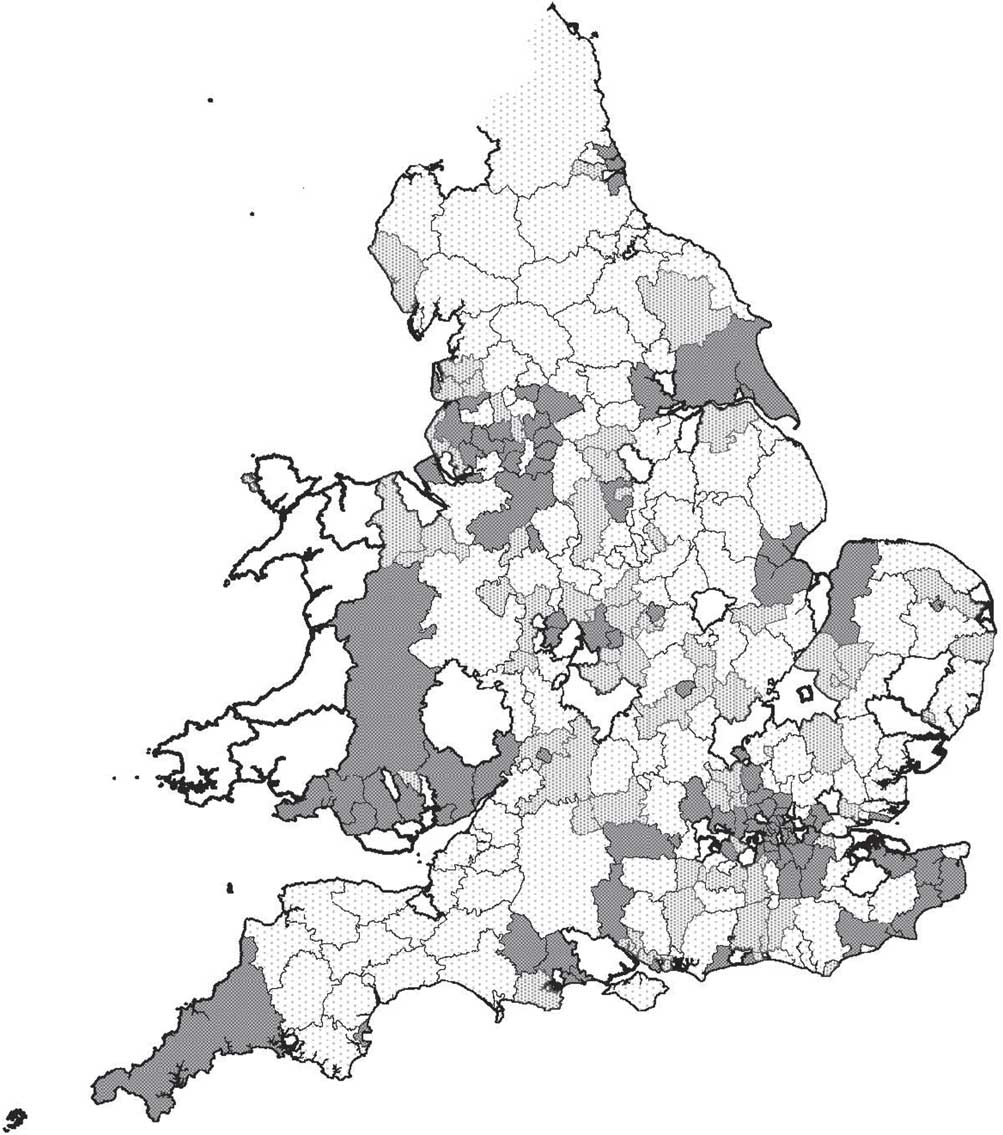
Fig. 3 Average hygiene score by local authority – difference from the national average based on 99 % confidence interval (![]() , significantly better than average;
, significantly better than average; ![]() , not significantly different;
, not significantly different; ![]() , significantly worse than average), England and Wales, 2011
, significantly worse than average), England and Wales, 2011
Figure 4 shows the average IMD 2010 score for each hygiene rating in England. There was a significant difference in average deprivation scores, with the highest hygiene rating (5) having a lower average deprivation score than the lowest hygiene rating (0). This shows that there is a socio-economic gradient with the lowest hygiene ratings being more concentrated in the most deprived areas. When put into a linear model, this difference in deprivation was explained mainly by the type of premises, with types of premises with lower average hygiene ratings like takeaways more likely to be situated in deprived areas than premises with higher average hygiene ratings like restaurants and caterers. So the gradient in food hygiene scores by deprivation is explained mainly by the type of premises, not by deprivation on its own. A predictive model was constructed using automatic linear modelling in IBM SPSS Statistics 20, with rating value as the effect and IMD 2010 score and business type as predictors. In this model both variables were statistically significant but business type made up 97 % and IMD score 3 % of the model, which in itself only accounted for 8 % of the variance in actual scores.
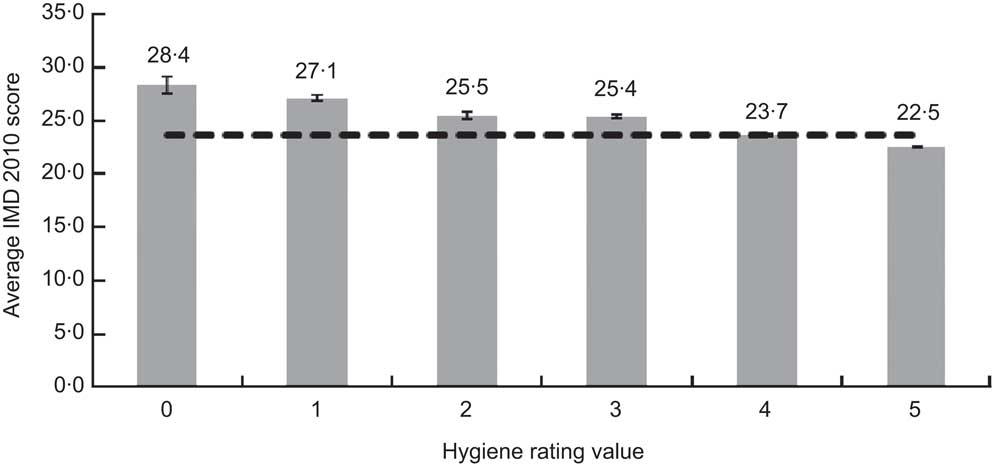
Fig. 4 Average Index of Multiple Deprivation (IMD) 2010 score by hygiene rating value for all food and catering premises in England, 2011. Values are means, with their 95 % confidence interval represented by vertical bars; ![]() indicates the average IMD 2010 score across all hygiene rating values
indicates the average IMD 2010 score across all hygiene rating values
A correlation was carried out between average food hygiene rating from the FSA and rate of laboratory-detected GI illness in 2011 by local authority from the Health Protection Agency, for 133 local authorities in England. However no correlation was found, with r 2 = 0·01 indicating no relationship between the two variables.
Discussion
The present analysis provides evidence for types of premises that are more likely to have low hygiene ratings; these are pub/club, restaurant/café/canteen, small retailer and takeaway. These types of premises need more support and training around food hygiene practices. These types of premises may need more targeted enforcement activity by local authority environmental health teams. This information could also be useful to consumers in making them aware of what types of premises are more likely to have low food hygiene scores. The categories of premises are fairly broad, for instance restaurant/café/canteen describes a very diverse set of premises, so it may be worth the FSA and local authorities considering more specific categories.
There was a significant relationship between IMD 2010 score and FSA food hygiene score. This result was mainly because more deprived areas had more takeaways and other premises that were likely to have lower food hygiene scores. This is a relevant finding in itself, as it indicates that people in more deprived areas have more access to takeaways which typically sell energy-dense foods that promote obesity( Reference Reidpath, Burns and Garrard 18 ). A previous study looking at the density of fast-food outlets by areas of deprivation in Glasgow( Reference Macintyre, McKay and Cummins 19 ) found that this was not the case there, so finding this relationship for England is significant.
The differences in premises’ average food hygiene scores between deprivation groups were small in absolute terms. This could indicate that food premises in the most deprived areas are still making an effort to follow hygiene standards despite money being one of the barriers to meeting hygiene standards( Reference Yapp and Fairman 20 ) and premises in more deprived areas being less likely to survive more than 3 years than those in less deprived areas( Reference Yapp and Fairman 21 ), which may make them less likely to have good practice that has been embedded over several years. This outcome could also be seen as a testament to the success of enforcement activity by food safety officers. Future work could look at the changes over time in average hygiene scores for particular types of premises or by deprivation groups. It would be interesting to look at different types of premises and the food they mainly serve – some foods are inherently more risky like eggs or raw meat, whereas some types of food such as pizza, which is typically cooked at a very high temperature, may be lower risk.
The fact that there was no correlation between laboratory-confirmed cases of GI illness and average food hygiene rating does not prove that food hygiene standards are not related to food poisoning, as laboratory-reported cases are only a small number of the actual estimated number of cases in the community, and the differences in rates may reflect local practice in testing and reporting. The effect of people's level of immunity to bacteria is not totally understood; some people who are exposed to outbreaks will get ill, others who are equally exposed will not( Reference Lund and O'Brien 22 ). If people in deprived areas are exposed more often to small amounts of bacteria, it may be that they get higher levels of immunity over time; but as people from deprived areas are likely to have poorer health status overall, they might have lower immunity. It is known that young children are more at risk of GI diseases and that as individuals get older resistance to Listeria and other food-borne pathogens decreases, so areas with an older population or with more young children may be expected to have higher rates of food-borne disease( Reference Kirk, Veitch and Hall 23 ). It may be that people from more affluent areas eat more of some more expensive foods which are also higher risk, such as raw oysters which have been a common cause of food-borne norovirus outbreaks in England, or chicken liver pâté made with undercooked (pink) livers which have been a common cause of Campylobacter outbreaks( 16 ). Also, about 50 % of food poisoning cases come from the home rather than from retail premises. Future work could look at food-borne illness rates at a lower geographical level which may be more sensitive in picking up the links between food hygiene and GI illnesses.
Conclusion
The present paper has taken a ‘big data’ approach to combining administrative data to answer a question about food hygiene and deprivation. It has demonstrated that lower food hygiene rating scores in the UK are associated with certain broad categories of premises, namely pub/club, restaurant/café/canteen, small retailer and takeaway. It has also shown that, in England, there is a modest but statistically significant relationship between food hygiene score and deprivation score, which is mainly explained by having more of these types of premises in deprived areas. These types of premises should be targeted for training, support and enforcement to improve food hygiene and reduce the risk of GI disease outbreaks associated with poor food hygiene.
Acknowledgements
This paper uses data from the UK Food Standards Agency, the Health Protection Agency, the Office for National Statistics and the Ordnance Survey. Sources of funding: The author's post is funded by NHS Wirral. The funders had no role in the design, analysis or writing of this article. Conflicts of interest: None. Ethical approval: Ethical approval was not sought as this paper uses routine administrative data that are in the public domain.


