


The recent transformations of lifestyles and food patterns have led to a rapid increase of childhood obesity in emerging countries. In Mexico for instance, a nationally representative survey counted almost one-third of overweight children and adolescents in 2012, of whom half suffer from obesity (ENSANUT survey). It is widely acknowledged that childhood obesity can affect several dimensions of human capital accumulation, mainly health and educational aspects. While the epidemiological literature shows that childhood excess weight is related to many health comorbidities (e.g. breathing difficulties, sleeping apnoea and other physical complications), the economic literature assumes that childhood obesity may negatively affect educational outcomes(Reference Currie1).
Despite the few studies implemented in China and Thailand(Reference Mo-suwan, Lebel and Puetpaiboon2–Reference Lu, Chou and Lin4), most of the empirical literature focuses on rich countries. Their results generally show that the adverse effects of childhood overweight and obesity on school performance are particularly strong for girls(Reference Mo-suwan, Lebel and Puetpaiboon2–Reference Lu, Chou and Lin4,Reference Sabia6,Reference Kaestner and Grossman7) . This gender-specific pattern has a sociological explanation. Indeed, body-based social pressure is stronger for girls than for boys in rich countries(Reference Averett and Korenman8,Reference Goryakin, Lobstein and James9) . Furthermore, the existing literature suggests the presence of heterogeneous effects according to the child’s age(Reference Cohen, Rai and Rehkopf10). While the results of studies focusing on early childhood (cohorts 5–8 years old) are mixed and sometimes contradictory(Reference Cawley and Spiess11–Reference Zavodny14), authors who focused on preadolescent and adolescent cohorts systematically report significant and negative effects of childhood obesity on schooling outcomes, independently of the study context. We found significant obesity-based educational penalties for adolescents in the USA(Reference Han3,Reference Sabia6,Reference Kaestner and Grossman7) , China(Reference Lu, Chou and Lin4) and Thailand(Reference Mo-suwan, Lebel and Puetpaiboon2). It is worth noting that the body weight trajectory over time is an important predictor of educational attainment. For instance, the risks of schooling failure and dropout are particularly high when obesity occurs during pre-adolescence and adolescence(Reference Datar and Sturm15,Reference Lanza and Huang16) .
To fill the literature gap, the aim of this article is to better understand how childhood excess weight affects schooling attainment in the context of developing countries, where fat-based stigma is complex and substantially different to Western countries(Reference Brewis, SturtzSreetharan and Wutich17). In this research perspective, the case of Mexico is particularly relevant and interesting for two main reasons. First, Mexico has the highest rate of childhood obesity worldwide. Hence, potential losses of aggregated human capital induced by obesity burden may significantly weaken the country’s development capacity. Second, weight-related stigma effects are assumed to be ambiguous in emerging countries where overweight is predominant such as Mexico. Indeed, anti-fat and pro-fat social norms are probably co-occurring(Reference Brewis, SturtzSreetharan and Wutich17). While anti-fat norms emerge from the adoption of Western beauty ideals, pro-fat norms originating in traditional beliefs (i.e. excess weight as an indicator of good health and strength) may persist. Further, the emergence of neo-pro-fat social norms may occur in societies where overweight has become predominant(Reference Levasseur and Ortiz-Hernández18). A relative social acceptance of childhood excess weight has already been empirically observed in the UK(Reference Classen19), in the USA(Reference Sabia6) and Mexico(Reference Prina and Royer20), three countries characterised by alarming rates of overweight and obesity. Note that weight-based schooling penalties are expected to be particularly high in Mexico. Indeed, the Mexican school system promotes collective performance instead of individual performance. Most of the works and tests are done in a group setting(Reference Levasseur and Ortiz-Hernández18). Thus, if childhood obesity is stigmatised in Mexican schools, social exclusion by peers is likely to directly affect schooling performance.
The rest of the article is organised as follows. In the section ‘Conceptual framework in the context of emerging countries’, we present the main pathways explaining how childhood excess weight may affect educational attainment in the context of emerging countries. In sections ‘Materials and methods’ and ‘Results’, we describe the methodology and the results of the study, respectively. In the section ‘Discussion’, we discuss the findings and finally conclude.
Conceptual framework in the context of emerging countries
Productivity and stigma effects
The potential difference in the relationship between body weight and schooling between rich countries and developing economies relies on theoretical foundations. In line with the literature, we consider two transmission channels to explain the effect of childhood obesity on educational outcomes: a weight-related productivity effect and a weight-related stigma effect (Reference Levasseur and Ortiz-Hernández18).
Indisputably, a negative weight-related productivity effect occurs due to the presence of overweight-related comorbidities. Indeed, the overweight and obesity statuses are associated with poor physical abilities and chronic fatigue syndromes (e.g. sleeping apnoea and inefficient brain oxygenation) that limit the child’s attendance and concentration at school(Reference Black, Johnston and Peeters21). In other words, an overweight-related productivity loss occurs through two mechanisms called absenteeism (at school) and presenteeism (i.e. a loss of productivity during the schooling day). Since overweight-related comorbidities belong to the medical field, the productivity effect is assumed to be universally negative, even in developing countries.
By contrast, the weight-related stigma effect is much more ambiguous since this pathway belongs to the social field. The concept of stigmatisation is defined as a process of social discrimination (e.g. bullying and mockery) and (self-) exclusion that affects an individual (or a group) considered by the majority as abnormal(Reference Goffman22). Regarding weight-based stigma, abnormal individuals might be those with far from normal body weight distribution (i.e. the thinnest and the fattest individuals of a given population or subpopulation). Interestingly, weight stigma and perception change across regions, time and economic development(Reference Poulain5). Indeed, anthropological studies show a positive correlation between national income and fat stigma(Reference Marini, Sriram and Schnabel23). This means that weight stigma is assumed to be higher in rich countries than in developing countries. Thus, by assuming that the weight-related productivity effect is fixed and always negative, the negative impact of childhood obesity on schooling is probably lower in developing economies than in rich countries.
A co-occurrence of pro-fat and anti-fat social norms
Weight-based stigma is ambiguous in developing countries. While anti-fat norms emerge from the adoption of Western beauty ideals, pro-fat norms originating in traditional beliefs may persist(Reference Brewis, SturtzSreetharan and Wutich17). Further, the recent spread of overweight and obesity might decrease the social rejection of excess weight in society (i.e. neo-pro-fat social norms). This new trend supposes that the obesity stigma has decreased with the increase in overweight and obesity rates. This hypothesis is consistent with recent findings in psychology(Reference Robinson and Christiansen24).
In facts, the empirical literature observed a growing social acceptance of moderate excess weight in countries where overweight and obesity are predominant. For instance, in the USA, obesity-induced schooling penalties were higher for past generations of students than for current generations(Reference Classen19). Again in the USA, there is no difference in schooling performance between normal-weight and overweight schoolchildren, whereas there was a significant gap between normal-weight and obese schoolchildren(Reference Sabia6). In Mexico, the reference point for a perceived appropriate children weight rises when local obesity rates increase (at the classroom level)(Reference Prina and Royer20). Thus, excess weight is progressively stopping being a rare phenomenon and a source of social stigmatisation.
The social acceptance of moderate excess weight may make the relationship between weight and school attainment non-linear. One can assume that overweight status is not particularly stigmatised in school, contrary to slightness and obesity status (i.e. a U-inverted shape). Such non-linearities have already been observed in the Mexican labour market, where salaried workers with overweight earn significantly more than normal-weight and obese counterparts(Reference Levasseur25). Therefore, it seems appropriate to explore how the severity and distribution of fatness influence the relationship between weight and educational outcomes in Mexico.
Finally, we assume that gender, living area and economic backgrounds strongly influence the weight–education relationship, given an important heterogeneity regarding the diffusion of pro-fat and anti-fat social norms in the Mexican society. First, in accordance with the literature, we expect that the weight-based educational penalties are particularly strong for girls because of a higher pressure for female thinness than male thinness(Reference Mancilla-Díaz, López-Aguilar and Franco-Paredes26). Second, we assume a higher diffusion of anti-fat social norms in cities compared with rural areas. Besides well-known social and economic divergences(Reference Gong, Soest and Villagomez27), weight and beauty perceptions fundamentally differ between rural and urban areas in emerging countries such as Mexico(Reference Clément, Levasseur and Seetahul28). While overweight status remains largely associated with wealth and prosperity in rural populations because of the persistence of traditional beliefs, most of cities have experienced a rapid diffusion of Western thinness ideals the last decades(Reference Brewis, SturtzSreetharan and Wutich17). Third, certain social groups are expected to be particularly sensitive to weight-based discrimination and educational penalties. One can assume that anti-fat social norms are more diffused in privileged social groups, while pro-fat social norms persist in poorer settings where budgetary and food pressures are common(Reference Levasseur25).
Materials and methods
Data and sample
Quantitative data come from the Mexican Family Life Survey (MxFLS, 2002–2012). This was the first longitudinal survey with a representative sample of the Mexican population at national, rural–urban and regional levels. Sampling directives were drawn up by the National Institute of Statistics. The survey covers a 10-year period with three distinct waves. The first wave was carried out in 2002 with 35 677 individuals surveyed in 8440 households (living in 150 municipalities distributed across sixteen Mexican states). Given the longitudinal dimension of the survey, the second (2005–2006) and the third (2009–2012) waves were based on the initial sample in 2002. In both waves, the follow-up rate of the initial sample exceeded 90 % at the household level. MxFLS data include detailed information on socio-economic characteristics of households and individuals. Anthropometric data were collected for all household members directly at their home by trained staff from the National Institute of Public Health. Waist circumference was measured exactly at navel level using a flexible tape (accuracy of 1 cm), weight with a set of digital scales (accuracy of 0·1 kg) and height with a stadiometer (accuracy of 0·5 cm).
The longitudinal dimension of the MxFLS (2002–2012) provides the opportunity to analyse how childhood body weight in 2002 correlates with schooling attainment 10 years later. More specifically, we measured schooling outcomes by the length of schooling (i.e. years of completed primary, secondary and tertiary education in 2012) and by a binary outcome indicator distinguishing individuals who obtained a high-school grade in 2012 (i.e. bachillerato) from individuals who did not obtain this grade. We detailed the structure of the Mexican education system in online Supplemental Table A1.
We restricted the sample to adolescent individuals who had between 9 and 15 years old in 2002 (i.e. attended primary or secondary school in 2002). Online Supplemental Fig. A1 illustrates the balanced distribution of the sample between age 9 and age 15. Three reasons justify the selection of this age range at baseline. First, we voluntarily excluded younger children to avoid errors in the body mass measurement. Recall that the literature showed mixed results for children under age 8(Reference Levasseur and Ortiz-Hernández18). Moreover, having only 10-year long observations, one could expect smaller variations in the length of schooling for younger students. Second, we selected the top limit at age 15 to exclude high-school students. The inclusion of high-school students might bias the representativeness of the sample because of important dropouts between middle-school and high-school in Mexico; the age for mandatory formal education being fixed at age 16. Third, a smaller age range would significantly reduce the precision of estimates given the limited number of observations.
Since the study is based on panel data separated by a 10-year period, the representativeness of the sample between the first and the latest waves could be altered. For instance, concerning education-related information collected in 2012, online Supplemental Table A2 shows that almost 80 % of the children interviewed in 2002 were re-interviewed in 2012. Nevertheless, the average length of completed education in 2012 did not differ significantly between the restricted sample (individuals surveyed in 2002) and the unrestricted sample (including new individuals who were not surveyed in 2002). Moreover, as shown in online Supplemental Fig. A2, the distribution of the length of schooling was similar in the restricted and unrestricted samples. Likewise, the distributions of individual BMI measured in 2012 were similar between restricted and unrestricted samples (online Supplemental Fig. A2).
One could assume that overweight or obese children have higher risks of panel exits because of diseases, mortality or other shocks. However, online Supplemental Fig. A3 exhibits that excess weight children in 2002 have a similar risk to disappear from the panel in 2012 as normal-weight children, considering BMI-based and waist-to-height ratio (WHtR)-based clinical classifications (i.e. all observed gaps are not statistically significant). Therefore, it can be assumed that the restricted sample is reasonably representative of members of the Mexican population who were children in 2002 and not biased by attrition.
Estimation strategy
Most authors suggest using explanatory variables predating the outcome variable in order to exclude any problem of reverse causality(Reference Han3,Reference Lu, Chou and Lin4,Reference Kaestner and Grossman7) . Consequently, we estimated how childhood body weight in 2002 influences the level of completed education 10 years later, in 2012. However, even if this procedure removes the reverse causality bias, another source of bias may persist. Indeed, such a model remains sensitive to the presence of unobservable heterogeneity due to the non-random distribution of individuals and body weight. In other words, given the non-experimental nature of the MxFLS, unobservable confounders are likely to simultaneously affect childhood obesity in 2002 and educational outcomes in 2012 and hence bias the estimates (i.e. hidden bias).
The main omitted factors are the parental involvement in the child’s health and education and the child’s socio-cognitive abilities(Reference Cawley and Spiess11). In theory, these confounders, assumed as relatively time invariant, are negatively correlated with body weight but positively correlated with academic outcomes. Hence, their omission could exaggerate the negative impact of childhood obesity on educational attainment. We also suspect the presence of unobservable time-varying heterogeneity. Indeed, the potential occurrence of shocks during the panel period might affect not only educational performance but also child nutrition, such as income shock, parental break-up and parent’s death. For instance, a drop in income during the study period could lead some children to gain/lose weight and leave school to help alleviate household expenditures. Thus, such a shock could lead us to overstate (if children gain weight) or understate (if children lose weight) the negative impact of obesity on school attainment.
To limit the presence of unobserved heterogeneity and related bias, we controlled ordinary least squares (OLS) estimates for a comprehensive set of observed characteristics available in the MxFLS (i.e. several individual and parental characteristics). In line with previous studies(Reference Han3,Reference Lu, Chou and Lin4) , we also employed a propensity score matching (PSM) estimator. Such approaches are based on the construction of a control group (i.e. untreated individuals) that does not differ from the treatment group (i.e. treated individuals), in terms of observable characteristics, excluding the treatment status(Reference Rosenbaum and Rubin29). The propensity score is the fitted probability of being treated (e.g. being overweight or obese) according to several observed characteristics. However, the potential presence of unobserved heterogeneity, simultaneously correlated with the treatment assignment and the outcome indicator, might bias PSM estimates (i.e. hidden bias). We tested the robustness of PSM estimates to potential hidden bias using a Rosenbaum bounds sensitivity analysis(Reference Rosenbaum30). This approach measures to what extent the PSM results remain robust to an increasing hidden bias. More information about PSM and Rosenbaum bounds approaches is available in the online Supplemental Appendix B.
An alternative procedure, called instrumental variables strategy, relies on the use of exogenous instruments to extract variation in the variable of interest that is unrelated to these problems and to use this variation to estimate its causal effect on an outcome indicator. However, identifying a relevant instrument is a great challenge insofar as it must satisfy two conditions: (i) being a strong predictor of the endogenous explanatory variable (i.e. childhood body weight) and (ii) not being correlated with the unexplained proportion of the outcome variance. To meet with the second requirement (i.e. exogeneity condition), the use of genetic data as instruments of body weight is preferred in the recent literature(Reference Böckerman, Cawley and Viinikainen31). However, such information is often unavailable in developing countries. Thus, given the lack of convincing instruments, we had to use more traditional methods limited by potential hidden bias.
Variables
Outcomes indicators
Two educational outcome indicators were considered. First, we analysed the years of completed education in 2012 based on the Mexican education system. Online Supplemental Table A1 shows the assigned values to the outcome indicator. This schooling attainment indicator includes primary, secondary and tertiary education. We only consider the level of education completed by an individual; thus, potential repetitions are not counted as additional years of schooling. All observations take non-negative integer values. Note that there is only a 10-year period between treatment assignment and outcome indicator. Hence, there might be small schooling variations for the younger children (e.g. children who were 9 years old in 2002 were 19 years old in 2012). This issue might lead to understate the impact of childhood excess weight on school attainment. It is why we use a second outcome indicator, identifying whether a child obtained a high-school grade (i.e. bachillerato) or not (binary variable).
Body weight indicators
Body weight indicators must be able to capture the excess weight severity, as well as fat distribution in the body. Hence, two complementary indicators are used: the BMI and the WHtR. The BMI refers to weight in kg divided by height squared in metres. Thus, BMI is a good indicator of general body weight. By contrast, the WHtR is defined by dividing waist circumference in cm by height in cm. As a consequence, the WHtR better captures fat distribution and especially abdominal fat accumulation(Reference Burkhauser and Cawley32).
The Childhood Obesity Working Group of the International Obesity Taskforce recommends adjusting childhood BMI per age and gender(Reference Cole, Bellizzi and Flegal33). From the adjusted values of BMI, we considered three nutritional statuses: (i) normal weight, (ii) overweight and (iii) obesity. Given the marginal proportion of childhood underweight in Mexican cities (see online Supplemental Table A3), this body weight category is not analysed in this study. Moreover, continuous values of BMI adjusted by age and gender (z-scores) were also analysed, using both linear and quadratic specifications.
For the WHtR, we used the universal threshold to distinguish normal from risky abdominal fat distribution(Reference Ashwell34). This threshold classifies individuals with a WHtR lower than 0·5 cm/cm as normal and individuals with a WHtR higher than 0·5 cm/cm as suffering from risky abdominal fat accumulation. When continuous values of WHtR were considered, both linear and quadratic specifications were tested.
In the model, the body weight indicators are only based on the 2002 survey wave. It is worth noting that the 2002 base potentially understates our measurement of educational penalties induced by excess weight, especially when BMI-based indicators are used. As shown in online Supplemental Table A4, more than 85 % of the sample who were overweight in 2002 were still overweight in 2012, while 57 % of the children who had normal BMI in 2002 became overweight in 2012. The 2002 base is less problematic when WHtR-based indicators are used. Around 37 % of children changed from normal WHtR to risky WHtR between 2002 and 2012.
Covariates
As is usual in the economic literature, we controlled for the main determinants of child educational attainment(Reference Lu, Chou and Lin4,Reference Kaestner and Grossman7,Reference Todd and Wolpin35–Reference Barone and O’Higgins37) . The set of observed characteristics captures the theoretical notions of the child’s physical and mental development as an accumulation process that depends on several individual and parental characteristics, including economic, sociodemographic and genetic factors.
To minimise the presence of hidden bias, all observed characteristics selected meet the following three criteria(Reference Austin, Grootendorst and Anderson38): (i) they are based on theoretical and/or empirical evidence; (ii) they are based on a pre-treatment period (i.e. from the 2002 survey) and (iii) they are potentially correlated with the treatment and the outcome (i.e. confounding factors).
First, we controlled for standard individual characteristics (age and gender) and included two fundamental predictors of the child’s physical and mental development(Reference Victora, Adair and Fall39–Reference Coneus and Spiess41): the mother’s height in cm (terciles) and the mother’s cognitive ability score (measured by Raven’s matrices). We also took the mother’s WHtR status (risky or not risky: higher than 0·5 cm/cm for risky), otherwise the father’s WHtR status when the former is missing, and the mother’s systolic blood pressure (normal or high: higher than 120 mmHg for high) into account because the parents’ health status has decisive repercussions on the child’s development. For instance, maternal high blood pressure increases the risk of low birth weight and subsequently increases the risk of abdominal fat accumulation during the life cycle(Reference Fang, Madhavan and Alderman42). Furthermore, while maternal blood pressure is inversely correlated with the child’s heart rate(Reference Schachter, Kuller and Perfetti43), a low heart rate increases the probability of adopting anti-social behaviours from preadolescence (e.g. physical assault, vandalism, drug and alcohol use), which raises the risk of school dropout(Reference Ortiz and Raine44). Moreover, the human body mechanically regulates a low heart rate by accelerating blood pressure, which is correlated with poor school performance(Reference Cottrell, Northrup and Wittberg45).
We also included widely accepted environmental factors in the set of confounders(Reference Han3,Reference Lu, Chou and Lin4,Reference Sabia6,Reference Cawley and Spiess11,Reference Averett and Stifel40,Reference Datar, Sturm and Magnabosco46,Reference Moraes, Beltrán Rosas and Mondini47) : the mother’s level of education; the number of children in the household; the monthly child-related expenditures excluding school expenditures (clothing, toys, accessories and activities) in tercile; the weekly household food expenditures for fruits and vegetables, carbon hydrates and animal-based products (meats and fats) in tercile; the annual household income in tercile; the average annual household income in the municipality; perceived neighbourhood safety and the population size of the municipality (more than 100 000 inhabitants) for urban sample only.
In addition, we selected a proxy variable to reduce the influence of potential hidden bias(Reference Todd and Wolpin35). This proxy dichotomously identifies the mother’s nutritional perception. Values from fathers are used when data are missing for mothers. This variable takes the value 1 when the mother/father perceived the quality of her diet as satisfactory (or unsatisfactory), while her/his abdominal fat level was classified as normal (or risky), and 0 otherwise. Generally, nutritional misperceptions derive from popular and traditional beliefs and lead to poor nutritional practices affecting the child’s mental and physical development(Reference Andrade, Raffaelli and Teran-Garcia48).
Baseline adjustment
To capture pre-existing heterogeneity between individuals, we introduce the baseline education level in the set of covariates. This adjustment significantly reduces the hidden bias by controlling for time-invariant heterogeneity between treated and untreated individuals(Reference Smith and Todd49). Specifically, we controlled for the years of completed education measured in 2002. In the related literature, this type of adjustment is widely used to control for time-invariant heterogeneity such as the parental involvement in children health and education, as well as for heterogeneous socio-cognitive capacities of children(Reference Lu, Chou and Lin4,Reference Kaestner and Grossman7,Reference Datar and Sturm15) . Therefore, the estimates might only remain sensitive to a hidden bias due to time-varying heterogeneity between treated and untreated individuals, such as income and family shocks across time.
Results
Summary statistics
Table 1 presents summary statistics for the main variables of interest. In 2002, the rates of overweight, obesity and risky abdominal fat concentration among 9–15-year-old adolescents were 21, 7 and 19 %, respectively. Note that these rates are higher in urban Mexico than rural settings. Moreover, male adolescents are more associated with overweight and abdominal adiposity than girls, whereas girls have higher prevalence of obesity than boys.
Table 1 Summary statistics
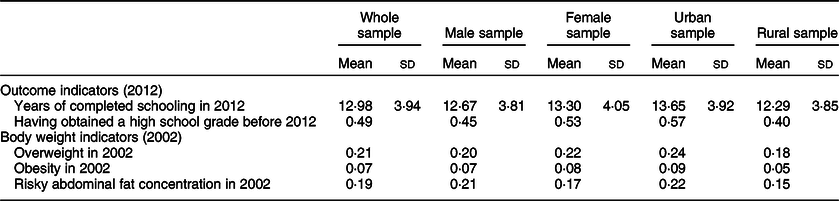
Source: Mexican Family Life Survey (2002–2012).
Table 2 intersects the BMI-based classification and the WHtR-based classification. Interestingly, 62 % of the children classified as overweight were not classified as having a risky level of abdominal fat in 2002. This means that 62 % of the Mexican adolescents were potentially classified as being overweight because of muscular overdevelopment, balanced fat distribution in the body (e.g. subcutaneous adiposity) or fat concentration apart from the abdomen (e.g. hips, buttocks and chest).
Table 2 Crossing BMI classification and waist-to-height ratio (WHtR) classification
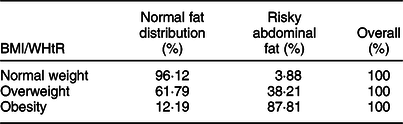
Source: Mexican Family Life Survey (2002).
Childhood body weight and school achievement
As shown in Fig. 1, the relationship between childhood body weight in 2002 and school achievement 10 years later is highly ambiguous. Indeed, this figure displays slight non-linearities: while baseline overweight is associated with the highest educational outcomes (regarding the length of schooling and the probability of obtaining a high-school grade), baseline obesity is associated with lower educational outcomes.

Fig. 1 School achievement in 2012 by BMI-based categories in 2002. Source: MxFLS (2002–2012)
Interestingly, the weight–schooling relationship is highly dependent on the household’s economic background. Indeed, Fig. 2 shows different types of association according to household income groups (i.e. terciles of annual income). Among low-income households, the relationship between BMI-based categories and the average year of completed schooling is clearly positive: children who were overweight or obese in 2002 have the highest average year of completed schooling in 2012. In contrast, the association looks negative among high-income households (i.e. baseline obesity is associated with the poorest school achievements) and non-linear among middle-income households (i.e. baseline overweight children have the highest average year of completed schooling).
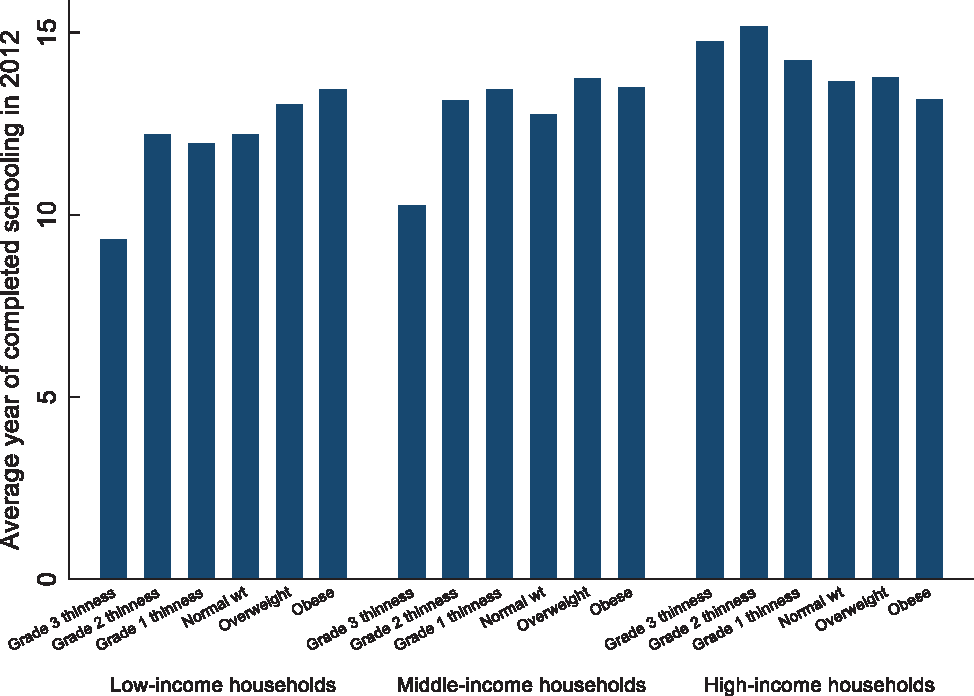
Fig. 2 Years of completed schooling in 2012 by BMI-based classification and household income groups in 2002. Source: MxFLS (2002–2012)
However, Figs 1 and 2 must be considered with caution. Indeed, several omitted factors may simultaneously affect body weight and educational outcomes, such as individual soft-skills and family characteristics. For example, it is well known that greater social advantage is generally associated with higher educational attainment(Reference Currie1). Nonetheless, the association between social backgrounds and childhood obesity potentially differs according to sociodemographic factors (e.g. gender, living area and social background). Since Figs 1 and 2 do not control for such confounding factors, the trends that they show could be biased. For instance, the negative trend observed in Fig. 2 among low-income households could result from the presence of unobserved heterogeneity in this group. One can assume that, compared with the poorest households, the richest from the poor (or the lowest poor) are more likely to provide to their children a high-energy diet (increasing childhood body weight), as well as having a higher parental ability to keep a child in education.
Apparent sources of heterogeneity in the tested relationship emphasise the importance to control for several confounding factors. Hence, we then investigate the association between childhood excess weight in 2002 and the completed education in 2012 employing OLS and PSM estimations. It will be recalled that in both procedures, we controlled for time-invariant heterogeneity by including the initial schooling levels in the set of covariates (i.e. baseline adjustment), besides other controls. Given the obvious presence of heterogeneity according to living area, we separately analysed rural and urban adolescents. For the same reason, boys and girls were also analysed in separate sub-samples and then household income-specific regressions were run.
OLS estimates
Tables 3 and 4 report the main results from OLS estimates, respectively, for both educational outcomes (i.e. the years of completed education and the probability of obtaining a high-school grade). To explore potential non-linearities in the relationship, we used three different specifications of body weight indicators: (i) a linear specification using continuous values of BMI and WHtR; (ii) a quadratic specification integrating the squares of BMI and WHtR and (iii) a multinomial specification including the clinical categories based on BMI (normal v. overweight v. obesity) and WHtR (risky v. non-risky waist). Compared with previous studies, the explicative power of the model is fairly good, especially when the years of completed education are considered as outcome. Depending on the sample, R 2 values vary from 46 to 53 %, which means that half of educational outcome’s variations are explained by variations in body weight indicators and observed characteristics (Table 3). Full tables of OLS estimates (reporting the fitted coefficients of covariates) are available in online Supplemental Tables A5a and b, for the whole sample only. For gender- and area-specific subsamples, full OLS estimates are available upon request.
Table 3 Association between childhood body weight (in 2002) and the years of completed schooling in 2012 (OLS estimates)†
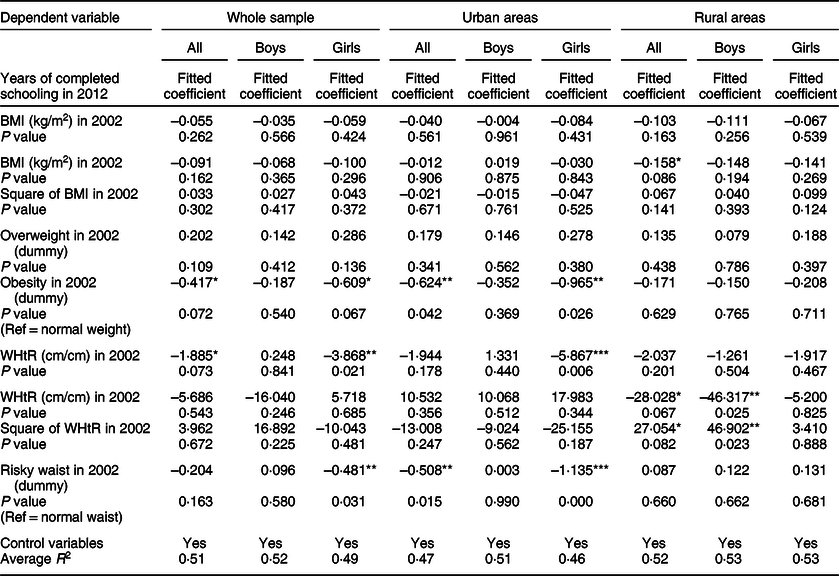
Each OLS regression is separated by a gap. For BMI and WHtR, three specifications are systematically employed: linear, quadratic and categorical. P-values are based on cluster robust standard errors (at the municipality level). Significance levels of fitted coefficients: ***P < 0·01, **P < 0·05, *P < 0·1.
† All control variables are included: age, gender, baseline education level, maternal cognitive ability score, maternal height, risky paternal WHtR, paternal blood pressure, proxy for parental nutritional knowledge, maternal education level, annual household income, number of children in the household, monthly child-related expenditures, the weekly household food expenditures for fruits and vegetables, carbohydrates, and animal-based products (meats and fats), perceived neighbourhood safety, average annual household income in the municipality concerned, and the population size of the municipality concerned (more than 100 000 inhabitants) for urban and whole samples only.
Source: Mexican Family Life Survey (2002–2012).
Table 4 Association between childhood body weight (in 2002) and the probability of having achieved high school grade (bachillerato) in 2012 (probability linear model based on OLS)†
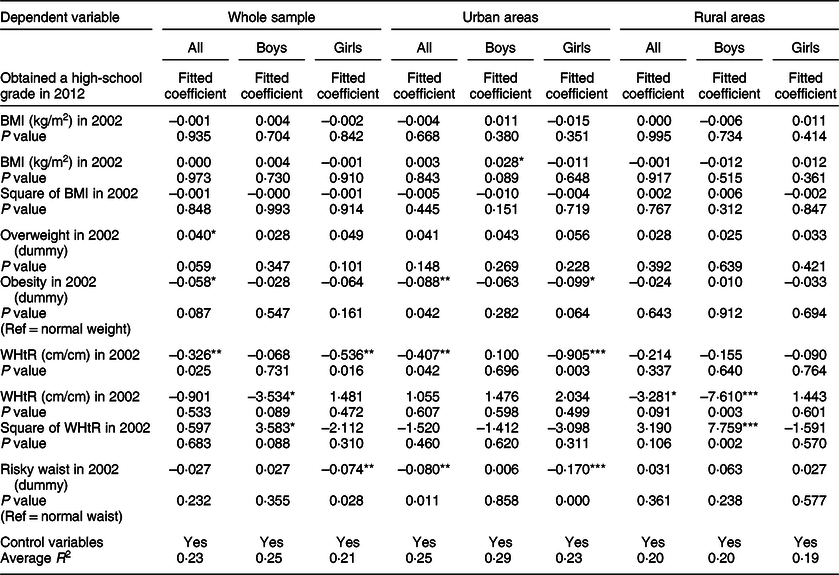
Each OLS regression is separated by a gap. For BMI and WHtR, three specifications are systematically employed: linear, quadratic and categorical. P-values are based on cluster robust standard errors (at the municipality level). Significance levels of fitted coefficients: ***P < 0·01, **P < 0·05, *P < 0·1.
† All control variables are included: age, gender, baseline education level, maternal cognitive ability score, maternal height, risky paternal WHtR, paternal blood pressure, proxy for parental nutritional knowledge, maternal education level, annual household income, number of children in the household, monthly child-related expenditures, the weekly household food expenditures for fruits and vegetables, carbohydrates, and animal-based products (meats and fats), perceived neighbourhood safety, average annual household income in the municipality concerned, and the population size of the municipality concerned (more than 100 000 inhabitants) for urban and whole samples only.
Source: Mexican Family Life Survey (2002–2012).
The results are consistent for both educational outcomes. In the whole sample (Column 1), Tables 3 and 4 show that the link between BMI and schooling attainment is non-linear. We only observed significant educational penalties from the obesity cut-off. Being classified as obese in 2002 reduced by 0·4 the years of completed education in 2012 (Column 1, Table 3) and reduced by 6 percentage points the probability of obtaining a high-school grade (Column 1, Table 4). In contrast, overweight status is associated with higher school attainment compared with student who were classified as having a normal weight, at least when the probability of obtaining a high-school grade is considered as outcome (Column 1, Table 4). Contrary to BMI-based indicators, the link seems more linear when abdominal fat accumulation is considered. One extra 0·1 unit of WHtR in 2002 reduced by 0·2 the years of completed education in 2012 (Column 1, Table 3) and reduced by 3·3 percentage points the probability of obtaining a high-school grade (Column 1, Table 4).
Disaggregating the whole sample by gender (Columns 2 and 3, Tables 3 and 4), we found that the negative associations between body weight indicators and educational outcomes are only significant for girls. Compared with boys, fitted coefficients are around twice stronger. Among girls, obesity and risky waist circumference in 2002, respectively, decreased by 0·6 and 0·5 the years of completed education in 2012 for instance (Column 3, Table 3).
Tables 3 and 4 also show important heterogeneous effects according to living area. In urban settings, the trends remain the same as observed in the whole sample, although fitted coefficients are stronger (Columns 4–6, Tables 3 and 4). We continued to observe a negative link between excess weight and educational outcomes, which is only significant for girls and from a certain level of BMI (i.e. obesity). Among urban girls, suffering from obesity or risky waist circumference in 2002 decreased by around 1 year the years of completed education in 2012 (Column 6, Table 3). This latter finding suggests that having a flat abdomen in school might lead to better educational outcomes among female students living in urban Mexico, compared with girls with higher waist circumference.
In contrast, the link between body weight and schooling attainment is fundamentally different among rural students, especially for boys (Columns 7–9, Tables 3 and 4). We only found a significant and non-linear link when a quadratic specification of body weight is used (Column 8). Surprisingly, we observed a U-shape relationship between WHtR and educational outcomes, with a turning point around 0·5 unit of WHtR (i.e. the cut-off for a risky waist). This surprising result might come from the low proportion of obese students in the rural sample, as shown in Table 1 and online Supplemental Table A3. It could mean that a small number of students with excess weight, probably children from favourable backgrounds, completed high levels of schooling.
Household income-specific regressions show interesting findings (Table 5). Among low-income households, there is no significant association between childhood body weight and the years of completed schooling, once controlled for observable confounding factors (Column 1). However, baseline obesity remains significantly associated with educational failure among high-income families (Column 3). Surprisingly, baseline overweight status is associated with better school achievement among middle-income households (Column 2), highlighting the presence of non-linearities in the body weight–schooling relationship in Mexico.
Table 5 Association between childhood body weight (in 2002) and the years of completed schooling in 2012 according to household income groups (OLS estimates)†

Each OLS regression is separated by a gap. Low-income, middle-income and high-income groups refer to households that belong to the first, the second and the third tercile of annual household incomes, respectively. For BMI and WHtR, three specifications are systematically employed: linear, quadratic and categorical. P-values are based on cluster robust standard errors (at the municipality level). Significance levels of fitted coefficients: ***P < 0·01, **P < 0·05, *P < 0·1.
† All control variables are included: age, gender, baseline education level, maternal cognitive ability score, maternal height, risky paternal WHtR, paternal blood pressure, proxy for parental nutritional knowledge, maternal education level, number of children in the household, monthly child-related expenditures, the weekly household food expenditures for fruits and vegetables, carbohydrates, and animal-based products (meats and fats), perceived neighbourhood safety, average annual household income in the municipality concerned, and the population size of the municipality concerned (more than 100 000 inhabitants) for urban and whole samples only.
Source: Mexican Family Life Survey (2002–2012).
Propensity score matching estimates
As explicitly evidenced in online Supplemental Figs A4a–c, radius caliper matching significantly reduced observed differences between treated and control groups (i.e. overweight/obese v. normal weight; obese v. non-obese; and abdominal fat concentration v. normal abdomen). For each confounder, there is no significant mean gap according to treatment assignment once the matching procedure was implemented (online Supplemental Tables A6a–c). Additional tests exhibited in the bottom of Tables A6, such as propensity score R 2, mean bias and Rubin’s balance tests, also suggest that radius caliper matchings constructed good statistical twins based on observed characteristics(Reference Caliendo and Kopeinig50).
Tables 6 and 7 present the average treatment effect regarding the length of schooling and the probability of obtaining a high-school grade, respectively. The results are consistent with previous OLS estimates. Childhood body weight in 2002 does not infer schooling outcomes 10 years later in rural Mexico, neither for boys, nor for girls. In contrast, we found negative and significant educational penalties induced by childhood obesity and abdominal adiposity in urban areas, especially for girls.
Table 6 Average effects of childhood excess weight (in 2002) on the years of completed schooling in 2012†
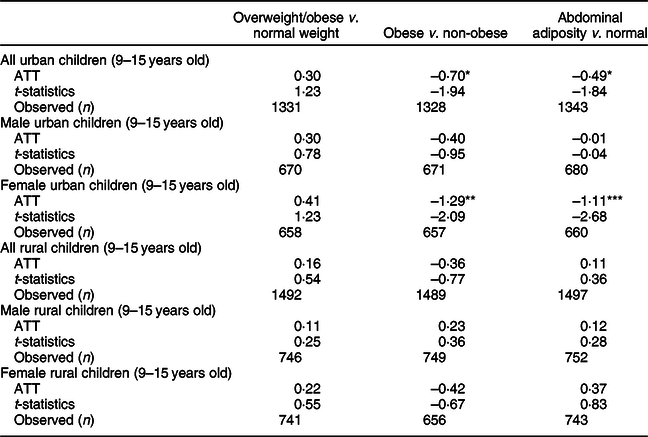
Significance levels: ***P < 0·01, **P < 0·05, *P < 0·1.
† ATT is the average treatment effect: the difference in years of completed schooling between treatment group and control groups. Radius caliper matchings are employed between treated and untreated units, and then bivariate mean comparison tests between matched groups are employed.
Source: Mexican Family Life Survey (2002–2012).
Table 7 Average effects of childhood excess weight (in 2002) on the probability of having achieved high school grade (bachillerato) in 2012†
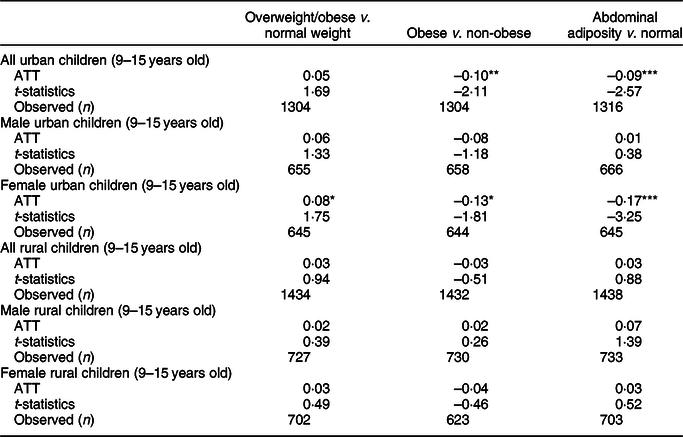
Significance levels: ***P < 0·01, **P < 0·05, *P < 0·1.
† ATT is the average treatment effect: the difference in average years of completed schooling between treatment group and control groups. Radius caliper matchings are employed between treated and untreated units, and then bivariate mean comparison tests between matched groups are employed.
Source: Mexican Family Life Survey (2002–2012).
Childhood obesity and abdominal fat concentration decrease by around 1·1/1·3 years the level of schooling attainment for urban Mexican girls (Table 6). Similarly, Table 7 shows that childhood obesity and central adiposity have negative fitted effects on the probability of obtaining a high-school grade (i.e. a reduction by around 13–17 percentage points). Surprisingly, when overweight and obese children are matched to normal-weight counterparts, we did not found any significant effect, excepted for female urban children (Column 1, Table 7). Indeed, overweight girls have a higher probability of obtaining a high-school grade compared with their slimmer counterparts, which once again highlights a certain valorisation of overweight in Mexican schools.
Regarding heterogeneous effects related to economic backgrounds, PSM estimates confirm previous OLS results (Table 8). Among high-income households, baseline childhood obesity decreases by around 1 year the years of completed schooling in 2012 (Column 3). In contrast, among middle-income households, baseline overweight status is associated with a greater school attainment (Column 2). For low-income households, no significant average treatment effect is found (Column 1).
Table 8 Average effects of childhood excess weight (in 2002) on the years of completed schooling in 2012 by household income groups†
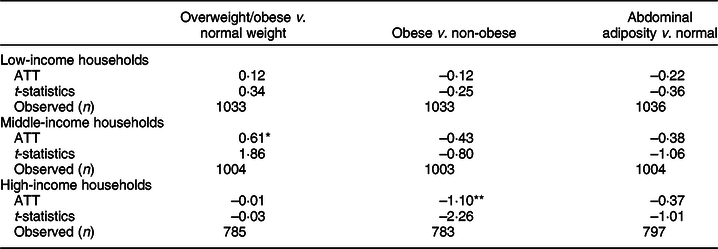
Significance levels: ***P < 0·01, **P < 0·05, *P < 0·1.
† ATT is the average treatment effect: the difference in average years of completed schooling between treatment group and control groups. Low-income, middle-income and high-income groups refer to households that belong to the first, the second and the third tercile of annual household incomes, respectively. Radius caliper matchings are employed between treated and untreated units, and then bivariate mean comparison tests between matched groups are employed.
Source: Mexican Family Life Survey (2002–2012).
It is worth noting that PSM estimates are relatively robust to potential hidden bias, especially concerning the probability of obtaining a high-school grade (Tables 9 and 10). In Column 1 of Tables 9 and 10, Gamma values (Γ) reflect the degree of unobserved heterogeneity for which inference and magnitude from PSM estimates may change. Next columns present related Hodges–Lehman’s CIs and Wilcoxon tests’ P-values (i.e. signed-rank test). When Γ = 1, hidden bias is assumed inexistent, but for each bound of 0·1, hidden bias rises by 10 percentage points. PSM estimates are considered sensitive to a Gamma degree of hidden bias when the CI includes the 0 value and/or when the P-value exceeds 10 %. For example, regarding the impact of childhood obesity on the length of education, we found that the significance of the fitted coefficient disappears when hidden bias exceeds 20 %. However, its magnitude is relatively robust since it remains negative up to 60 % of hidden bias. In the same context of study, previous studies observed a sensitivity of their PSM estimates to potential hidden bias from Γ = 1·2(Reference Han3,Reference Lu, Chou and Lin4) .
Table 9 Rosenbaum bound tests regarding years of education in 2012, full sample of urban children
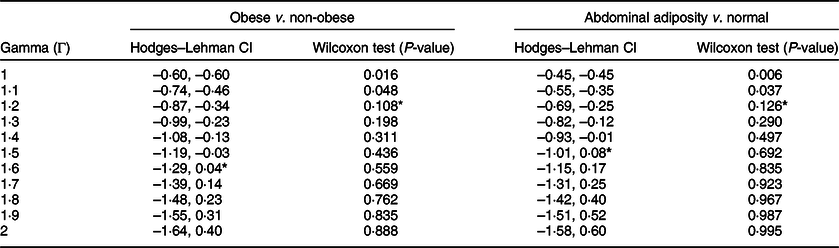
* The Gamma threshold from which PSM results become sensitive to potential unobserved heterogeneity.
Source: Mexican Family Life Survey (2002–2012).
Table 10 Rosenbaum bound tests regarding probability of having achieved high school grade in 2012, full sample of urban children
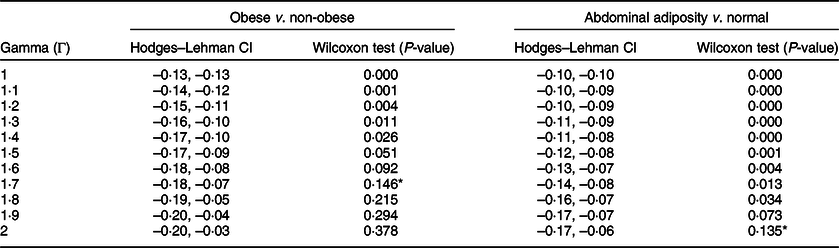
* The Gamma threshold from which PSM results become sensitive to potential unobserved heterogeneity.
Source: Mexican Family Life Survey (2002–2012).
Discussion
Childhood obesity and central adiposity are main concerns for emerging countries where overweight is predominant such as Mexico, Brazil, South Africa and Egypt, by potentially limiting human capital accumulation and future development capacities. The aim was to provide insights about the weight–schooling relationship in the context of such countries. In particular, we focused on the adverse effect of childhood body weight on school attainment using a 10-year long panel data set from Mexico (MxFLS, 2002–2012). To explore the relationship between childhood body weight in 2002 and educational attainment 10 years later, we followed a cohort of adolescents across time and used OLS and PSM estimators. Moreover, we considered general and central body weight measurements based on adjusted BMI (i.e. continuous BMI, overweight and obesity) and WHtR (i.e. continuous WHtR and risky abdominal adiposity), as well as two different educational outcomes (i.e. length of schooling and the obtainment of a high-school grade). Quadratic specifications of BMI and WHtR were also tested. Finally, we performed living area-, household income- and gender-specific analyses given the obvious heterogeneity between these groups in Mexico.
As expected, the relationship between childhood obesity and educational attainment depends on gender and living area. We found that obesity-related educational penalties are stronger for female Mexican schoolchildren and only significant in urban settings. Several studies found similar gender heterogeneity in the USA, Thailand and China(Reference Mo-suwan, Lebel and Puetpaiboon2,Reference Lu, Chou and Lin4,Reference Sabia6,Reference Kaestner and Grossman7) . This adverse effect might particularly transit through the social discrimination channel rather the productivity channel(Reference Palermo and Dowd51). Qualitative interviews implemented in Mexico City suggest that, even if girls use more indirect forms of discrimination (e.g. social exclusion) compared with boys (e.g. verbal, physical and material aggressions), girls are generally subject to greater social pressure concerning thinness ideals(Reference Levasseur and Ortiz-Hernández18).
The non-significant and ambiguous results among rural schooled children in Mexico may have two possible explanations. In theory, since the labour market return to education investment is relatively low in rural Mexico compared with urban areas, there is lower incentive to study and thus lower educational variations between children. In other words, weight-based educational penalties would be too small in rural Mexico to appear as significant given the limited number of observations. Another possible explanation would be a higher diffusion of Western thinness ideals in urban areas compared with rural areas, since media and other cultural goods are more available in cities(Reference Levasseur25).
Furthermore, our findings highlight different weight–education associations according to economic backgrounds. As for rural schooled children, we found no association between baseline body weight and school attainment 10 years later among low-income households. This lack of association emphasises a potential persistence of pro-fat social norms in underprivileged family settings where economic pressures may threaten food security. By contrast, as for urban female students, childhood obesity significantly correlates with lower educational outcomes among high-income households. This result confirms the hypothesis that anti-fat social norms are highly widespread in the richest social groups of Mexico. Finally, among middle-income households, the weight–education association is non-linear: overweight students have the highest years of completed schooling compared with thinner and obese counterparts.
Globally, our findings illustrate a certain acceptance of overweight status against a strong social rejection of obesity status in Mexico. Indeed, although an obese student theoretically has poorer physical health and thus lower schooling productivity than an overweight student(Reference Deckelbaum and Williams52), the stigmatisation channel may also play an important role(Reference Palermo and Dowd51). Results suggest that weight stigma does not concern overweight adolescents but emerges at the threshold of obesity in a qualitative sample of secondary schools located in Mexico City(Reference Levasseur and Ortiz-Hernández18). Several authors drew the same conclusions in the USA, finding no gap in stigma risks between normal-weight and overweight adolescents(Reference Classen19,Reference Pearce, Boergers and Prinstein53) . By contrast, they found a significant stigma gap between normal-weight and obese adolescents, especially for women. It means that a moderate excess weight might not be especially stigmatised in US schools, nor in Mexican schools. This assumption is particularly relevant for Mexico considering that the Mexican beauty stereotypes at school are characterised by muscles and strength for boys and by voluminous shapes for girls(Reference Levasseur and Ortiz-Hernández18). These latter findings crystallise the relative social acceptance of childhood excess weight in Mexico when fat is concentrated around body parts perceived by the majority as aesthetical, for example, homogenous fat distribution for young men (e.g. subcutaneous fat accumulation) and a fat concentrated around the chest, buttocks and hips for young women(Reference Toro, Gomez-Peresmitré and Sentis54). In contrast, as suggest our findings, abdominal fat concentration (perceived as unaesthetic) might be highly stigmatised. Note that the educational benefits associated with overweight status can also be explained by a high proportion of inclusion errors in this BMI-based category among the Mexican paediatric population. As shown in Table 2, 62 % of the Mexican adolescents were potentially classified as being overweight because of muscular overdevelopment, balanced fat distribution in the body (e.g. subcutaneous adiposity) or fat concentration apart from the abdomen (e.g. hips, buttocks and chest), which are considered as aesthetic body shapes in Mexican schools(Reference Levasseur and Ortiz-Hernández18). Consequently, this study opens the way for new research prospects concerning the co-occurrence of anti-fat and pro-fat social norms in developing countries and their complex impacts on school attainment, but also on professional achievement. This co-occurrence of anti-fat and pro-fat social norms have important implications for public policy, namely about awareness anti-obesity programmes.
The main limitation of this study relates to the time-invariant measurement of childhood body weight between 2002 and 2012. Indeed, as mentioned earlier, our model design does not take into account body weight trajectories on the period. Even if all large proportion of excess weight children remained overweight on the period, there is a substantial proportion of normal-weight individuals who became classified as overweight or obese (online Supplemental Table A4). This matter potentially understated our estimates of weight-related educational penalties. Therefore, one should consider that the impact of childhood obesity on educational failure can be stronger (and not lower) than the effect that we estimated. Note that this issue might partly explain our mixed results for boys, rural settings and overweight status. Furthermore, the exclusion of the residual subsample of underweight students reduces the generalisation power of the study. All these limitations call for further research using different identification strategies.
Acknowledgements
Acknowledgement: The author thanks Matthieu Clément and Dolores Jiménez-Rubio for their precious help. Financial support: The study did not beneficiate from a specific financial support. Conflict of interest: The author has no conflict of interest to declare. Authorship: P.L. is the sole author of this article. Ethics of human subject participation: Regarding the use of the Mexican Family Life Survey, no ethical approval is required. This database is anonymous and does not contain personal information. Please see the website for more details about the data: www.ennvih-mxfls.org. The author is responsible for all remaining errors.
Supplementary material
For supplementary material accompanying this paper visit https://doi.org/10.1017/S1368980020002906


