


The prevalence of childhood overweight and obesity has been increasing throughout the world. In many developed countries, it is considered a public health issue(1). In developing countries, such as Brazil, the prevalence of overweight in children has grown increasingly in the last two decades(Reference Wang, Monteiro and Popkin2), while some regions of the country still fight childhood malnutrition(3). Cases of malnutrition and excess weight may even occur in the same community(Reference Motta and da Silva4).
An issue that has been drawing attention is that a growing number of children are presenting with conditions that were previously found only in adults(Reference Abrams and Levitt Katz5). This includes type 2 diabetes, high blood pressure and high cholesterol levels(Reference Abrams and Levitt Katz5). They are also more likely to have other longer-term problems, such as cardiovascular and other related diseases, resulting in greater morbidity and mortality in adulthood(Reference Maddah and Nikooyeh6).
Studies have shown that sociodemographic factors such as age, gender, number of siblings and the education level of parents are significantly associated with overweight(Reference Júlíusson, Eide and Roelants7). Regarding this association, data in the Brazilian literature are in disagreement. Some studies show a positive association(Reference Motta and da Silva4, Reference Silva, Balaban and Motta8), while other studies show a negative association – that is, people of higher socio-economic status are less likely to be overweight(3).
Lifestyle factors have also been studied as determinants associated with overweight. The use of active transportation, such as walking and bicycling, has been suggested by experts as a way to improve levels of physical activity and thus improve individual health(Reference Saelens, Sallis and Frank9). At the same time, excessive energy intake from snacks and energy-dense foods can lead to accumulation of body fat and negative changes in the nutritional status of children(Reference Davies10).
Finally, it has been suggested that these above factors interact directly with the environmental conditions(Reference Glanz, Sallis and Saelens11) of the child's physical residence. This is because the geographical and socio-economic characteristics of the neighbourhood are related to food intake(Reference Diez-Roux, Nieto and Caulfield12), food availability(Reference Franco, Diez-Roux and Glass13) and the level of physical activity(Reference Moore, Diez Roux and Evenson14).
While the greatest increase in the incidence of excess weight is occurring among poorer individuals of developed countries, such data are still scarce in developing countries(Reference Maddah and Nikooyeh6). Identifying the factors associated with overweight, especially in children, is essential for the development of intervention programmes that prevent this condition among this age group and consequently in adulthood. There are only a few studies with satisfactory statistical power that can take into account different risk factors simultaneously and control for possible confounding factors in children(Reference Jouret, Ahluwalia and Cristini15). Thus, the objective of the present study was to determine individual and family factors associated with being overweight in children, younger than 10 years of age, in the city of Santos, Brazil.
Methods
The Nutritional Environment Assessment in the City of Santos, Brazil (AMBNUT) is a study conducted to assess environmental influences on food intake and nutritional status of mothers and their children living in different neighbourhoods of the city. A cross-sectional design was used to assess the nutritional status of children less than 10 years of age and their mothers. Families were recruited by stratified random sampling of thirty-five census tracts, designed to be proportional to the administrative areas of the urban territory (10 % downtown, 20 % northwest and 60 % seafront). The present study aimed to analyse individual and household factors related to overweight in the assessed children.
After the selection of census tracts, sectors were enrolled for the identification of eligible households. Inclusion criteria for the study were children being younger than 10 years and 12 months, being a resident of the city and not having any condition that could affect their nutritional status. Three attempts were made at every household to conduct an interview. If there was more than one eligible child in the household, a simple random selection was done to determine which child would be included. After the eligible households were identified, the families were asked to participate in the study, and the interviews were conducted following signed consent from the mothers. According to the sampling design initially planned, twenty families would be randomly chosen from each census tract among those considered eligible. However, since the inclusion and exclusion criteria greatly limited this number, all children identified in a given tract, and whose mothers agreed to participate in the study, were assessed, until twenty interviews were obtained. The answer rate was 70·3 %, when considering the proportion of interviews done at the eligible households.
After the consent of the mother was obtained, a questionnaire was administered by trained interviewers, lasting 100 (sd 22) min. The questionnaire included the following data: identification, gender, age (<6 years and ≥6 years), birth weight (<2500 g and ≥2500 g), level of physical activity and food intake of the children, socio-economic data and household location (seafront, downtown or northwest), used as independent variables; and anthropometric data (weight and height) for calculating the BMI, used as the dependent variable. The socio-economic data were collected through a questionnaire adapted from the Brazilian National Demographic and Health Survey (PNDS), conducted in 2006(3). The socio-economic status of the children (and respective families) was obtained using the classification proposed by the Brazilian Association of Survey Companies(16). The objective of this criterion is to classify urban families into economic classes according to their purchasing power. This classification was used to attribute points to the families according to: (i) the number of appliances in the household, such as colour television, radio, bathroom not shared by other families, car ownership, daily maid, washing machine, video recorder or DVD player, refrigerator and freezer; and (ii) the education level of the person responsible for the household, in this case the mother. The point-based classification system is divided into eight categories (A1 and A2, B1 and B2, C1 and C2, D and E). For the present study, the classifications A, B and C were grouped, forming five categories. Since there was no house in the E category, the final classification had four categories (D, 0 to 13 points; C, 14 to 22 points, B, 23 to 34 points; and A, 35 to 46 points).
The level of physical activity was assessed using a physical activity questionnaire for young people(17), adapted for the Brazilian population. This questionnaire takes into account the number of daily hours a child spends watching television, playing video games or using a computer, the type of transportation the child uses to go to school, day-care facilities or pre-school, and the types and number of sports the child plays.
The food intake of the surveyed children was assessed in two different ways. The first consisted of investigating the frequency of intake of selected groups of food: cookies and biscuits, candies and sweetened beverages (industrialized foods), all classified as unhealthy; and fruits, vegetables and milk, classified as healthy items. Six categories were created for describing the frequency of intake of these groups (‘does not eat or rarely eats’; ‘few times a month but not every week’; ‘every week but only a few times’; ‘many times a week but not every day’; ‘once a day’; ‘more than once a day’). The variable was then analysed by creating a low and high frequency score, where 0 was attributed to the first two categories and 1 to the remaining categories, for each of the food groups. The scores of each food group were added, resulting in a score of 0 to 4 for healthy food groups and 0 to 3 for unhealthy food groups. Intake frequency was considered low when the score was ≤2 for healthy food and ≤1 for unhealthy food; intake frequency was considered high when the score was >2 for healthy food and >1 for unhealthy food.
The food intake of the surveyed children was also assessed using the 24 h recall method(Reference Fisberg, Martini and Slater18). Trained interviewers asked the mothers about all the food eaten by the children, from the moment they woke up in the morning until the moment they went to bed, on the day immediately before the interview. In order to increase the accuracy of the information given by the mothers, the interviewers used kitchen utensils, a photographic book with food pictures and also plastic food models(Reference Lopes and Botelho19), to better estimate the size of portions consumed by the child. The food intake data obtained were processed to determine the amount of energy consumed by each child. The total energy expenditure was then calculated, according to the equations proposed by the Dietary Reference Intake of 2002(Reference Fisberg, Marchioni and Slater20), according to age and gender. The physical activity factor was calculated by cluster analysis to identify groups according to the level of physical activity, based on the variables included in the questionnaire. Children were then grouped as inactive, moderately active and active. Finally, the ratio of total energy intake to total energy expenditure was calculated, and the children were then classified as consuming more or less than 120 % of the recommended intake.
Children aged 2 years or older were weighed by a portable electronic scale (Tanita, Tokyo, Japan), with a capacity of 150 kg and accuracy of 0·1 kg. Height was measured by a portable stadiometer (Alturexata, Minas Gerais, Brazil), with a length of 190 cm and precision of 0·1 cm. The children were weighed and measured barefoot, in light clothes or only in underwear, when possible. Height was determined using the method suggested by Lohman(Reference Lohman21). Whenever possible, children younger than 2 years were measured and weighted standing up, as it was done with the older children. If not possible, they were weighed on their mother's lap and measured lying down, with an adapted measuring board.
Once height and weight measurements were obtained, the BMI (kg/m2) was calculated using the WHO software Anthro version 3·2·2 (http://www.who.int/childgrowth/software/en/). BMI was assessed according to BMI-for-age, following the growth curves proposed by WHO(22). The Z-score was calculated for each child. Since there was found to be only two children with Z-score <−2, for analytical purposes, children were classified as either overweight (Z-score ≥1) or normal weight (Z-score <1).
The statistical analysis used a descriptive, exploratory approach, in order to show the sample characteristics. The χ 2 test was also used to compare the two distinct age groups of the study (categorical variables).
Multiple logistic regression was used to analyse the association between the independent variables – food intake, level of physical activity, economic status and individual characteristics – and the outcome overweight (dependent variable). At first, a univariate analysis between each independent variable and the outcome was performed. Variables with P value less than 0·20 in univariate analysis were selected for the multiple model. The variables were included in the final model according to the forward stepwise method. A variable was considered significant if P < 0·05 in the final model, according to Wald's test. The odds ratio was then calculated for each variable, considering a confidence interval of 95 %. Interactions between significant independent variables were assessed, but the interaction terms were not significant, so they were excluded from the analysis. The likelihood ratio test was used to analyse the significance of the final model, assuming a significance level of P < 0·05. The goodness-of-fit test of Hosmer and Lemershow was used to determine the adjustment of the final model, with a P value close to 1 indicating a well-adjusted model.
All analyses were performed using the SPSS statistical software package version 16·0 (SPSS Inc., Chicago, IL, USA).
The present study protocol was approved by the Ethics and Research Committee of the Federal University of São Paulo (Protocol No. CEP 0275/09 and 0276/09).
Results
A total of 531 children were assessed in the different regions of the city of Santos: 73·1 % from the seafront, 7·9 % from downtown and 19·0 % from the northwest area. Of those surveyed, 36·9 % were classified as overweight and 52·4 % were males. Given the wide age range covered by the study (10 years), the children were divided into two age groups: those aged ≤5 years and 11 months; and those aged ≥6 years and <10 years. Table 1 shows the comparison of the different variables used in the study for the two age groups.
Table 1 Characteristics of the population according to age group: children under 10 years of age living in the city of Santos, Brazil

*Class A, high socio-economic status; class B, medium high socio-economic status; class C, medium low socio-economic status; class D, low socio-economic status.
There was no difference in the prevalence of excess weight in both age groups (35·4 % and 38·9 %, respectively; P = 0·417), or in the percentage of males (52·3 % and 52·4 %, respectively; P = 0·985). Only one child in the older group was not attending school when the study was done. Among the younger children, 42·4 % were not yet attending any type of educational institution.
Younger children consumed healthier food less frequently than the older children (57·3 % and 39·3 %, respectively; P < 0·001). Moreover, younger children consumed more energy than their requirements (51·0 % and 35·4 %, respectively; P < 0·001), compared with older children.
Regarding physical activity, the younger children spent less time watching television (<2 h/d: 60·6 % and 42·4 %; P < 0·0 0 1) or playing video games/using a computer (does not play: 72·5 % and 18·4 %; P < 0·001) than the older children, but they also were less involved in physical activities or sports (inactive: 81·1 % and 49·3 %; P < 0·001). Moreover, younger children walked and biked less than the older children (33·1 % and 71·2 %; P < 0·001), while the older children used cars more often to get around (45·5 % and 31·5 %; P = 0·02).
The two groups differed regarding the age and nutritional status of the mothers: there was a greater percentage of overweight among mothers of the younger children (53·6 % and 40·6 %, respectively; P = 0·003). There was no significant difference between the other socio-economic variables, except for the education level of the mothers, which was greater among the younger children (37·7 % and 25·8 %; P = 0·004).
After the selection of the variables with P value less than 0·20 in univariate analysis, multiple analysis showed that socio-economic status and level of physical activity, expressed by the type of transportation used by the child, were associated with overweight in the younger children, as shown in Table 2. Children in the lowest socio-economic category were 7·7 times more likely to be overweight than children of the same age with better socio-economic status, independent of other factors (OR = 7·73; P = 0·02). Likewise, children who used a type of transportation other than walking or biking to school were 1·7 times more likely to be overweight than those who walked or biked to school (OR = 1·70; P = 0·05). Both values were adjusted by the age of the mother. The final model had an adjustment of 0·977 according to the Hosmer–Lemershow test.
Table 2 Association between individual and family variables and overweight: children aged <6 years living in the city of Santos, Brazil

*Variables with P < 0·20 in univariate analysis.
†Variables with P < 0·05 in multiple analysis.
‡Class A, high socio-economic status; class B, medium high socio-economic status; class C, medium low socio-economic status; class D, low socio-economic status.
§OR adjusted for mother's age; Hosmer and Lemershow P = 0·977.
Among children aged ≥6 years, only the socio-economic status of the family (expressed as the education level of the mother) was associated with overweight (Table 3). Children whose mothers had an education level less than high school were 2·0 times more likely to be overweight than children whose mothers had a higher education level (OR = 1·98; P = 0·04), adjusted for the energy intake of the children (given by the percentage of intake that exceeds the recommendation).
Table 3 Associations between individual and family variables and overweight: children ≥6 years living in the city of Santos, Brazil
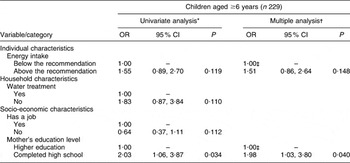
*Variables with P < 0·20 in univariate analysis.
†Variables with P < 0·05 in multiple analysis.
‡OR adjusted for mother's age; Hosmer and Lemershow P = 0·977.
Discussion
The present study emphasizes that the prevalence of overweight in children aged 10 years or less in an urban area of Brazil can be considered a public health issue, as it is in developed countries.
The prevalence of overweight found in both age groups in the present study was greater than that found in other studies in Brazil(3, Reference Motta and da Silva4, Reference Corso, Viteritte and Peres23–Reference Giugliano and Carneiro25). A previous study in the city of Santos found an overweight prevalence of 33·7 %, also above the national data(Reference Costa, Cintra and Fisberg26). The difference found in overweight prevalence among studies performed in Brazil could be attributed to the lack of a standardized method to assess anthropometric measures in the country, which can lead to different classifications of the nutritional status of children. In the present study, BMI-for-age Z-score was used to classify children, since it is the method recommended by the WHO(22).
The prevalence found in the present study was even greater than that found in developed countries like the USA(Reference Ogden, Carroll and Curtin27), Germany(Reference Nagel, Wabitsch and Galm28) and Australia(Reference Sanigorsky, Bell and Kremer29), where the high prevalence of overweight and obesity in children and adults is well known. Like the current study, in Argentina, also a developing country, Hirschler et al. (Reference Hirschler, Buzzano and Erviti30) found an alarming prevalence of excess weight of 34·6 % in children aged 5–13 years. These data may indicate that the lifestyle of the population in developing countries is becoming similar to that of developed countries with regard to less healthy behaviours, such as physical inactivity and consumption of energy-dense foods.
In the present study, being overweight was associated with socio-economic status in both age groups. Among younger children (<6 years), the level of physical activity was also associated with being overweight, adjusted by the age of the mother. Meanwhile, among older children (≥6 years), none of the other variables were significant, with energy intake used only as an adjustment variable for the final logistic model.
Although the younger children consumed more energy than recommended for their age and sex, it was not possible to observe an association between being overweight and food intake among these children. Likewise, Jouret et al. (Reference Jouret, Ahluwalia and Cristini15) did not find associations between energy or nutrient intakes and being overweight when studying children aged less than 5 years in France. Since the relationship between energy intake and accumulation of fat develops over time, children aged less than 6 years may be too young for such a relationship to be observed(Reference Atkin and Davies31). Food intake appears to be more important for older children than younger children, since it was used as an adjustment for the final model, but this relationship was not significant in the present study.
Moreover, an association was not found between the frequency of intake of healthy and unhealthy foods and being overweight for either of the studied age groups, opposite to that found by Hirschler et al. (Reference Hirschler, Buzzano and Erviti30). The absence of this association may be due to the construction of the variable, which considered only the intake of certain chosen foods groups of interest – not from a complete FFQ; or it may be due to under-reporting of the consumption of unhealthy foods by the mothers(Reference Scagliusi, Ferriolli and Pfrimer32), which might have influenced or masked an association with overweight.
Many studies have reported a positive association between being overweight and the amount of time spent watching television(Reference Jouret, Ahluwalia and Cristini15, Reference Davison and Lawson33, Reference Sasaki, Yorifuji and Iwase34). This is likely because children who watch television for more than an hour daily tend to participate less in sports and other physical activities, therefore being more inactive than children who watch less television(Reference Jouret, Ahluwalia and Cristini15). However, the results found in the present study showed that children who spent more time watching television or using a computer had a significantly lower chance of being overweight, opposite to that found in the literature. Through the analysis of other physical activity variables, it was hypothesized that these variables could possibly be acting as confounding factors; that is, they may reflect more the socio-economic status of the children than their actual physical activity level. This hypothesis was based on the fact that wealthier children tend to spend more time on sedentary activities, such as watching television or playing video games/using a computer, than poorer children(Reference Nagel, Wabitsch and Galm28); therefore, the socio-economic level of the children in this sample appears to be playing a major role in their nutritional status. Based on this argument, it was decided to use only the variable type of transportation (on foot/bicycle v. car/bus/taxi) as a proxy measure of the physical activity level of children.
Multiple regression analysis showed that younger children who did not go to school/day care on foot or by bicycle were more likely to be overweight (OR = 1·70; P = 0·05). Among older children, however, none of the physical activity variables investigated in the study had any influence on being overweight. This result suggests that the use of proxy measures for this age group may not be sensible enough to detect the relationship expected; therefore, other methods should be used to determine the physical activity levels for this age group, such as the use of pedometers to determine the hourly amount of MET (metabolic equivalents), in order to accurately determine the impact of physical inactivity on being overweight.
Over the last few decades, the literature has shown that the physical and environmental characteristics of a city can help promote physical activity among residents(Reference Davison and Lawson33, Reference Burdette and Whitaker35, Reference Timperio, Crawford and Telford36) and are related to healthier weight of children and adults(Reference Giles-Corti, Kelty and Zubrick37). In the USA, for example, a study found that 25 % of children less than 10 years of age were more likely to use a more sustainable and active type of transportation – on foot or by bicycle – to go to school when their parents were satisfied with the structure, such as the presence of sidewalks, crosswalks and bicycle pathways, and safety of their neighbourhoods(Reference Hume, Timperio and Salmon38). The city of Santos benefits in this matter, since it has a flat characteristic and a wide distribution of bicycle pathways throughout the city, which stimulates walking and bicycling among residents. Moreover, according to what is discussed by Jacoby et al. (Reference Jacoby, Bull and Neiman39), the present study found that the incorporation of physical activity into daily activities such as going to school on foot or by bicycle has a protective effect against being overweight among children. However, as seen previously, this association was only observed among younger children.
Associations between being overweight and socio-economic status were found in the present study in both age groups. However, this association was measured by two different socio-economic variables. Among the older group, the education level of the mother was used as a proxy to measure socio-economic status, as shown by Nagel et al. (Reference Nagel, Wabitsch and Galm28) and Júlíusson et al. (Reference Júlíusson, Eide and Roelants7). These authors found that the education level of the mother as a socio-economic variable was an important factor for overweight in children. As for the younger group, the education level of the mother showed no relationship with being overweight, so a classification by economic status was then used(16). The data found in the present study show that children of a lower socio-economic status are more likely to be overweight than children of higher socio-economic status. This is different from what was found by other studies in Brazil, in which higher socio-economic status entailed higher prevalence of overweight(Reference Drachler, Macluf and Leite40, Reference Guimarães, Barros and Martins41). Moreover, national data published by the PNDS found that, as the number of years of formal education increases, so does the exposure to overweight and obesity(3). The association found in the present study is similar to that found in developed countries, which also show an inverse relationship between being overweight and socio-economic status(Reference Nagel, Wabitsch and Galm28, Reference Morland and Evenson42–Reference Zenk, Schulz and Israel44).
Recent data have shown that the relationship between socio-economic factors and being overweight results mainly from the access that the population has to healthier and less energy-dense foods. Recently, the term ‘obesogenic environment’ has been used to describe a group of characteristics that promote weight gain, including the access to unhealthy food, proximity to food stores and food service places(Reference Gorman, Lackney and Rollings45). Morland et al. (Reference Morland, Wing and Diez-Roux46) showed an association between the socio-economic characteristics of the neighbourhood in a region of the USA and the location of food stores. It was found that the poorer population had four times less access to food stores that sell healthy foods, such as fruits and vegetables, and thus have a higher risk of being obese(Reference Wang, Kim and Gonzalez47). The causes of this difficult access to food that can protect against weight gain are not clear. They could be related to the fact that food stores that sell these items at lower prices – such as supermarkets(Reference Morland, Diez-Roux and Wing48) – may not be receiving enough incentives to open new stores in less advantaged areas, and could prefer areas where residents have higher incomes. Thus, these poorer areas are occupied by smaller food stores that sell healthy foods at higher prices and unhealthy food at lower prices(Reference Moore and Diez Roux49).
Some limitations need to be considered when interpreting the findings in the present study. First, it is a cross-sectional study, which limits the interpretation of causality of the results in relation to being overweight. Second, some variables, such as the level of physical activity, were reported by parents. This could result in less accurate data or bias that can mask a real association, but would hardly lead to a false significant relationship between variables. Furthermore, analysis of food intake by the 24 h recall was based on only 1 d of the child's food intake, thus it may not take into account the intra-individual variability of the diet. In order to reduce possible errors due to this limitation, different resources were used by the trained interviewers, such as the use of photograph books, kitchen utensils and plastic food models. Given the duration of the interview, it was not possible to investigate a second day of the children's food consumption in this study.
It is also important to emphasize the positive points of the present study. First, all variables were collected directly by trained interviewers in order to reduce possible errors. Second, this is a population-based study and representative of the population of the city of Santos, which means that the data found can be inferred to a population of the same age. Finally, the use of a logistic regression model as a method of statistical analysis allows the factors of interest to be analysed at the same time that possible confounding variables, such as level of physical activity or food intake, are controlled(Reference Hirschler, Buzzano and Erviti30).
Conclusions
The prevention of excess weight in children usually focuses on lifestyle changes that occur at the end of childhood or during adolescence. The results of the present study suggest that interventions should begin during the first years of life, in order to control the growing prevalence of overweight.
The results found in the present study show that this population is being disproportionately and increasingly affected by factors that promote overweight compared with the rest of the country, following the prevalence patterns of overweight seen in developed countries. However, the present study could not find other factors, in addition to socio-economic status, that could be promoting overweight so substantially, since the scope of the analysis focused only on the individual and family levels. Thus, future studies performed in Brazil should aim to study other levels of interaction between the independent variables and overweight. This includes the environment in which the child lives, access to healthy foods and access to areas where physical activities can be performed, all of which may be increasing the prevalence of overweight in this population. It is also essential to analyse the environmental characteristics of the neighbourhood where the child lives, in order to investigate the association between overweight and access to healthier foods.
Acknowledgements
The work was supported by São Paulo State Foundation for Research Support (FAPESP, no. 2009/01361-1 and no. 2008/55969-8). F.B.S. also has a research scholarship from the National Council for Scientific and Technological Development (CNPq, no. 478212/2009-7). There is no conflict of interest. E.d.C.C. and P.A.M. designed the study, conducted the data analysis and wrote the paper. F.H.M.L., D.S.C.d.A., M.A.d.O. and F.B.S. helped in the data collection and data analysis. The authors wish to thank all the families that participated in the study and the interviewers for their cooperation in collecting the data.


