


Reducing population consumption of sugar-sweetened beverages (SSB) is an important public health priority, since consuming SSB contributes to dental problems, type 2 diabetes and obesity( Reference Vartanian, Schwartz and Brownell 1 – Reference Te Morenga, Mallard and Mann 3 ). Environmental factors – including low prices, extensive marketing and ubiquitous availability( Reference French 4 , Reference French, Story and Fulkerson 5 ) – contribute to high SSB consumption, especially among young people( Reference Han and Powell 6 ). There is considerable interest in policies that may reduce SSB consumption, such as increasing prices via taxes, using labels to provide nutrition information or restricting the availability of large portion sizes. Although empirical evidence supports the effects of labelling( Reference Roberto, Larsen and Agnew 7 , Reference Harnack and French 8 ) and price shifts( Reference Epstein, Jankowiak and Nederkoorn 9 ) on reduced SSB consumption, there has been limited work that combines pricing and label strategies simultaneously( Reference Chetty, Looney and Kroft 10 – Reference Elbel, Taksler and Mijanovich 13 ). Moreover, public and political support is moderate for strategies that restrict portion size options or raise prices( Reference Gollust, Barry and Niederdeppe 14 , Reference Donaldson, Cohen and Rutkow 15 ), suggesting new policy tools may be needed if they are to be implemented successfully.
An alternative approach to reducing the high volume of SSB the public consumes would be to remove the price discount applied to larger-sized drinks – the ‘value size’ pricing structure that makes larger-sized drinks cheaper per ounce than smaller-sized drinks. For instance, a common scenario for the pricing of fountain drinks would set a 16-fluid-ounce (473 ml) drink at $US 1·59, a 24-fluid-ounce (710 ml) drink at $US 1·79 and a 32-fluid-ounce (946 ml) drink at US$ 1·99. Under this scenario, the price is 9·9 cents-per-ounce for the small, 7·5 cents-per-ounce for the medium and only 6·2 cents-per-ounce for the large drink (or 37 % cheaper per ounce for the large v. the small size). An alternative pricing strategy would set a consistent price-per-ounce; in this example, if the price were anchored at the per-ounce price of the medium drink (7·5 cents), the new prices would be $US 1·20 for the small, $US 1·79 for the medium and $US 2·40 for the large (or 100 % higher price for the larger v. the small size). Although such a ‘proportional pricing’ policy has yet to be implemented anywhere, it is among the options that researchers, legal scholars and policy analysts have introduced as a possible approach to reduce SSB consumption( Reference Chaloupka and Davidson 16 – Reference Vermeer, Alting and Steenhuis 18 ).
Eliminating the price incentive to choose a larger drink might be expected to lead people to select smaller drinks, because when the price of a product goes up people typically buy less of it( Reference Epstein, Jankowiak and Nederkoorn 9 ). However, evidence supporting this expectation is weak. In an experiment examining proportional pricing v. value pricing for foods and beverages in a hypothetical scenario, Vermeer et al. found that proportional pricing of sodas did not influence beverage choice for the full sample, but did reduce the likelihood that people who were overweight would choose a large-sized drink( Reference Vermeer, Alting and Steenhuis 18 ). Two field experiments testing proportional pricing in more naturalistic settings reported no effect on food selection (neither study focused only on beverages)( Reference Harnack, French and Oakes 11 , Reference Vermeer, Steenhuis and Leeuwis 19 ). However, in each of the aforementioned studies, the difference in pricing across conditions was quite small and no labels or other supplemental information was provided indicating the price-per-ounce. Given the ubiquity of value pricing in the environment, it is possible that consumers never noticed the shift to proportional pricing in these studies.
To provide a stronger test of the effect of proportional pricing on beverage choice, we conducted a randomized field experiment in which fountain beverages were either value-priced or proportionally priced and the price-per-ounce for each drink was or was not simultaneously labelled. We hypothesized that fewer large drinks and more small drinks would be purchased under proportional pricing compared with value pricing. We further hypothesized that adding a price-per-ounce label would strengthen the effects of proportional pricing on reducing the purchase of large-sized drinks.
Methods
We designed a field experiment to modify the pricing structure of beverages sold from a fountain machine at a concession stand at a university cinema offering free movies to a general student population. Over a 10-week period in February to May 2015, we randomly assigned each film showing (forty-seven total showings, of eleven different films) to one of four price structures (Table 1). Films were shown on Thursdays at 19.00 hours and on Fridays and Saturdays at 19.00 and 22.00 hours. Conditions were randomly rotated across the showing days and times, with a few adjustments to condition assignment made in advance to ensure equal distribution of conditions across films that we expected to be more or less popular. One condition – value pricing with no labels – was the normal pricing of drinks at that concession stand. For the proportional price condition, we set the price-per-ounce to that of the medium beverage (7·46 cents) and then adjusted the price of the small and large drinks accordingly (Table 1). The prices (and labels, if applicable) appeared on a small menu board and on a display of cups. Study staff visited the cinema for every screening to check that the correct menu and cups were displayed at least 15 min before the film started. They also tallied observable consumer demographics (gender, apparent age) of a sample of people in line at the concession stand in a 10 min period before the showing to assess any consumer composition differences across conditions. Attendees of this cinema are allowed to bring their own foods and drinks.
Table 1 Prices, labels and sizes offered in the four experimental conditions at the university cinema concession stand, Minnesota, USA, spring 2015
All ounces listed are US fluid ounces (1 US fl. oz=29·5735 ml) and all dollars/cents listed are US dollars/cents.
* The value price was the pricing structure typically used at the cinema.
The key dependent variables came from cash register receipts and are the quantity of fountain drinks by size (small, 16 fl. oz (473 ml); medium, 24 fl. oz (710 ml); large, 32 fl. oz (946 ml)) purchased at each showing. Although the soda machine offered a variety of diet and regular beverages, the cash register data do not distinguish beverages by type (i.e. Coke v. Sprite; diet v. regular). There are no individual-level data available on the consumers who made the purchases. University cinema administrators provided us with data on total attendance at the cinema for each showing, which were collected separately from the concession stand data. No concession stand staff reported any complaints or confusion by consumers over the study period.
Beverage purchases were examined descriptively, across experimental condition, day of week and time of day. Ordered logit regression models (also known as ordinal logistic models) were used to examine beverage size purchased (1=small, 2=medium, 3=large) on the proportional price condition, the label condition and their interaction, to assess statistically significant effects of experimental conditions. We clustered the standard errors on the movie screened (since viewers of a particular film may be similar in ways we cannot observe) and controlled for the time and day of the showing. To interpret the findings, we calculated the marginal effects of each condition, plotting the predicted probabilities of consumers purchasing the small, medium and large size for each experimental condition, adjusting for time and day.
Because no identifiable data were collected from concession stand consumers, the study was determined to be exempt from human subjects review and no informed consent was required. All analyses were conducted using the statistical software package Stata version 13.
Results
Attendance was variable across the showings, ranging from six to 400 people (the maximum cinema capacity), with 1244 people attending showings assigned to condition A, 1049 to condition B, 858 to condition C and 870 to condition D (see Table 1). The estimated population of concession stand visitors (based on study staff observation of a sample in line) was almost exclusively college-age (roughly 95 %) and more female (roughly 59 %), with no significant differences in observed characteristics by condition.
In total, 360 fountain drinks were purchased across the 10-week study. Of these, eighty-eight (24·4 %) were small, 157 (43·6 %) were medium and 115 (31·9 %) were large. Significantly more large-sized drinks were purchased on Fridays (29·6 %) and Saturdays (39·6 %) compared with Thursdays (16·2 %, P<0·05), and at the 22.00 hours showing (40·4 %) compared with the 19.00 hours showing (26·8 %, P<0·01).
Table 2 displays the results of the regression analysis of the effects of price, label and their interaction on the size of beverages purchased, adjusting for day of week, time of day and clustering standard errors by the film. Figure 1 displays the marginal effects based on this regression. Results show that value pricing with labelling led to a statistically significant increase in the odds of purchasing larger drinks. There were no statistically significant effects of proportional pricing, with or without labels, on the size of drinks purchased.
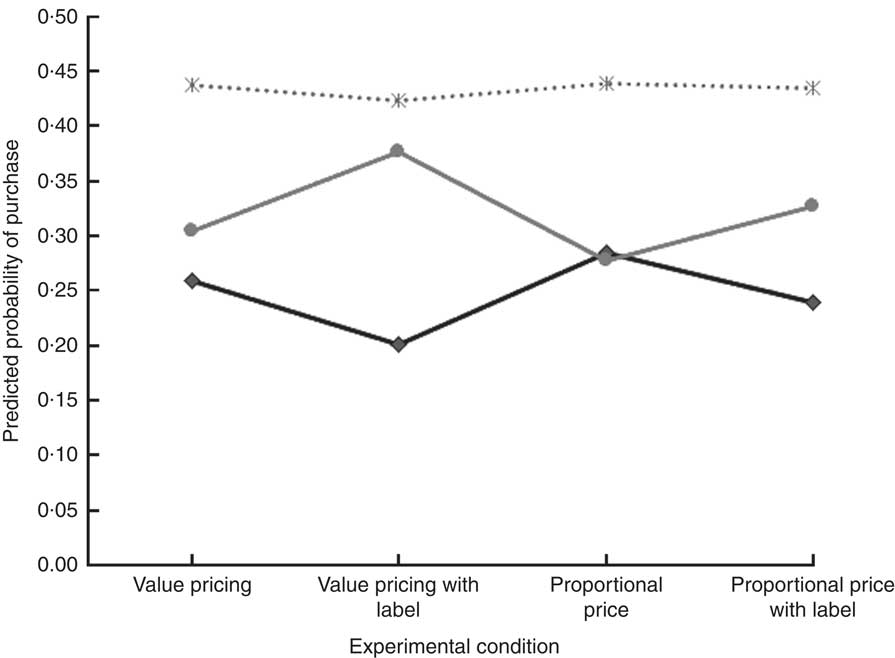
Fig. 1 Predicted probability of sizes of beverage purchased by consumers at a university cinema concession stand, by experimental condition, Minnesota, USA, spring 2015. Shown are the predicted probabilities of purchasing small (![]() ), medium (
), medium (![]() ) or large-sized (
) or large-sized (![]() ) drinks for each of the four pricing and labelling experimental conditions, as calculated from the ordered logit regression model displayed in Table 2. Results are adjusted for the day (Friday, Saturday or Sunday) and time (19.00 or 22.00 hours) of the film
) drinks for each of the four pricing and labelling experimental conditions, as calculated from the ordered logit regression model displayed in Table 2. Results are adjusted for the day (Friday, Saturday or Sunday) and time (19.00 or 22.00 hours) of the film
Table 2 Effects of experimental conditions on the size of beverage purchased from the university cinema concession stand, Minnesota, USA, spring 2015
Shown are the ordered logit regression coefficients and robust standard errors, where the dependent variable is the size of beverage purchased (1=small, 2=medium, 3=large). Errors are clustered on the film.
(*) P<0·10, **P<0·01, ***P<0·001.
Discussion
A field experiment that priced fountain beverages at a consistent price-per-ounce showed no evidence of effectiveness at reducing the size of drinks purchased in a university cinema setting. In contrast, labelling the price-per-ounce under a value pricing scenario (where a large drink was priced and labelled at 6 cents-per-ounce, compared with almost 11 cents-per-ounce for the small) led to more large drinks purchased. The present study is thus consistent with other work demonstrating limited effects of proportional pricing on consumers( Reference Harnack, French and Oakes 11 , Reference Vermeer, Alting and Steenhuis 18 ). It is not clear why the proportional pricing approach with labelling did not lead to correspondingly fewer large drinks purchased. It could be that value pricing is so ubiquitous that consumers did not notice the new prices, even when the price discount for a large drink was eliminated and labelled as so. Alternatively, it could be that communicating price equivalence using labels in the proportional pricing scenario is not as persuasive as communicating the value discount. Although proportional pricing has been proposed by one US-based organization as a possible component among a menu of policy interventions communities might consider( 17 ), more research is needed to clarify both the empirical foundations for and any legal and regulatory challenges of this approach.
Our results should be interpreted with the limitations of the study, sample and broader context in mind. First, the film series was free to all attendees; consumers’ price sensitivity may be different in a setting where they pay not only for their refreshments but also for the entertainment (and where they are not permitted to bring their own drinks). Second, the implemented pricing structure was constrained by our use of the standard prices in this retail setting for the value-priced condition. As a result, the most expensive beverage offered (the large at $US 2·39 in the proportional price offering) was only 50 cents more expensive than the large in the regular value-priced offering and is much cheaper than the prices offered for equivalently sized beverages at commercial cinemas. Third, the study design involved randomized prices and labels that varied for every movie showing for a 10-week period, meaning that some repeat consumers may have been exposed to different pricing structures. Because our data come from receipts and not individuals, however, we were unable to identify repeat visitors to the cinema. Fourth, the cash register data did not distinguish between artificially sweetened and sugar-sweetened beverages purchased, so we were unable to observe whether consumers made different in specific beverage choices in response to the conditions.
In spite of these limitations, the key strengths of the study are its experimental design, observation of real (not hypothetical) purchases in a real-world setting and the use of labels communicating the price-per-ounce, each of which meaningfully extends previous research on proportional pricing for beverages( Reference Vermeer, Alting and Steenhuis 18 ). Field studies, such as this one, have more applicability to the real world and thus more policy relevance compared with laboratory studies involving hypothetical beverage purchases.
Conclusions
Given the public health priority to reduce young adults’ SSB consumption, innovative policy approaches implemented in retail settings are needed, of which proportional pricing is one such option. Implementing studies in other settings can contribute evidence about whether there are contexts and settings where proportional pricing might be most effective in reducing beverage sizes purchased. In particular, as our data and others suggest, if pricing strategies are to be effective, there must be adequate information to help people at the point of purchase attend to the pricing shift (as consumers in the current study appeared to, but only for labels accompanying the value-priced drinks)( Reference Vermeer, Alting and Steenhuis 18 ). In addition, empirical evidence in behavioural economics increasingly challenges the economic model of rational behaviour( Reference Ariely 20 ), suggesting that other factors besides price (such as emotions, norms and beliefs) could be important influences on consumers’ decisions to purchase products. Our study suggests that more work is needed to examine the interaction of pricing and labelling, along with other types of informational approaches, as part of a broader portfolio of policy interventions to shift public norms and ultimately behaviours related to sugary drinks.
Acknowledgements
Acknowledgements: The authors thank research assistants, Allison Stivland and Angela Wong; and Christina Roberto who provided early feedback on the study approach. They also thank James M. White, University of Wisconsin River Falls, for contributions during the early stage of project development. Finally, the authors thank Elaine Caspers and Michele Lorenz at the Coffman Memorial Union at the University of Minnesota for their support of the study. Financial support: Support for this study came from small grants from the Healthy Food, Healthy Lives Institute and the Obesity Prevention Center, both internal to the University of Minnesota. The funders had no role in the design, analysis, or writing of this article. Conflict of interest: The authors have no conflicts of interest to disclose. Authorship: S.E.G. led the design of the study in collaboration with A.J.R. and S.A.F. X.T. coordinated the data collection and conducted data analysis. S.E.G. drafted the manuscript, with all authors contributing to revisions. All authors read and approved the final manuscript. S.E.G. and X.T. had full access to the study data and can take responsibility for the integrity of the data and accuracy of the data analysis. Ethics of human subject participation: This study was determined to be exempt from human subjects review by the University of Minnesota Institutional Review Board.


