


Diabetes mellitus is a leading cause of morbidity and mortality in the USAReference Harris1. The prevalence of diabetes in the US population increased 49% from 1990 to 2000Reference Mokdad, Bowman, Ford, Vinicor, Marks and Koplan2, and the global prevalence of diabetes is projected to double between 2000 and 2030Reference Wild, Roglic, Green, Sicree and King3. Recent clinical trials demonstrate that nutrition is an essential component of successful diabetes managementReference Ohkubo, Kishikawa, Araki, Miyata, Isami and Motoyoshi4, 5. Food selection determines the nutrient and energy content of the diet and affects the metabolic control and risk for co-morbidities associated with diabetes6.
Dietary recommendations for people with diabetes recommend carbohydrate as the largest contributor to total energy intake, but different carbohydrate foods produce different glycaemic responses6–Reference Sheard, Clark, Brand-Miller, Franz, Pi-Sunyer and Mayer-Davis8. The glycaemic response to various carbohydrate-containing foods is related to differences in the rate at which the carbohydrate is digested and absorbed. The glycaemic index (GI) was introduced as a means of ranking carbohydrate-containing foods according to their glycaemic effect, and represents the quality of carbohydrate consumedReference Miller9. Glycaemic load (the product of the GI of individual foods and their carbohydrate content) characterises the impact of foods or dietary patterns with different macronutrient composition on glycaemic response and takes into account the quality and quantity of carbohydrate consumedReference Ludwig10. A low glycaemic load (GL) diet has been linked to decreased risk for type 2 diabetesReference Hodge, English, O'Dea and Giles11–Reference Salmeron, Manson, Stampfer, Colditz, Wing and Willett13 and colorectal cancerReference Michaud, Fuchs, Liu, Willett, Colditz and Giovannucci14, Reference Franceschi, Dal Maso, Augustin, Negri, Parpinel and Boyle15. Similarly, a lower GI diet has been associated with a lower body mass indexReference Ma, Olendzki, Chiriboga, Hebert, Li and Li16 and improved insulin sensitivityReference Jarvi, Karlstrom, Granfeldt, Bjorck, Vessby and Asp17, glycaemic controlReference Anderson, Randles, Kendall and Jenkins18–Reference Wolever, Jenkins, Vuksan, Jenkins, Buckley and Wong21 and fasting serum lipidsReference Jarvi, Karlstrom, Granfeldt, Bjorck, Vessby and Asp17, Reference Ford and Liu22, Reference Jenkins, Wolever, Kalmusky, Giudici, Giordano and Wong23. A recent meta-analysis of the effect of lower GI diets in the management of diabetes provided evidence that lower GI diets improve glycaemic control beyond that obtained by high GI dietsReference Brand-Miller, Hayne, Petocz and Colagiuri24.
Effective diabetes management frequently requires the adoption of new behaviours. Social cognitive theory (SCT) has been widely used in health-related research and in diabetes programmes to explain the behaviour change process. Specifically, SCT has been used to develop diabetes prevention interventionsReference Trevino, Pugh, Hernandez, Menchaca, Ramirez and Mendoza25, to evaluate the self-care practices of people with diabetesReference Kingery and Glasgow26, Reference Hurley and Shea27, to assess adherence to diabetes regimensReference Skelly, Marshall, Haughey, Davis and Dunford28 and to implement diabetes education programmesReference Miller, Edwards, Kissling and Sanville29. SCT postulates that behaviour is influenced by the constant interaction among the environment, the personal characteristics of an individual (e.g. outcome expectations, self-efficacy and behavioural capability), the behaviour and results of that behaviour (which can be identified through self-monitoring)Reference Bandura30. An outcome expectation is the expected result of a behaviourReference Baranowski, Perry, Parcel, Glanz and Lewis31. The more positive the result is perceived to be the more likely it is that the person will engage in the behaviour. Self-efficacy is how confident a person feels about performing a specific behaviour in a particular circumstanceReference Baranowski, Perry, Parcel, Glanz and Lewis31. Those with greater degrees of self-efficacy are more likely to engage in the behaviour and persist in the face of obstacles. Self-monitoring provides feedback regarding the effectiveness of the behaviour. According to SCT, people must be exposed to the behavioural goal. Then, outcome expectations provide the motivation for changing behaviour, knowledge ensures the person knows what behaviour to perform, self-efficacy provides the confidence for overcoming obstacles and self-monitoring provides relevant feedback.
Instruments to assess an individual's outcome expectations and self-efficacy regarding carbohydrate intake, self-monitoring blood glucose and diabetes management have not been reported in the literature. As more emphasis is placed on the quantity and quality of carbohydrate consumed (i.e. GL) by people with diabetes to achieve and maintain optimal glycaemic control, valid and reliable instruments are needed to evaluate educational efforts adequately. Therefore, the purpose of this research was to evaluate the psychometric qualities of two instruments designed to assess outcome expectations and self-efficacy regarding carbohydrate intake and self-monitoring for diabetes management.
Methods
Instruments
Two instruments were developed to address self-efficacy and outcome expectations regarding the quantity and quality of carbohydrate intake (i.e. GL) and self-monitoring blood glucose. Items were selected for each instrument that represented the range of beliefs and skills needed to adopt a lower GL diet identified from clinical practice and previous researchReference Miller, Edwards, Kissling and Sanville29, Reference Davis and Miller32, Reference Miller, Probart and Achterberg33. For example, the self-efficacy instrument included 20 questions, with 10 of the questions designed to measure confidence in using the GI to make healthy food choices. The remaining questions assessed confidence to control portion sizes of food, carbohydrate intake and self-monitoring for optimal glycaemic control. Confidence to control both the quantity of food consumed through controlled portion sizes plus confidence to select lower GI foods is one method for achieving a lower GL diet. Response options ranged from 0 = strongly disagree to 10 = strongly agree. Instruments with fewer response options (e.g. 5- or 7-point scales) are less desirable because they are less sensitiveReference Bandura34, Reference Pajares, Hartley and Valiante35. Thus, response options ranged from 0 to 10 for both instruments in this study. Both positively and negatively stated behaviours were included on the instrument. The negatively stated items were reverse scored so that ‘strongly disagree’ received a score of 10.
The outcome expectations instrument included 18 questions designed to measure participants' strength of belief in the relationship among dietary intake, self-monitoring blood glucose, glycaemic control and health. The response options ranged from 0 = strongly disagree to 10 = strongly agree. Once again, both positively and negatively stated expectations were included on the instrument. The negative expectations (i.e. barrier statements) were reverse scored so that ‘strongly disagree’ received a score of 10. For both instruments, the mean score for each construct was obtained by totalling the points and dividing by the number of items comprising each construct to indicate the strength of beliefs or perceived efficacy for each latent constructReference Bandura34.
Assessment of content validity
Content validity exists when an instrument provides systematic coverage of the domain of tasks the instrument is designed to measureReference Benson36. An objective evaluation by content specialists of the depth, breadth and relevance of the items to the content domain is conducted to measure content validityReference Martuza37. Four dietitians and one nurse with multiple years of experience in diabetes education reviewed both instruments for content validity. Reviewers received a brief description of the purpose of the intervention and target audience for whom the instruments were developed, the objectives of each instrument, the items on each instrument and the objective each item was designed to measure. Each reviewer rated the degree to which each item measured its intended objective using a 4-point scale (1 = not relevant to 4 = very relevant) and the degree to which the instrument as a whole measured the content domain using the same 4-point scale. Reviewers were also asked to list areas in the nutritional management of diabetes that were omitted and should be included on the instrument and suggestions for improving each instrument. Reviewers completed their review independently and did not have access to each others' comments or ratings.
Pilot testing of the instruments
Adults 21–75 years of age diagnosed with type 2 diabetes mellitus for ≥ 1 year were recruited over a 6-month period to pilot test the instruments. Subjects were recruited through newspaper advertisements, flyers, diabetes support group meetings, physicians' offices and referral from other participants. All interested subjects were screened for study eligibility through a telephone screening interview. All interested and eligible subjects were mailed the instruments to complete at home with a self-addressed, stamped envelope for return to the investigators upon completion. Individuals reported completing both instruments in ~15 min. Participants provided written informed consent and received a small monetary honorarium upon study completion. All methods were approved by the institutional review board at the sponsoring institution.
Data analyses
Principal components analysis with promax rotation was conducted on data obtained from the administration of the self-efficacy and outcome expectations questionnaires to study participants with diabetes. The number of factors retained was determined based on examination of the scree plot and interpretability of resulting factorsReference Cattell38, Reference Lawrence and Hancock39. Factors with eigenvalues >1.6 and items with loadings >0.45 were retained. Coefficient α was calculated for each construct to assess internal consistency. Coefficient H was calculated to assess the reliability for each construct based on the factor loadings obtainedReference Hancock40. The degree of association among constructs from the outcome expectations questionnaire with constructs from the self-efficacy questionnaire was determined using Pearson correlations. Analysis was conducted using SAS (version 9.1, 2003; SAS Institute).
Results
Results of content validity
The index of content validity is determined by calculating the proportion of items given a rating of 3 or 4 by all reviewersReference Benson36. Scores can range from 0.0 to 1.0. The index of content validity for the self-efficacy instrument and outcome expectations instrument was 0.70 and 0.50, respectively. The index of content validity for the outcome expectations instrument was below the recommended index of 0.70Reference van der Bijl, van Poelgeest-Eeltink and Shortridge-Baggett41. Based on reviewer comments on the items with low relevance ratings on the outcome expectations instrument, three items were modified to be more specific in the outcome described. Two items were deleted since the reviewers believed the questions were ambiguous. Three new items about the degree to which family members would support participants' efforts to eat a healthier diet and monitor their blood glucose were added based on reviewers' recommendations. The final outcome expectations instrument included 19 items. No changes were made to the self-efficacy instrument. The revised version of the instruments was not reviewed again for content validity since minimal changes were made to the items. The revised instruments were mailed to study participants as described above.
Results of pilot testing
One hundred and thirty-seven people with type 2 diabetes responded to recruitment notices and received the instruments for completion. One hundred and eight (79%) returned completed questionnaires. Over half of the sample (57.4%) was male, 92.3% were white and 64.5% were married. The mean ( ± standard deviation, SD) age of the sample was 55.8 ( ± 9.2) years and they had been diagnosed with diabetes for a mean ( ± SD) of 6.3 ( ± 6.3) years (Table 1). The majority (95.4%) of participants reported monitoring their blood glucose at home, and 73.3% reported receiving instruction to follow a meal plan or diet for diabetes management.
Table 1 Characteristics of study participants (n=108)
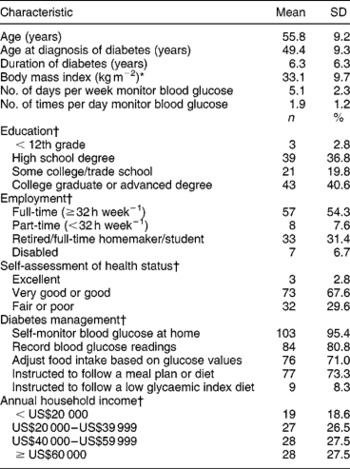
SD – standard deviation.*Based on self-reported measures of height and weight.
† Some items do not equal 100% due to missing data.
The outcome expectations questionnaire yielded three factors: barriers to dietary change, glycaemic control expectations and family support expectations (Table 2). These three constructs accounted for 48% of the variance in these items. Four items did not load on any of the factor scales. All of the coefficient α values for internal consistency were ≥ 0.78. Reliabilities based on coefficient H were ≥ 0.85 for each of the constructs.
Table 2 Factor structure for the outcome expectations questionnaire
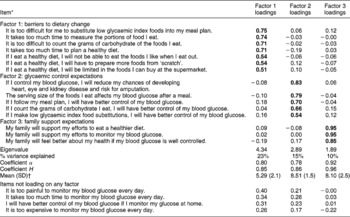
SD – standard deviation.
* Response options ranged from 0 = strongly disagree to 10 = strongly agree.
† The mean score for each construct was obtained by totalling the points and dividing by the number of items comprising each construct to indicate the strength of beliefs for each latent construct.
The self-efficacy instrument yielded three factors: GI efficacy, negative food selection efficacy and self-regulation efficacy (Table 3). These three constructs accounted for 62% of the variance in these items. Three items did not load on a single factor scale. All of the coefficient α values for internal consistence were ≥ 0.77. Reliabilities were acceptable ( ≥ 0.80) for each of the constructs based on coefficient H.
Table 3 Factor structure for the self-efficacy questionnaire
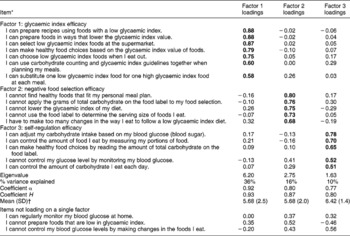
SD – standard deviation.
* Response options ranged from 0 = strongly disagree to 10 = strongly agree.
† The mean score for each construct was obtained by totalling the points and dividing by the number of items comprising each construct to indicate the strength of perceived efficacy for each latent construct.
The strength of the relationship among constructs from the outcome expectations questionnaire and constructs from the self-efficacy questionnaire are shown in Table 4. Self-regulation efficacy was significantly related to each of the constructs comprising the outcome expectations questionnaire. The bivariate correlation between food selection efficacy and barriers to dietary change was 0.44 (P < 0.001). The correlation between GI efficacy and glycaemic control expectations was 0.29 (P < 0.01).
Table 4 Pearson correlations among constructs from the outcome expectations and self-efficacy questionnaires†
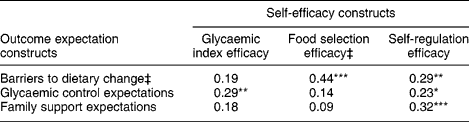
† Response options ranged from 0 = strongly disagree to 10 = strongly agree.
‡ Items comprising these constructs were reversed scored so that 0 = strongly agree and 10 = strongly disagree.
*P < 0.05; **P < 0.01; ***P < 0.001.
Discussion
This study is one of the first reported in the literature concerned with the identification of distinct constructs regarding carbohydrate intake and self-monitoring for diabetes management. Both the quantity and quality of carbohydrate consumed affect glycaemic control, and monitoring the postprandial response can assist individuals in adjusting food intake, energy expenditure and/or pharmacological therapy. Both the positive aspects of controlling food intake and self-monitoring and the barriers to performing these behaviours are captured in the instruments. The review of the items on each instrument by health care professionals with expertise in diabetes care and education enabled us to address the appropriate content domain. Furthermore, the internal consistencies of the constructs were high. This provides some support that each construct is homogeneous and can be used to assess individuals' beliefs and skills.
Coefficient H is a measure of the relationship between a construct and its indicatorsReference Hancock40. It represents the proportion of variance shared by the latent construct and the observed variables and represents a measure of construct reliability. Coefficient H is never less than its best indicator's reliabilityReference Hancock, Mueller, Cudeck, Toit and Sorbom42. As the number of indicators increases, so does coefficient H, and the value of the coefficient ranges from 0 to 1.0. All of the values for coefficient H for both the outcome expectations and self-efficacy constructs were ≥ 0.8, indicating a relatively high degree of construct reliabilityReference Hancock, Mueller, Cudeck, Toit and Sorbom42. A greater degree of construct reliability infers greater certainty in the magnitude of relationships observed among constructs in a given sample.
The constructs identified from the outcome expectations instrument are consistent with domains of diabetes self-care and reflect conceptually coherent clusters of beliefs. Outcomes arise from an action. How a person behaves determines the outcomes one experiences. Positive expectations serve as incentives while negative expectations serve as deterrents. Bandura describes three types of expectations: physical, social and self-evaluative effectsReference Bandura34. In this study, the physical effects are captured in the outcome expectations instrument in the glycaemic control expectations (e.g. If I follow my meal plan, I will have better control of my blood glucose). The social effects are represented in the family support expectations (e.g. My family will support my efforts to eat a healthier diet). The self-evaluative effects are represented by some of the barriers to dietary change (e.g. It is too difficult to count the grams of carbohydrate of the foods I eat). Thus, the outcome expectations instrument captures both potentially positive and negative effects of making dietary changes and monitoring the results obtained. Whether the anticipated outcomes are motivating depends on the value a person places on the outcomes. A highly valued outcome (e.g. optimal glycaemic control) can be highly motivating.
Four items from the outcome expectations questionnaire regarding self-monitoring blood glucose did not load on any factor. Three of the items represented barriers to self-monitoring (i.e. the time, expense and pain associated with monitoring). Over 95% of the sample reported monitoring at home and reported monitoring blood glucose values a mean of 1.9 times day− 1 (data not shown). Thus, most participants performed the behaviour but did not monitor frequently enough throughout the day to capture postprandial glucose excursions. Participants may need more education regarding the relationship between monitoring blood glucose, especially postprandially, and carbohydrate intake to see patterns in dietary intake and the postprandial glucose response. More research is needed to determine the relationships perceived by adults with diabetes between blood glucose self-monitoring and dietary intake to better refine the instrument used in this study.
Individuals who perceive themselves to be highly efficacious expect favourable outcomes. Many of the outcome expectations are related to the same behaviour on the self-efficacy instrument. For example, the efficacy belief ‘I can control the amount of food I eat by measuring my portions of food’ is related to the expectation ‘The serving size of the foods I eat affects my blood glucose after a meal’. People decide on which course of action to pursue and how long to pursue it based on the adequacy of their performanceReference Bandura34. Individuals avoid behaviours that they believe they cannot perform successfully and that they expect will lead to negative outcomes, but they actively pursue behaviours that they believe they can perform successfully and hold promise of valued rewardsReference Bandura34. The self-efficacy instrument includes efficacy beliefs for the behaviours needed to adopt a lower GL diet (i.e. control the quantity of carbohydrate consumed and choose lower GI foods in various settings) and monitor the glycaemic response obtained. The items comprising self-regulation efficacy were significantly related to each of the constructs on the outcome expectations instrument. The items comprising GI efficacy were significantly correlated to glycaemic control expectations. These relationships suggest that individuals who feel more confident in their ability to regulate their dietary intake expect to overcome barriers to dietary change and impact glycaemic control. Further research is needed, however, to determine if education about how to adjust carbohydrate intake based on pre- and postprandial glucose excursions improves participants' efficacy for achieving glycaemic control.
A few limitations of this research should be noted. First, the instruments were administered among a primarily white, well-educated sample. The psychometric properties of the instruments among a culturally diverse sample or a sample of people with type 2 diabetes with limited literacy skills are not known. Secondly, the degree to which education improves participants' outcome expectations and self-efficacy for adopting a lower GL diet requires further research. Thirdly, the relationship between participants' expectations and self-efficacy for adopting a lower GL diet and dietary intake is not known. Whether improvements in these theoretical constructs results in a lower GL diet among people with diabetes requires further evaluation. Finally, controlled feeding studies in which participants have most of their meals provided to them demonstrate that a lower GI diet improves glycaemic controlReference Brand-Miller, Hayne, Petocz and Colagiuri24. Whether the adoption of a lower GL diet improves glycaemic control among a free-living sample of people with diabetes has not been adequately determined and requires further investigation.
Conclusions
The two instruments developed for this study adequately assess outcome expectations and self-efficacy for adopting a lower GL diet and monitoring the glycaemic response obtained. The outcome expectations instrument includes three homogeneous constructs regarding barrier, glycaemic control and family support expectations. The self-efficacy instrument includes three homogeneous constructs regarding GI, negative food selection and self-regulation efficacy. Each instrument can be used independently or in combination to assess areas requiring further education and training to adopt a lower GL diet. The instruments can be self-administered inexpensively in a relatively brief period of time. The instruments can be used to identify behaviours that may be perceived as difficult to change, situations in which there is an increased risk for relapse, or for programme evaluation. The effectiveness of a lower GL diet to improve glycaemic control among people with type 2 diabetes and the role of outcome expectations and/or self-efficacy to mediate this improvement require further research. However, based upon the results of this study, the instruments show promise as tools for increasing our understanding of the relationship between these theoretical constructs and health behaviours.
Acknowledgements
The College of Health and Human Development of The Pennsylvania State University provided funding for this study. The time and participation of study participants are deeply appreciated. C.K.M. and M.D.G. designed the study and carried out all aspects of data collection. F.L. assisted with the statistical analyses.


