


Variability in childhood weight has been linked to future development of chronic disease such as CVD and diabetes(Reference Eriksson, Forsén and Tuomilehto1–Reference Freedman and Sherry3). There is also accumulating evidence that children’s eating behaviours are important determinants of individual variability in children’s weight status(Reference Birch and Fisher4–Reference Webber, Hill and Saxton6). Early environmental influences including parental feeding practices such as excessive control(Reference Birch, Fisher and Grimm-Thomas7,Reference Johnson and Birch8) and emotional use of food(Reference Chan, Magarey and Daniels9) have been postulated to interfere with intrinsic regulation and change children’s ability to effectively use hunger and satiety signals. Thus, children’s eating behaviours appear to be an important determinant of children’s food intake and resultant weight gain.
Instruments to measure children’s eating behaviour have been developed using parental reports as an alternative to behavioural observation as parental ratings are often used to evaluate children’s behaviour(Reference Wardle, Guthrie and Sanderson10). Over the years, several such measurement tools have been developed to assess children’s eating behaviour. The Child Eating Behaviour Questionnaire (CEBQ)(Reference Wardle, Guthrie and Sanderson10) contains the most comprehensive coverage of different eating behaviours and has been tested widely. The development and preliminary validation of the CEBQ were carried out by administration to well-educated parents of children 2–9 years living in the UK(Reference Wardle, Guthrie and Sanderson10).
In the original set of studies to develop the CEBQ, Wardle et al. postulated eight factors, but on analysis, a seven-factor solution was found where food responsiveness and slowness in eating formed one factor. Other studies have reported a seven-factor structure for the CEBQ in the Netherlands(Reference Sleddens, Kremers and Thijs11) and in Sweden(Reference Svensson, Lundborg and Cao12). However, all three studies used Exploratory Factor Analysis to elicit the structure. Many of the more recent studies have confirmed that the CEBQ has the original eight-factor structure(Reference Domoff, Miller and Kaciroti13–Reference Mallan, Liu and Mehta16). All of them used Confirmatory Factor Analysis for testing factorial validity, which is the accepted method(Reference Lewis17). A recent study among a multi-cultural population in Singapore demonstrated using Exploratory Factor Analysis that items for the subscale for Food Responsiveness were distributed among two other subscales(Reference Quah, Cheung and Pang18).
Most studies have been conducted in industrial nations, among well-educated parents in the Netherlands(Reference Jansen, Roza and Jaddoe15), Sweden(Reference Ek, Sorjonen and Eli14), Portugal(Reference Viana, Sinde and Saxton19), Australia(Reference Mallan, Liu and Mehta16) and more recently in the USA(Reference Brown, Perrin and Peterson20). Studies that included Non-Caucasian participants, such as among Hispanics and African Americans(Reference Sparks and Radnitz21) or well-educated Asian in Singapore(Reference Quah, Cheung and Pang18), did not find the original eight-factor structure. They highlighted the need for further studies among non-Caucasian and less-educated parents. Domoff’s study included less-educated African American parents, and the original structure was retained. In a study among three culturally different groups living in Australia, it was found that cultural differences have implications on the validity of the original CEBQ(Reference Mallan, Liu and Mehta16). In the first application of the CEBQ in a low- and middle-income country (LMIC), Cao et al. administered it to mothers of Chinese children aged 12–18 months. They did not test the original structure proposed and recommended a nineteen-item version with three factors(Reference Cao, Svensson and Marcus22).
The inter-correlations among food approach and food avoidant subscales were tested in the original study in the UK(Reference Wardle, Guthrie and Sanderson10). Positive inter-correlations were found between the subscales (e.g. satiety responsiveness, slowness in eating, food fussiness and emotional undereating), and those between the clusters were negative, but small or insignificant. These findings were found by other studies in the UK(Reference Carnell and Wardle23), the Netherlands(Reference Sleddens, Kremers and Thijs11) and Portugal(Reference Viana, Sinde and Saxton19). However, inconsistencies were found in China where correlations of several subscales were not as expected(Reference Cao, Svensson and Marcus22). In addition, there have been reports of issues in the relationship between subscales. A mixed result was found with desire to drink – which belongs to the food approach cluster – positively correlated with both food approach subscales and food avoidant subscales(Reference Mallan, Liu and Mehta16). A discrepant finding was found in the USA(Reference Domoff, Miller and Kaciroti13), Australia(Reference Mallan, Liu and Mehta16) and Sweden(Reference Ek, Sorjonen and Eli14) where emotional overeating was positively correlated with emotional undereating.
Studies that tested convergent validity have produced inconsistent results. The positive associations of food approach subscales with child BMI z-scores were seen with all four sub-scales in Sweden(Reference Viana, Sinde and Saxton19) but only with two subscales in the same country(Reference Sleddens, Kremers and Thijs11). The negative association of food avoidant subscales with child BMI z-scores were found with three subscales in Asia(Reference Quah, Cheung and Pang18), with two in Australia(Reference Mallan, Liu and Mehta16) and not seen in Sweden(Reference Ek, Sorjonen and Eli14). Meanwhile, none of the eating behaviour subscales was significantly related to child’s BMI in China(Reference Cao, Svensson and Marcus22).
Given the above evidence, the context in which psychometric instruments are developed and the target population are important aspects to consider when a measurement developed in a specific setting is transferred to be used in a different setting(Reference Fiese24). The importance of culture and understanding of the concepts in different cultural settings have been well recognised(Reference Ingersoll-Dayton25,Reference Nilsson, Parker and Kabir26) .
Another important consideration is that all the studies were on children, who were normal weight, overweight or obese as this was the predominant pattern in high-income countries. The only study in a LMIC, China, was with mothers of children who were normal weight, overweight or obese(Reference Cao, Svensson and Marcus22). However, many LMIC are still facing the issue of undernutrition, and child eating behaviour is an important determinant. There have not yet been studies that have examined the use of the CEBQ with children who are underweight or thin.
The objective of this study was to assess whether the original factor structure and internal reliability of the CEBQ as a measure of child eating behaviour can be generalised to a setting with considerable undernutrition, with a variety of education levels and socio-economic statuses. The prevalence of underweight and stunting among under 5-year-old children in Indonesia has been reported to be 19·6 % and 37·2 %, respectively(27). Therefore, a research setting in Indonesia provided a suitable setting to further test the generalisability of the CEBQ.
Methods
Study design
The study carried out content validity for cultural adaptation using qualitative methods followed by construct validity using a cross-sectional survey. Data collection was conducted in three different socio-economic settings of Yogyakarta Municipality, Sleman, and Bantul in the Special Region of Yogyakarta, Indonesia from April to August 2016.
Participants
Inclusion and exclusion criteria
The participants for the study were mothers aged 15–59 years and children aged 24–59 months who lived in one of the three districts in the Special Region of Yogyakarta. Mothers were included in the study if they had a child aged 24–59 months. Mothers with a history of pre-term births (<36 weeks) or who had children with congenital and developmental abnormalities and chronic disease or allergy were excluded from the study. These inclusion and exclusion criteria were applied for both the qualitative study and the survey.
Assessment of content validity (qualitative study)
Instrument translation and expert review
The CEBQ was translated into Indonesian (Bahasa Indonesia) by a bilingual researcher and submitted to a panel consisting of a nutritionist, a psychologist, a public health expert and a survey expert. The researcher and panel members were bilingual in Indonesian and English. These experts provided their knowledge on maternal and child health and the contextual factors in Indonesia as well as their insights on the psychological measurement. Each item in the translated CEBQ was reviewed, and possible contextual and cultural factors which may influence the understanding of each item were discussed, as well as whether the specific terms represent the purported meaning in English. Where it was agreed, changes were made to the translated instrument by the expert panel. The expert panel recommended a modification of the Indonesian version of an item ‘My child eats more and more slowly during a meal’ after reviewing the local context and its translation to Indonesian language. A bilingual person who is fluent in Indonesian and English conducted back translation to English. The results of the back translation showed the same meaning as the meaning of the original item in English. The items used in the survey are presented in online Supplementary material 1.
The details of the qualitative study have been described previously(Reference Purwaningrum, Sibagariang and Arcot28). In brief, the study was conducted using in-depth interviews with twenty-four mothers in April 2016. We explored the mothers’ perception and experiences of their child’s eating behaviour using open-ended questions. Interviews were conducted in Indonesian (Bahasa Indonesia) by a researcher who was trained in qualitative research and a note taker (research assistant). All interviews were audio-recorded using a digital recorder and transcribed in Indonesian, then translated into English.
Methods previously used by Nilsson, Parker and Kabir were followed in analysing the data(Reference Nilsson, Parker and Kabir26). The eight subscales of the CEBQ were used as predetermined themes. Two researchers identified ‘pieces of text’ that fitted each theme in each transcript. Then, a match was made of whether they covered the intentions of each item. This is illustrated in online Supplementary material 2. The two researchers made and compared separate analyses. Any discrepancies were discussed, and consensus was achieved between the researchers.
Cognitive interview
The purpose of the cognitive interviews was to elicit from respondents like the study participants whether the instrument was understandable and clear(Reference Ingersoll-Dayton25,Reference Knafl, Deatrick and Gallo29) . We invited five mothers with a minimum education level of senior high school to read and answer all questions in the questionnaire and determine whether they were clear. Items that were perceived as vague or unclear were discussed. Participants were also asked to suggest ideas on how to improve the wording of any difficult items. Constructive feedback from respondents in this step was used to refine the items.
Assessment of construct validity (quantitative study)
The data for the psychometric tests of the modified CEBQ were collected at integrated service posts (ISP). ISP are community-based health services in which activities are primarily performed by community health workers. We purposively selected four ISP in urban areas, seven ISP in suburban areas and two ISP in rural areas. After the list of eligible study participants was obtained from the ISP, eligible participants were invited by community health workers to visit the ISP. Researchers then confirmed the eligibility of the participants and obtained written consent from them. The interviewers administered the questionnaire to the mother during the ISP visit. In total, 238 mothers and child pairs participated in the study. The survey was conducted in July and August 2016.
Measures
Demographic characteristics such as mother’s age, highest education level, occupational status, ethnicity and category of the residential area were collected. For the child, data collected included gender, age and ethnicity.
The CEBQ tested consisted of eight subscales: enjoyment of food with five items, desire to drink with three items, slowness in eating with four items, food fussiness with six items, food responsiveness with four items, emotional overeating with four items, emotional undereating with four items and satiety responsiveness with five items. This included three new items that were added following the qualitative study; two items were added to food fussiness, and one new item was added to satiety responsiveness. Mothers rated child eating behaviours on a five-point Likert scale (from 1 = never; 2 = seldom; 3 = sometimes; 4 = often; 5 = always). There were five items that were reverse-coded. The CEBQ version used with items is in online Supplementary material 1.
The researchers with two assistants measured the weight and height of mothers and children. Weight measurements were performed twice using a calibrated digital scale. Height was assessed twice using a calibrated portable stadiometer. The mean of weight and mean of height were used to calculate BMI for each mother and child. Each child’s BMI z-score was determined using WHO Anthro version 3.2.2 recommended by the WHO for child growth standard(30). We also categorised each child’s nutritional status based on the International Obesity Task Force (IOTF) BMI cut-offs(Reference Cole and Lobstein31). The IOTF standard considers a child’s gender, age and BMI in determining a child’s nutritional status. Each mother’s BMI was calculated and categorised using the proposed cut-offs for Asian populations(32).
Statistical analysis
Descriptive statistics were conducted to ascertain demographic characteristics and the BMI of mothers and children. The response options were based on five-item Likert scales, which have ordinal properties and there was skewness and/or kurtosis in the data, so the assumptions of multivariate normality were often violated. Best practice recommendations were followed to analyse the data using the mean and variance adjusted weighted least square estimator available in mPLus software(Reference Finney, DiStefano, Hancock and Mueller33). The Confirmatory Factor Analysis model testing procedures of model specification, identification, estimation and testing model fit were followed(Reference Kelloway34,Reference Kline35) . Model fit was assessed using the following indices: root-mean-square error of approximation, ideally <0·06; Tucker Lewis Index and Comparative Fit Index, ideally >0·90(Reference Hu and Bentler36). We judged the acceptability of model fit on the relative closeness of fit indices to the ideal values and re-specified the models based on both statistical (modification indices, factor weights) and substantive grounds (see Results section). Instrument convergent validity was assessed by examining the association of the mean factor scores of each subscale with child BMI z-score adjusted for age and gender. Discriminant validity was tested using factor–factor correlations. ANOVA test for trend was conducted to test predictive validity. Cronbach’s alphas were calculated to assess the internal reliability of the subscales. The Stata program (StataCorp LLC, version 13) and mPlus were used for these analyses.
Results
Results from the assessment of content validity
The results of content validity are given in Table 1. The analysis revealed that all items in the CEBQ were represented under the eight pre-determined themes in the transcripts. Three new items that were frequently found in the interview transcripts were identified. Two were added to the food fussiness construct and one to the satiety responsiveness construct. This cultural adaptation process resulted in an instrument with thirty-eight items to be used for the survey. The inter-rater reliability of Cohen’s Kappa was 0·71 (P < 0·05).
Table 1 Content validity and inter-rater reliability for CEBQ subscales
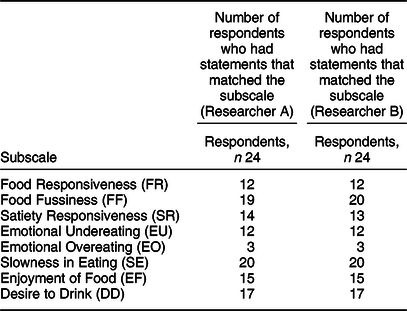
Cohen’s Kappa = 0·71 (P < 0·05).
Results from the assessment of construct validity
The basic characteristics of the 238 participants are shown in Table 2. More than half (52·52 %) were from the rural area in Bantul District. The mean of mothers’ age was 31·6 years old (±6·2 sd), and the mean of children’s age was 41·3 months (±10·3 sd). Based on the IOTF classification for Asian populations, 56·7 % of the mothers were overweight or obese. The international (IOTF) cut-offs suggest 38·2 % of the children were undernourished. Most mothers are Javanese and housewives (not in paid employment). Approximately 59 % of the respondents had graduated from senior high school.
Table 2 Basic characteristics of the respondents
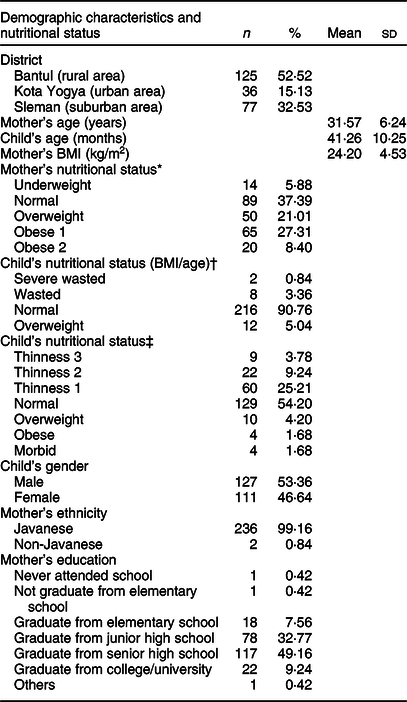
* Cut-offs for Asian populations(32).
† WHO standard (WHO, 2008)(30).
‡ International (IOTF) BMI cut-offs for child thinness, overweight and obesity(Reference Cole and Lobstein31).
Analysis of factor structure
The analysis was commenced with thirty-eight items, and a series of iterations were conducted, based on the accepted methods of identifying the best model. We first tested a seven-factor model combining food responsiveness and emotional overeating, similar to others(Reference Wardle, Guthrie and Sanderson10–Reference Svensson, Lundborg and Cao12). In the first iterations of the Confirmatory Factor Analysis, the new items were omitted due to their low loadings. Eight items from the original CEBQ (one item in satiety response, three items in food fussiness, one item in emotional undereating, one item in slowness in eating, one item in emotional overeating and one item in enjoyment of food) were removed based on statistical and substantive grounds. The results of the seven-factor model were: χ 2/df = 1·84 (P < 0·01); root-mean-square error of approximation = 0·06 (90 % CI 0·052, 0·067); Comparative Fit Index = 0·93 and Tucker Lewis Index = 0·92, with a WRMR of 1·1, providing an acceptable model fit. Then, we tested the eight-factor model, separating the items in food responsiveness and emotional overeating from the retained items. The overall fit of the model with eight factors (twenty-seven items) provided a better fit with χ 2/df = 1·56 (P < 0·01); root-mean-square error of approximation = 0·048 (90 % CI 0·040, 0·057); Comparative Fit Index = 0·95 and Tucker Lewis Index = 0·95, with a WRMR of 0·95. A final model of eight factors with twenty-seven items was retained. Item loadings and factor correlations of the eight scales are in Figure 1. The item ‘my child is always asking for food’ loaded in enjoyment of food, instead of food responsiveness in the original factor structure in Wardle et al. (Reference Wardle, Guthrie and Sanderson10). The results suggest all items were meaningful indicators of the factors as all item loadings were above 0·5.
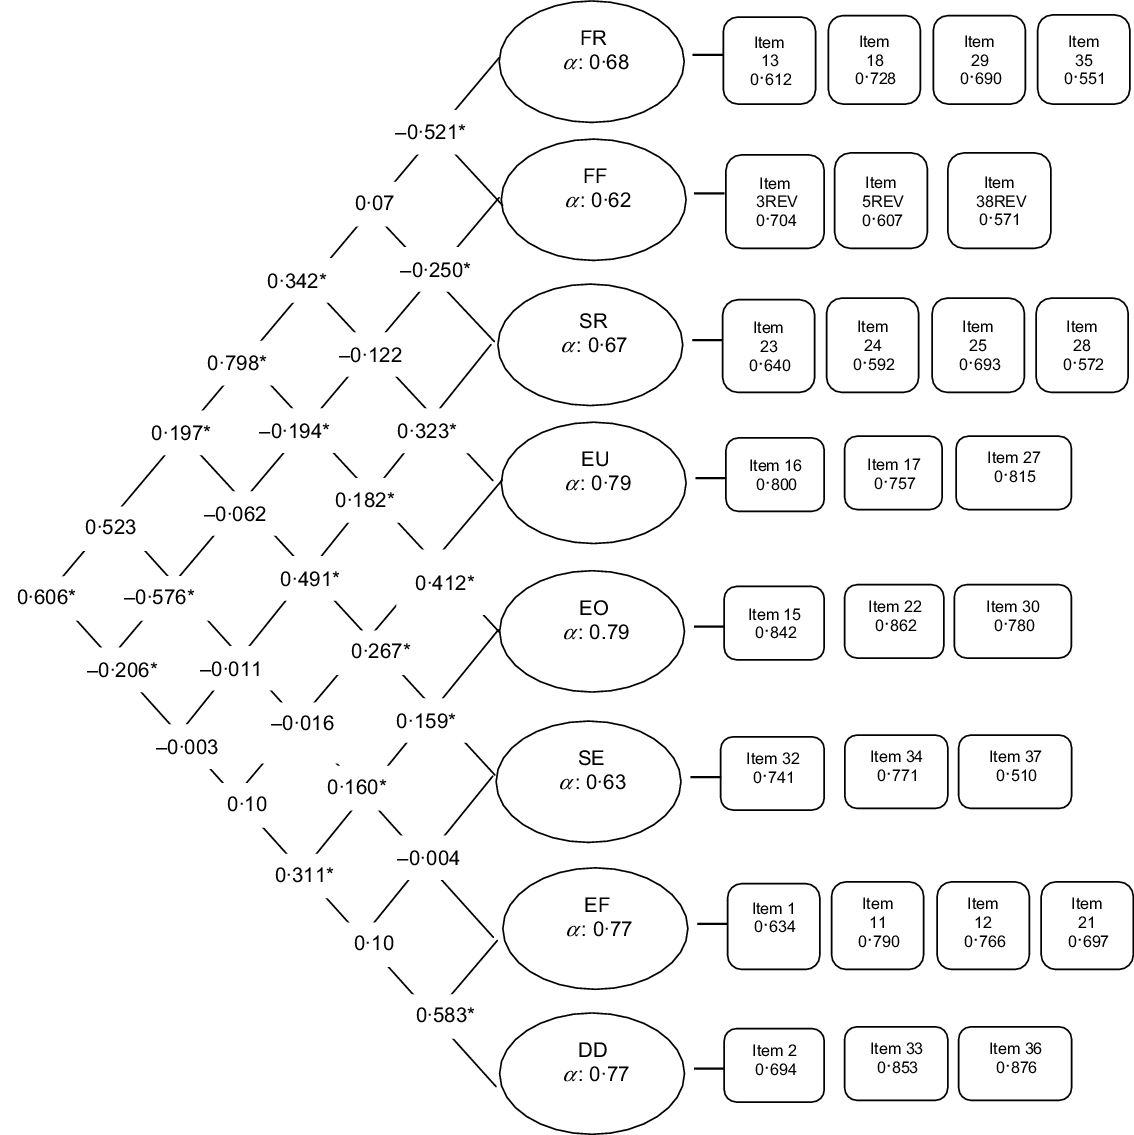
Fig. 1 Results from Confirmatory Factor Analysis of a twenty-seven-item CEBQ with standardised estimates, factor–factor correlations and reliabilities. *P < 0·05
The results of discriminant validity using factor–factor correlations are in Figure 1. Overall, none of the factor–factor correlations was high enough (r ≥ 0·8) to show any overlap of factors: the closest overlap was between food responsiveness and emotional overeating (r = 0·8), but most others were less than r = 0·6(Reference Cao, Svensson and Marcus22). CEBQ subscales that belong to the two categories of food approach and food avoidance showed higher correlations with those in the same category as expected. For example, food responsiveness was highly positively correlated with emotional overeating (r = 0·80) and moderately positively correlated with enjoyment of food (r = –0·52, P < 0·05) and desire to drink (r = –0·61, P < 0·05). On the other hand, food responsiveness was negatively correlated with food fussiness (r = –0·52, P < 0·05) and not significantly correlated with slowness in eating (r = 0·2, P > 0·05) and satiety responsiveness (r = 0·01, P > 0·05).
Reliability as measured by Cronbach’s alpha was higher than 0·75 for emotional undereating, emotional overeating, enjoyment of food and desire to drink. It was close to 0·7 for food responsiveness and satiety responsiveness and <0·65 for two subscales with three items, food fussiness and slowness in eating.
The results of convergent validity of the eight subscales with child nutritional status based on the IOTF cut-off are presented in Table 3. Significant associations were found with two subscales: satiety responsiveness and slowness in eating with the highest mean score in the underweight group and the lowest mean score in the overweight group for both subscales. There were significant linear trends observed across the ordered nutritional status (underweight, normal weight and overweight).
Table 3 Convergent validity of CEBQ subscales with nutritional status
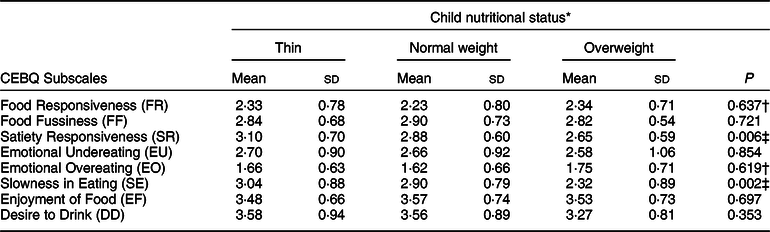
* Categories of child nutritional status according to the international (IOTF) childhood BMI cut-offs for overweight, obesity and thinness (18) were regrouped.
† P-value from Kruskal–Wallis test (mean scores of FR and EO are not normally distributed).
‡ Significant difference and linear trend (P < 0·05) across ordered nutritional status categories.
Discussion
We set out to examine the factor structure and reliability of the CEBQ(Reference Wardle, Guthrie and Sanderson10) administered to mothers of children under 5 years in a LMIC setting among different socio-economic groups and where undernutrition is still prevalent. Our finding suggests the original eight-factor structure was a better fit than the seven-factor model. This is the first study that provides evidence that the original concepts on which the CEBQ was based(Reference Wardle, Guthrie and Sanderson10) can be generalised to a LMIC setting and where there is child undernutrition. We demonstrated content validity of the items of scales and discriminant validity between the subscales. Four factors were shown to have good internal consistency (Cronbach’s alpha > 0·75), and/or four other factors had internal consistency values between 0·6 and 0·7. Two factors (satiety response and slowness in eating) were negatively associated with child nutritional status according to the international (IOTF) cut-offs suggesting limited evidence for convergent validity.
Food fussiness is an important aspect of child eating behaviour that has been investigated in Western cultural settings and is associated with the feeding practice construct known as ‘structure’(Reference Powell, Farrow and Meyer37). Two of the three new items identified in our qualitative study reflected the subscales food fussiness but were not retained in factorial validation due to low loadings. In addition, three items in the original CEBQ were omitted in the modelling process. One explanation could be that the structure of child feeding practice in Indonesia is rather different. The other is that food fussiness is more tolerated and mothers resort to ‘hand feeding’ or distraction. This aspect requires more in-depth studies.
Our test for convergent validity using associations of the measures with child nutritional status provided limited evidence. Only satiety response and slowness in eating, both under the category of food avoidance, were significantly associated with child weight. These findings are similar to studies in high-income countries with high prevalence of child obesity such as the Netherlands(Reference Sleddens, Kremers and Thijs11), Australia(Reference Mallan, Liu and Mehta16), Chile(Reference Santos, Ho-Urriola and González38) and Portugal(Reference Viana, Sinde and Saxton19). Most of the evidence of the associations between other subscales of CEBQ and child weight are from studies that were conducted with children with normal weight and overweight/obesity(Reference Carnell and Wardle23). The study in China did not find any association between child eating behaviour and child BMI, even though the sample was predominantly normal weight and overweight or obese children(Reference Cao, Svensson and Marcus22).
Strength and limitations
To the best of our knowledge, this study is the first study to adapt and test the validity of the CEBQ in a setting where undernutrition remains prevalent. Our study confirmed the eight-factor solution could be replicated in this setting. Well-trained interviewers administered the CEBQ to the respondents. This method was chosen to overcome social bias in which women with lower education may not be able to understand the instrument. However, we acknowledge that the findings cannot be generalised to the wider Indonesian population because the country has diverse ethnicities and socio-cultural backgrounds.
Conclusion
This study to test the validity of the CEBQ supports the original eight-factor structure in a sample of mothers with children aged 2–5 years living in a LMIC country where undernutrition remains a public health issue. Only two subscales demonstrate validity as predicted with child weight status. Further replication of the study and convergent validity testing are indicated.
Acknowledgements
Acknowledgements: The authors acknowledge the assistance of Sugeng for data management and Astri Ferdiana for English translation. We thank the community health workers who provided strong support during the data collection and all the participants in three study sites. We thank all data collectors from Universitas Gadjah Mada who assisted the survey. We thank the Provincial Government of Special Region of Yogyakarta and District Health Offices for their support and permission for the study. Financial Support: This study was supported by The Australia Awards Scholarship from The Department of Foreign Affairs and Trade for a doctoral degree (DNP). The funding body was not involved in the design, implementation, data analysis or manuscript writing of the study. Conflict of Interest: None. Authorship: All authors contributed to the preparation of research design, data collection, data management and data interpretation. D.N.P. and R.J. conceived the study. D.N.P. collected the data with significant assistances from R.A.H. and R.S.R. J.A. and H.H. made contribution to design and implementation of data collection. D.N.P. and R.J. performed statistical analyses and interpretation of the results. D.N.P. and R.J. wrote the first draft of the manuscript. All authors read and accepted the final version of the manuscript and are responsible for its content. Ethics of human subject participation: This study was conducted according to the guidelines laid down in the Declaration of Helsinki, and all procedures involving research study participants were approved by the Human Research Ethics Committee of the University of New South Wales, Australia (HC15826), and the Medical and Health Research Ethics Committee of Universitas Gadjah Mada, Indonesia (KE/FK/196/EC/2016). Written informed consent was obtained from all subjects/patients.
Supplementary material
For supplementary material accompanying this paper visit https://doi.org/10.1017/S136898001900510X


